. 2018 Aug;12(8):1940-1951.
doi: 10.1038/s41396-018-0112-2. Epub 2018 Apr 18.

Micro-scale intermixing: a requisite for stable and synergistic co-establishment in a four-species biofilm

Affiliations

Micro-scale intermixing: a requisite for stable and synergistic co-establishment in a four-species biofilm

Wenzheng Liu et al. ISME J. 2018 Aug.

Abstract

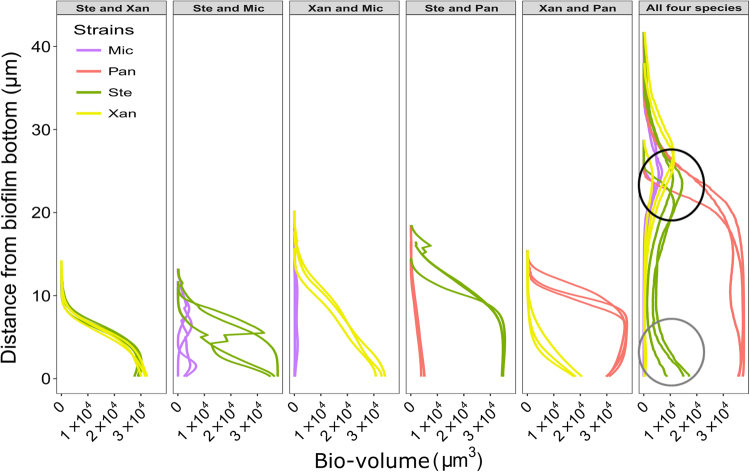
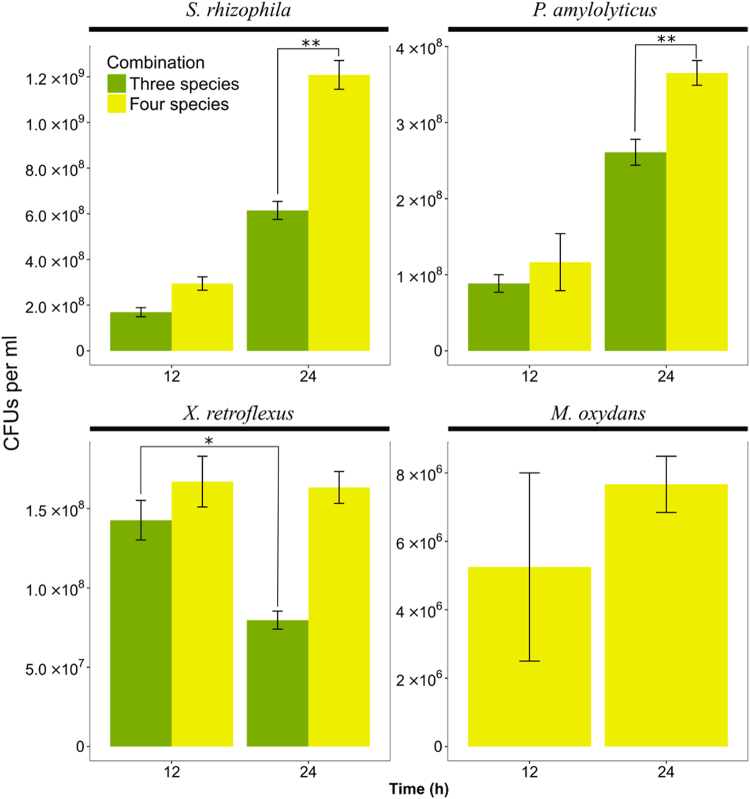
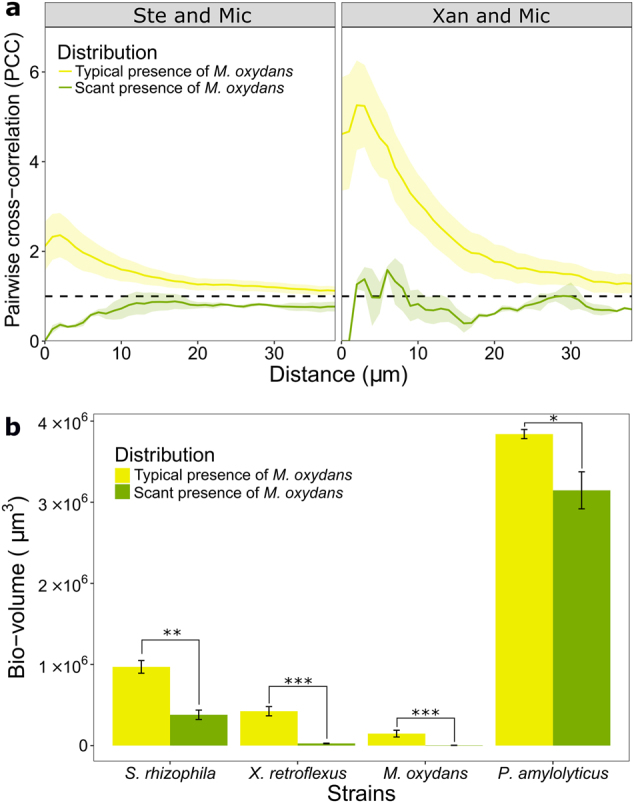
Microorganisms frequently coexist in complex multispecies communities, where they distribute non-randomly, reflective of the social interactions that occur. It is therefore important to understand how social interactions and local spatial organization influences multispecies biofilm succession. Here the localization of species pairs was analyzed in three dimensions in a reproducible four-species biofilm model, to study the impact of spatial positioning of individual species on the temporal development of the community. We found, that as the biofilms developed, species pairs exhibited distinct intermixing patterns unique to the four-member biofilms. Higher biomass and more intermixing were found in four-species biofilms compared to biofilms with fewer species. Intriguingly, in local regions within the four member biofilms where Microbacterium oxydans was scant, both biomass and intermixing of all species were lowered, compared to regions where M. oxydans was present at typical densities. Our data suggest that Xanthomonas retroflexus and M. oxydans, both low abundant biofilm-members, intermixed continuously during the development of the four-species biofilm, hereby facilitating their own establishment. In turn, this seems to have promoted distinct spatial organization of Stenotrophomonas rhizophila and Paenibacillus amylolyticus enabling enhanced growth of all four species. Here local intermixing of bacteria advanced the temporal development of a multi-species biofilm.


Conflict of interest statement

The authors declare that they have no conflict of interest.

Figures

Fig. 1
Fig. 1
Schematic diagram of the 3D pairwise cross-correlation analysis. The diagram is shown in two dimensions, but the actual analysis is conducted in three dimensions. PCC at a certain distance is calculated as the amount of pixels that are of a different color than the focal pixel, divided by the total amount of pixels at that distance (gray zones); this proportion is then normalized to the overall image fill of the two colors, such that random positioning will give a PCC equal to one as in daime [21]. In practice, results are aggregated across many randomly chosen focal pixels, and pixels are aggregated in distance bins
Fig. 2
Fig. 2
Spatiotemporal development of the four-species biofilm. a Confocal images showing the four-species biofilms after 0, 6, 12, and 24 h of growth under flow conditions. Ste; S. rhizophila (green), Xan; X. retroflexus (yellow), Mic; M. oxydans (purple) and Pan; P. amylolyticus (red). Magnification ×40. Scale bar: 50 µm. b Bio-volumes of species in single, dual, and four-species biofilms at 0, 6, 12, and 24 h. Capital letters; S, X, M, and P represent S. rhizophila, X. retroflexus, M. oxydans, and P. amylolyticus, respectively. Error bars represent standard error of the mean of three biological replicates
Fig. 3
Fig. 3
Pairwise cross-correlation analyses of dual and four-species biofilms. The mean PCC value (continuous line) and the standard error of the mean (shaded parts) are plotted against distances spaced at intervals of 1 µm. The dashed horizontal line (PCC value of 1) corresponds to random positioning. Ste; S. rhizophila, Xan; X. retroflexus, Mic; M. oxydans and Pan; P. amylolyticus. PCC values of the six species pairs were calculated from nine stacked images (three biological replicates) obtained from dual and four-species biofilms after 6 (green), 12 (blue), and 24 (red) hours of growth under flow conditions. PCC values of the 24 h four-species biofilms were calculated based on images of local regions with typical densities of M. oxydans
Fig. 4
Fig. 4
Mean of pairwise cross-correlation values of dual and four-species biofilms from 0 to 10 µm as a function of time (6, 12, and 24 h of growth under flow conditions). The red and blue solid lines represent PCC values of dual and four-species biofilms, respectively. The dashed horizontal line (PCC value of 1) corresponds to random positioning. Ste; S. rhizophila, Xan; X. retroflexus, Mic; M. oxydans and Pan; P. amylolyticus. Error bars represent standard error of the mean of the average of 10 PCC values represented in the 0–10 µm interval (n = 3)
Fig. 5
Fig. 5
Distribution of species throughout the mature (24 h of growth under flow conditions) dual- and four-species biofilms. The bio-volume of pixels from each species is plotted against the thickness of biofilms. The four-species biofilm is more than twice as thick as the dual-species biofilms. The black circle emphasizes data showing that S. rhizophila (Ste), X. retroflexus (Xan), and M. oxydans (Mic) reside in the top layers of the four-species biofilm in relatively high cell numbers simultaneously. The gray circle emphasizes data showing a local bio-volume peak of S. rhizophila (Ste) in the bottom layers of the four-species biofilm. Each curve represents individual biological replicates that are the average of three technical replicates
Fig. 6
Fig. 6
CFUs per ml of each strain in the triple-species (green, excluding M. oxydans) and four-species (yellow) biofilms at two time points (12 and 24 h of growth under flow conditions). Error bars represent standard error of the mean from three biological replicates. *P < 0.05; **P < 0.01 (Two-sample t-test)
Fig. 7
Fig. 7
Reduced bio-volumes of all members in local regions within four-species biofilms where the presence of M. oxydans was scant. a PCC values of M. oxydans (Mic) with S. rhizophila (Ste) or X. retroflexus (Xan) in regions where the local presence of Mic was typical or scant in four-species biofilms after 24 h of growth under flow conditions. The mean PCC values (continuous line) and the standard error of the mean (SEM, shaded part) are plotted against distances spaced at intervals of 1 µm. The dashed horizontal line (PCC value of 1) corresponds to random positioning. b Bio-volumes of each species in the 24 h four-species biofilms in regions where the local presence of Mic was typical or scant. Error bars represent standard error of the mean from three biological replicates. *P < 0.05; **P < 0.01; ***P < 0.001 (Two-sample t-test)

References

    1. Hansen SK, Rainey PB, Haagensen JAJ, Molin S. Evolution of species interactions in a biofilm community. Nature. 2007;445:533–6. doi: 10.1038/nature05514. - DOI - PubMed
    1. Liu W, Røder HL, Madsen JS, Bjarnsholt T, Sørensen SJ, Burmølle M. Interspecific bacterial interactions are reflected in multispecies biofilm spatial organization. Front Microbiol. 2016 10.3389/fmicb.2016.01366. - PMC - PubMed
    1. Nadell CD, Drescher K, Foster KR. Spatial structure, cooperation and competition in biofilms. Nat Rev Microbiol. 2016;14:589–600. doi: 10.1038/nrmicro.2016.84. - DOI - PubMed
    1. Estrela S, Brown SP. Metabolic and demographic feedbacks shape the emergent spatial structure and function of microbial communities. PLoS Comput. Biol. 2013 10.1371/journal.pcbi.1003398. - PMC - PubMed
    1. Bao K, Belibasakis GN, Selevsek N, Grossmann J, Bostanci N. Proteomic profiling of host-biofilm interactions in an oral infection model resembling the periodontal pocket. Sci Rep. 2015 doi: 10.1038/srep15999. - DOI - PMC - PubMed

Publication types