. 2018 May;19(5):464-474.
doi: 10.1038/s41590-018-0094-2. Epub 2018 Apr 18.

γδ T cells producing interleukin-17A regulate adipose regulatory T cell homeostasis and thermogenesis

Affiliations

γδ T cells producing interleukin-17A regulate adipose regulatory T cell homeostasis and thermogenesis

Ayano C Kohlgruber et al. Nat Immunol. 2018 May.

Erratum in

Abstract

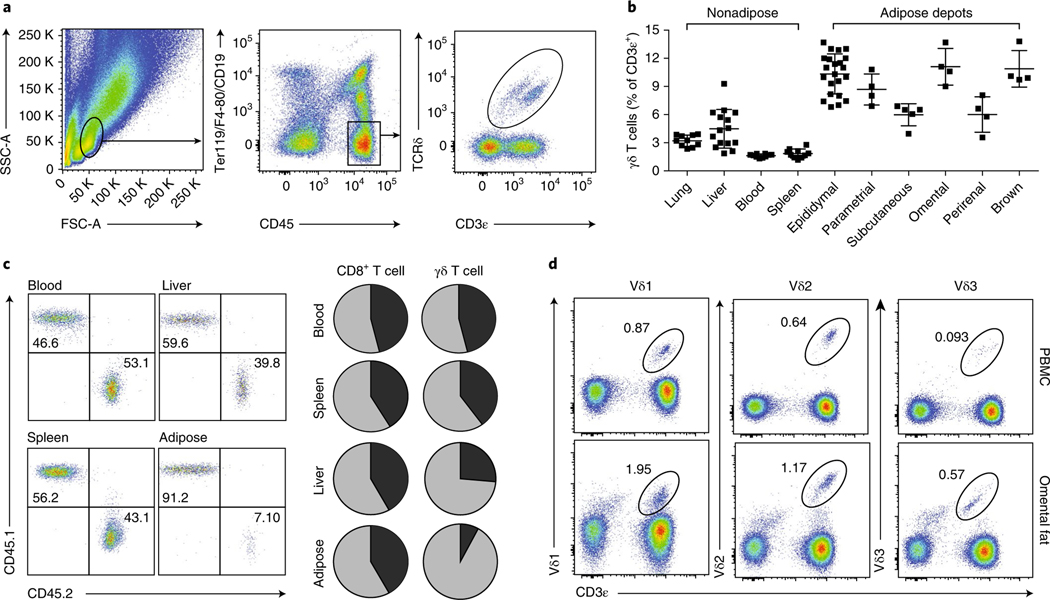
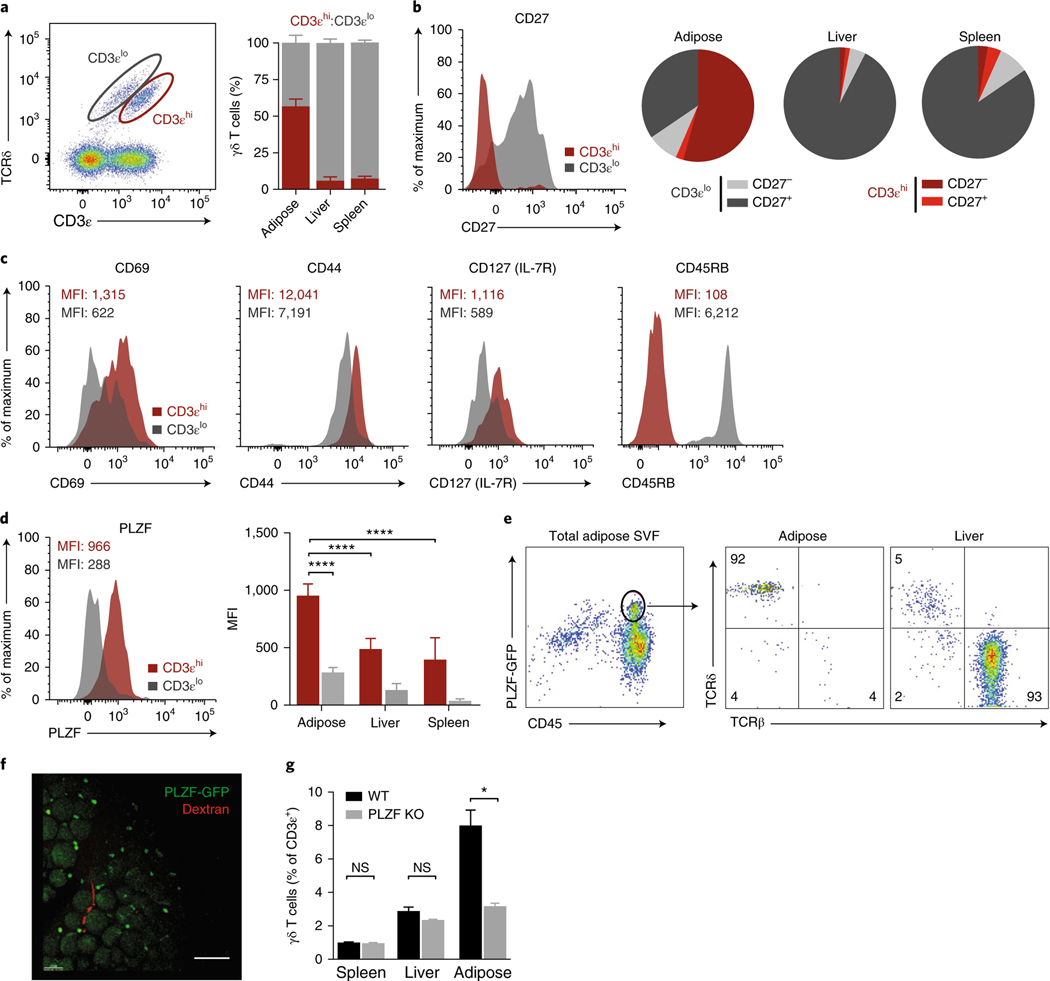
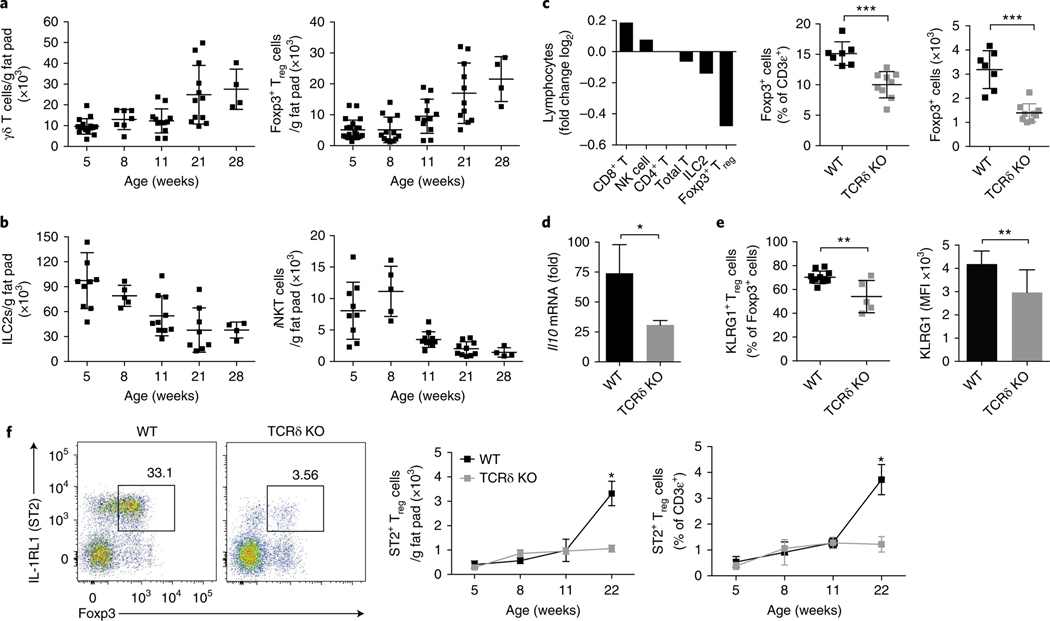
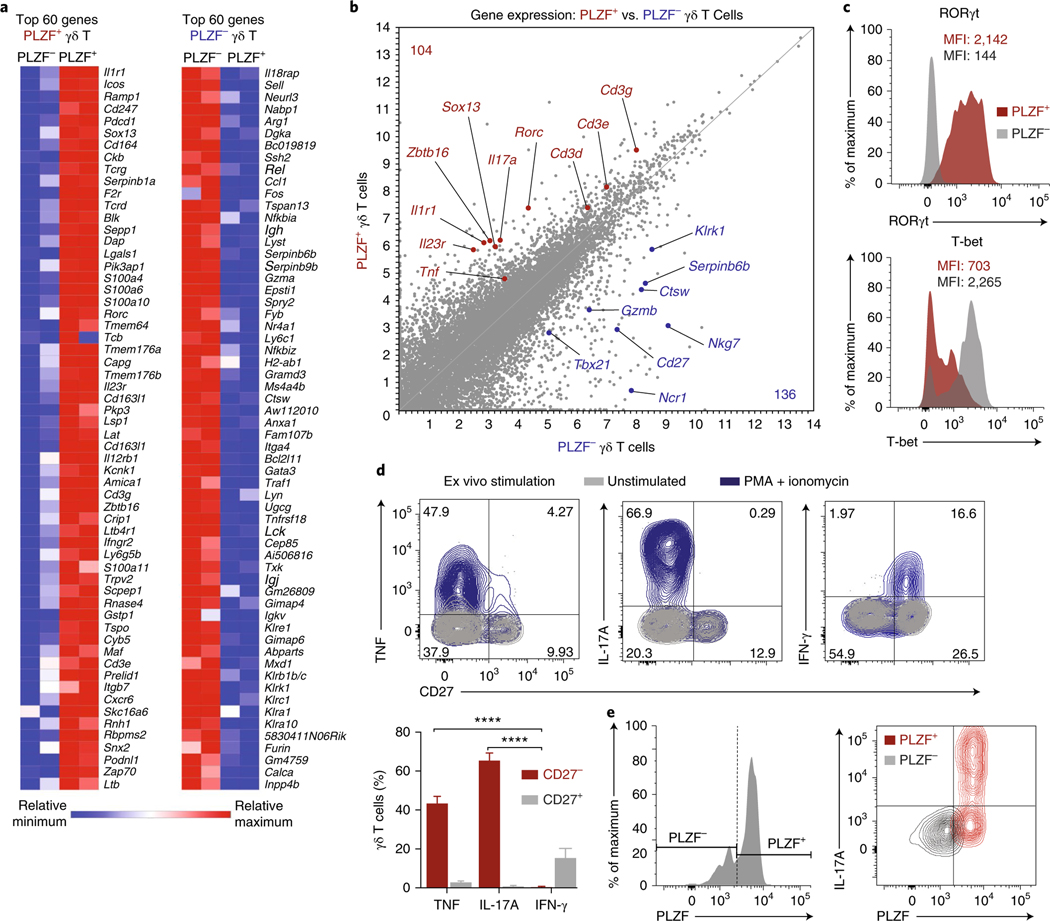
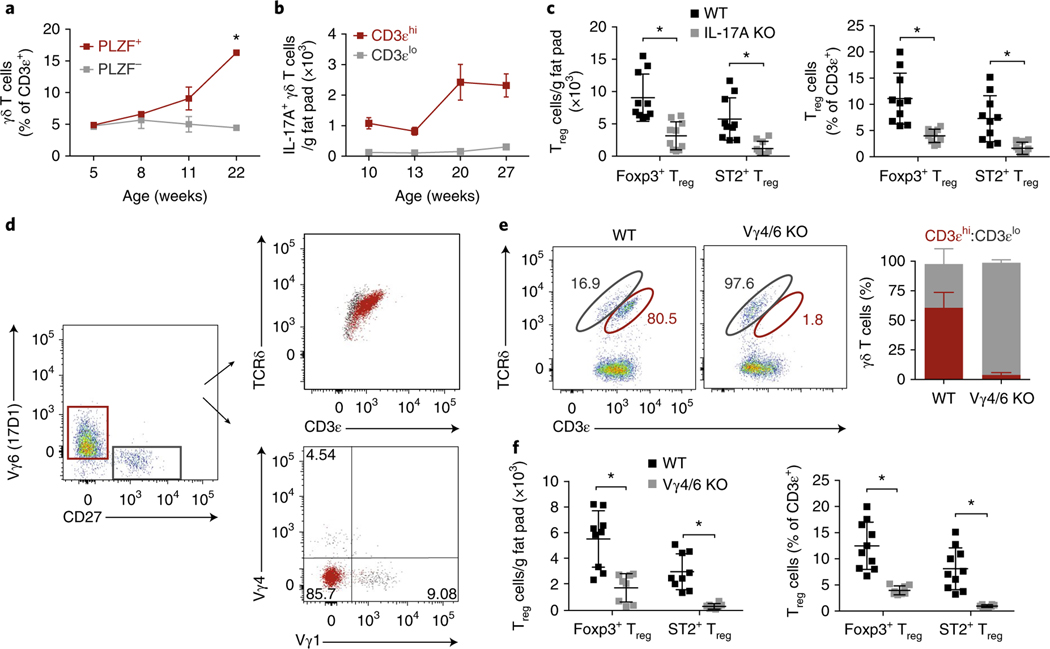
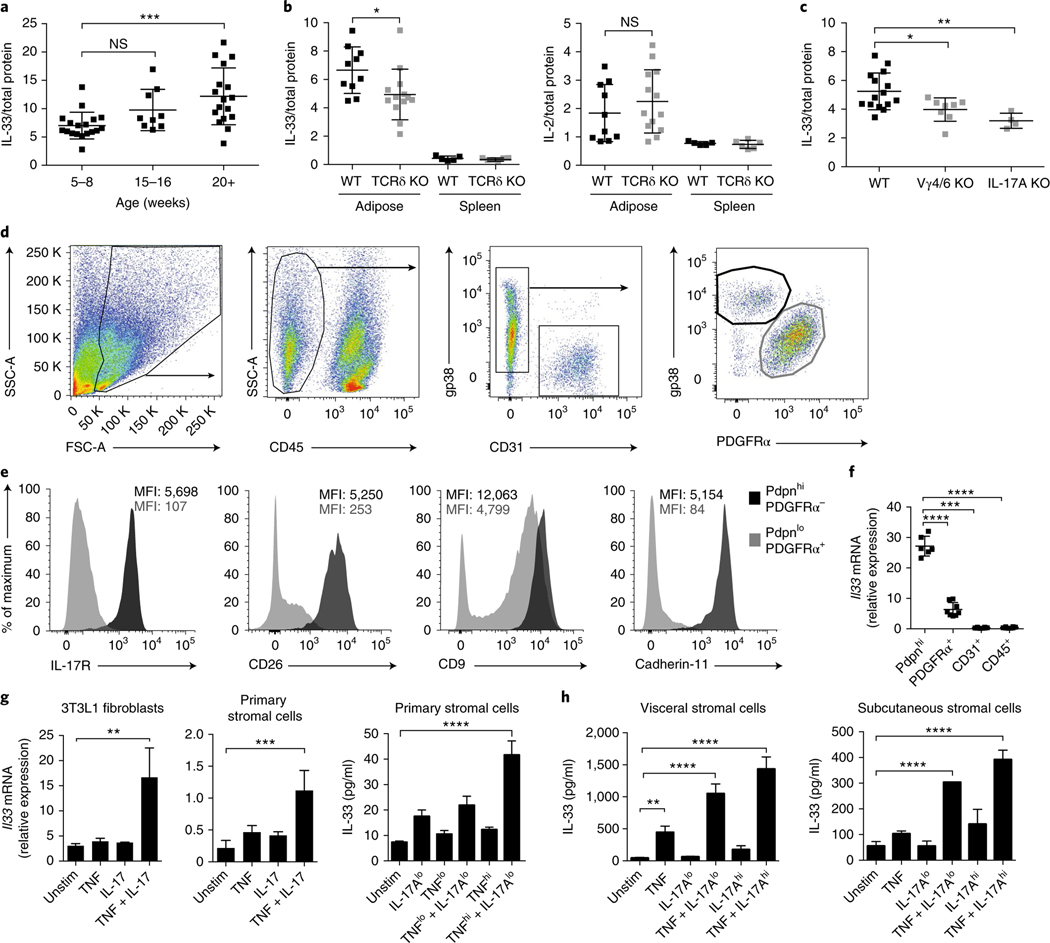
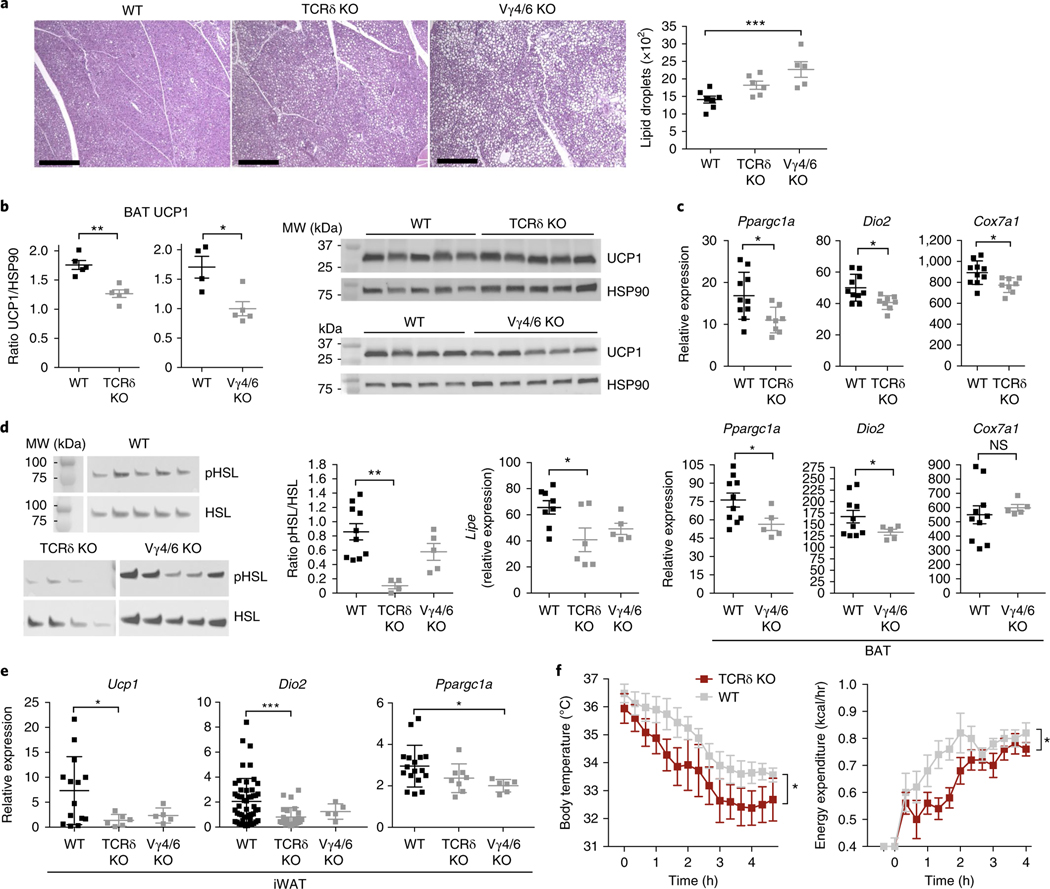
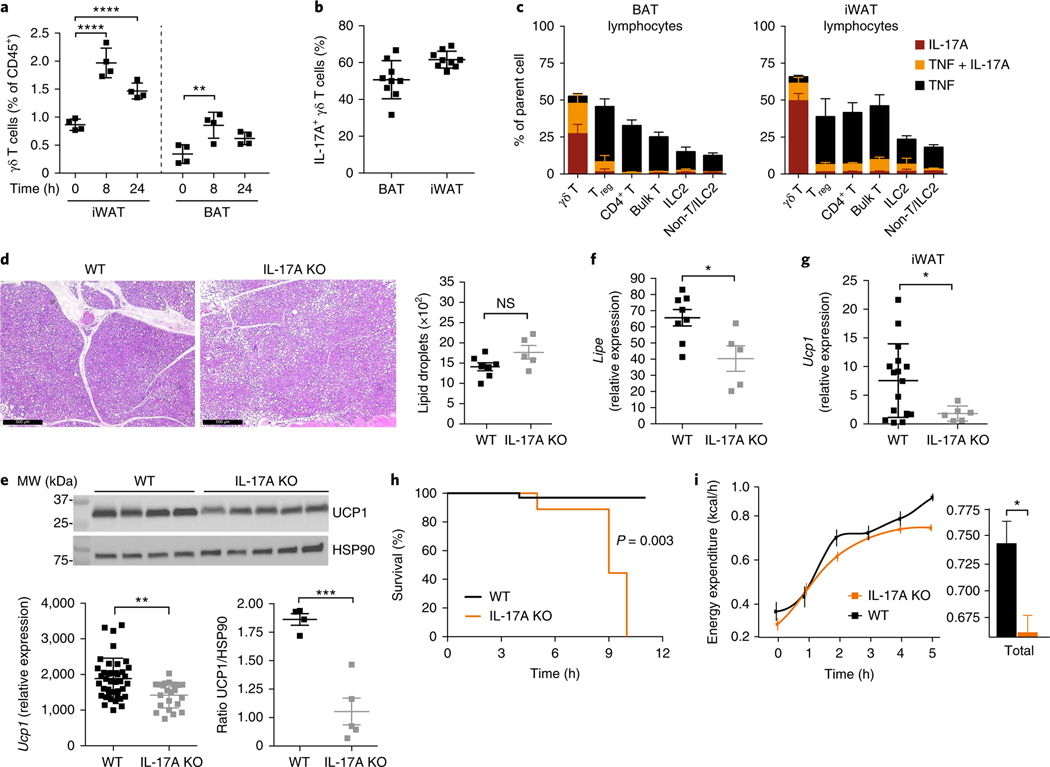
γδ T cells are situated at barrier sites and guard the body from infection and damage. However, little is known about their roles outside of host defense in nonbarrier tissues. Here, we characterize a highly enriched tissue-resident population of γδ T cells in adipose tissue that regulate age-dependent regulatory T cell (Treg) expansion and control core body temperature in response to environmental fluctuations. Mechanistically, innate PLZF+ γδ T cells produced tumor necrosis factor and interleukin (IL) 17 A and determined PDGFRα+ and Pdpn+ stromal-cell production of IL-33 in adipose tissue. Mice lacking γδ T cells or IL-17A exhibited decreases in both ST2+ Treg cells and IL-33 abundance in visceral adipose tissue. Remarkably, these mice also lacked the ability to regulate core body temperature at thermoneutrality and after cold challenge. Together, these findings uncover important physiological roles for resident γδ T cells in adipose tissue immune homeostasis and body-temperature control.


Conflict of interest statement

Competing interests

M.B.B. is a consultant to Roche.

Figures

Fig. 1 |
Fig. 1 |. γδ T cells are enriched and resident in adipose tissue.
a, Representative flow cytometry plots of γδ T cells from the epididymal WAT stromal vascular fraction (eWAT SVF). K denotes thousand. b, Frequency of γδ T cells across various adipose tissue depots as a percentage of CD3ε+ T cells in male eWAT (n ≥ 4 mice per group). Each symbol represents an individual mouse; small horizontal lines indicate the mean. c, Flow cytometry of lymphocytes in the blood, liver, spleen, and adipose tissue of CD45.1+ and CD45.2+ congenic C57BL/6 parabiotic pairs joined at 6 weeks of age and analyzed 2 weeks later (left); and frequency pie charts of CD45.1+ and CD45.2+ CD8+ and γδ T cells (right). d, Frequency of Vδ1+, Vδ2+, and Vδ3+ γδ T cells (% of CD45+PI cells) in peripheral blood (PBMCs) or from matched omental fat from patients before bariatric surgery. Data are representative of three experiments (a,b,d; mean ± s.e.m. in b) or one experiment (c).
Fig. 2 |
Fig. 2 |. PLZF discriminates two γδ T cell populations.
a, Representative flow cytometry and frequency quantification of CD3εhi and CD3εlo γδ T cells from eWAT SVF across adipose, liver, and spleen (n = 5 mice). b, CD27 expression by CD3εhi and CD3εlo γδ T cells (left) and subset quantification from adipose, liver, and spleen (right) (n = 5 mice). c, Representative histograms of mean fluorescence intensity (MFI) of CD69, CD44, CD127, and CD45RB expression by CD3εhi and CD3εlo γδ T cells. d, Representative histogram of PLZF expression by CD3εhi and CD3εlo γδ T cells (left) and MFI quantification across adipose, liver, and spleen (right) (n = 5 mice). e, Representative flow cytometry and quantification of TCRβ+ versus TCRδ+ cells of PLZF+CD45+ cells from eWAT SVF. f, Immunofluorescence microscopy of whole-mount adipose tissue from Zbtb16GFP mice (green) injected with dextran (red). Scale bar, 100 μm. g, Frequency of γδ T cells from wild-type (WT) and Zbtb16−/− mice (n = 5). KO, knockout. NS, not significant (P > 0.05); *P < 0.05; ****P < 0.0001 (one-way ANOVA). Data are representative of three experiments (ae; mean ± s.e.m. in a,d) or two experiments (f,g; mean ± s.e.m. in g).
Fig. 3 |
Fig. 3 |. γδ T cells are important for adipose Treg accumulation.
a,b, Numbers per gram eWAT of γδ T and Foxp3+ Treg cells (a) and ILC2s and iNKT cells (b) at 5, 8, 11, 21, and 28 weeks of age (n ≥ 4 mice per time point). c, Ratio (log2 normalized fold change) of CD8+ T, NK, CD4+ T, ILC2s, and Treg cell numbers from Tcrd−/− mice compared with WT mice (left) at 16 weeks of age (n = 10 mice). Frequency and numbers of Foxp3+ Treg cells in eWAT between WT and Tcrd−/− mice (right) at 16 weeks (n = 4 mice per group). d, Quantitative real-time PCR for Il10 expression normalized to Tbp from sorted CD25+CD4+ Treg cells from WT and Tcrd−/− mice at 16 weeks (n = 5 mice). e, Frequency (left) and MFI (right) of cell-surface KLRG1 expression on eWAT Foxp3+ Treg cells from mice 16 weeks of age (n = 5 mice). f, Representative flow cytometry of ST2+Foxp3+ Treg cells from eWAT (left) and cell numbers from WT and Tcrd−/− littermate (right) mice (n = 5) at 5, 8, 11, and 22 weeks of age. Each symbol represents an individual mouse; small horizontal lines indicate the mean. NS, not significant (P > 0.05); *P < 0.05; **P < 0.01; ***P < 0.001. (Two-tailed Student’s t test in ce; one-way ANOVA in f). Data are representative of three experiments (a,b,f; mean ± s.e.m. in a,b,f) or two experiments (ce; mean ± s.e.m. in ce).
Fig. 4 |
Fig. 4 |. PLZF+ γδ T cells are innate-IL17A− producing cells.
a, Heat map of the top 60 genes differentially expressed (false-discovery-rate-adjusted P value < 0.01) between PLZF+ (left) and PLZF (right) γδ T cells. b, Scatter plot of gene transcripts differentially expressed by PLZF+ and PLZF γδ T cells from 14-week-old male mice. c, Flow cytometry of RORγt (top) and T-bet (bottom) expression in PLZF+ and PLZF γδ T cells from eWAT SVF. d, Representative intracellular cytokine staining (top) and quantification (bottom) on gated γδ T cells from eWAT SVF for TNF, IL-17A, and IFN-γ after 4-h stimulation with PMA and ionomycin (n = 4 mice). e, Representative intracellular IL-17A staining of gated PLZF+ and PLZF γδ T cells from eWAT SVF after 4-h treatment with PMA and ionomycin (n = 5 mice). Small horizontal lines indicate the mean. NS, not significant (P > 0.05); *P < 0.05; **P < 0.01; ****P < 0.0001 (one-way ANOVA in d). Data are representative of two experiments (ce; mean ± s.e.m. in d).
Fig. 5 |
Fig. 5 |. ST2+ Treg numbers depend on PLZF+ γδ T cells and IL-17A.
a, Frequency of PLZF+ and PLZF γδ T cells from eWAT at 5, 8, 11, and 22 weeks of age (n = 5 mice per time point). b, Numbers of GFP+ CD3εhi and CD3εlo γδ T cells from eWAT of Il17aGFP male mice at 10, 13, 20, and 27 weeks of age (n = 5 mice per time point). c, Numbers and frequency of ST2+ and total Treg cells from eWAT of 16-week-old males from WT and Il17a−/− mice (n = 5 mice, pooled). d, Representative flow cytometry of γδ T cells stained with anti-CD27, 17D1, anti-Vγ1, and anti-Vγ4 to characterize TCR usage. e, Representative flow cytometry plots of γδ T cells from WT and Vg4/6−/− eWAT (left) and quantification of CD3εhi and CD3εlo γδ frequencies (right) (n = 5 mice). f, Numbers and frequency of ST2+ and total Treg cells from eWAT of 16-week-old WT and Vg4/6−/− male mice (n ≥ 4). Each symbol represents an individual mouse; small horizontal lines indicate the mean. NS, not significant (P > 0.05); *P < 0.05 (one-way ANOVA in a,c,f). Data are pooled across two experiments (mean ± s.e.m. in ac,f) or representative of two experiments (d,e; mean ± s.e.m. in e).
Fig. 6 |
Fig. 6 |. TNF and IL-17A induce IL-33 in adipose stromal cells.
a, IL-33 protein from SVF eWAT lysates of WT male mice 5–8, 15–16, and 20+ weeks of age, determined by enzyme-linked immunosorbent assay (ELISA; n = 4 mice per time point) and normalized to total SVF protein. b, IL-33 (left) and IL-2 (right) protein from SVF eWAT and splenic lysates of 14-week-old WT and Tcrd−/− male mice (n ≥ 3, pooled). c, IL-33 protein from SVF eWAT lysates of 16-week-old WT, Vg4/6−/−, and Il17a−/− male mice (n ≥ 4), normalized to total SVF protein. d, Representative flow cytometry plots for stromal cell subsets in the eWAT SVF in male WT mice. e, Cell-surface IL-17R, CD26, CD9, and Cdh11 MFI of CD45PdpnhiPDGFRα and CD45PdpnloPDGFRα+ stromal cells. f, Quantitative real-time PCR for Il33 mRNA normalized to Tbp mRNA from sorted Pdpnhi, PDGFRα+, CD31+, and CD45+ cells from WT mice (n = 6). g, 3T3L1 or primary adipose stromal cells derived from eWAT SVF were unstimulated (unstim) or stimulated with TNFlo (0.1 ng/mL), TNF (1 ng/mL), IL-17Alo (0.1 ng/mL), IL-17A (1 ng/mL), or TNF (1 ng/mL) + IL-17A (1 ng/mL) for 18 h. Il33 transcript levels were measured with quantitative real-time PCR (left), and protein levels were measured with ELISA (right). h, Primary human stromal cells derived from visceral (Lonza) and subcutaneous (ATCC) adipose tissues were unstimulated (unstim) or stimulated with TNFlo (0.1 ng/mL), TNF (1 ng/mL), IL-17Alo (0.1 ng/mL), IL-17A (1 ng/mL), or TNF (1 ng/mL) + IL-17A (1 ng/mL) for 18 h. Cell lysates were collected, and IL-33 protein was measured with ELISA. In plots, each symbol represents an individual mouse; small horizontal lines indicate the mean. NS, not significant (P > 0.05); *P < 0.05; **P < 0.01; ***P < 0.001; ****P < 0.0001 (one-way ANOVA in ac,fh). Data are pooled across three experiments (ac; mean ± s.e.m.) or representative of two experiments (dh; mean ± s.e.m. in fh).
Fig. 7 |
Fig. 7 |. γδ T cells are important for adaptive thermogenesis after cold.
a, Representative histology of hematoxylin- and eosin-stained BAT and lipid-droplet quantification from WT, Tcrd−/−, and Vg4/6−/− mice after 6 h at 4 °C. Scale bars, 500 μm. b, Immunoblot analysis and densitometry quantification of UCP1 and HSP90 loading control in BAT of WT, Tcrd−/−, and Vg4/6−/− mice after 6 h at 4 °C (n = 5 mice). MW, molecular weight. c, Quantitative real-time PCR of thermogenesis genes from WT and Tcrd−/− BAT (top), and WT and Vg4/6−/− BAT (bottom) after 6 h at 4 °C (n ≥ 5 mice). d, Immunoblot analysis of phospo-HSL (pHSL) and HSL and quantitative real-time PCR of Lipe (also known as Hsl) from iWAT of WT, Tcrd−/−, and Vg4/6−/− mice after 6 h at 4 °C (n ≥ 5 mice). e, Quantitative real-time PCR of thermogenesis genes from WT, Tcrd−/−, and Vg4/6−/− iWAT after 6 h at 4 °C (n ≥ 5 mice). f, Body temperature (left) and energy expenditure (right) in WT and Tcrd−/− male mice from 30 °C to 4 °C (n = 5 per group). Each symbol represents an individual mouse; small horizontal lines indicate the mean. Gene expression normalized to Tbp. Immunoblots have been cropped to show relevant proteins. NS, not significant (P > 0.05); *P < 0.05; **P < 0.01; ***P < 0.001 (metabolic variable adjusted for differences in body composition by analysis of covariance (ANCOVA) in g; one-way ANOVA in a,e,f; two-tailed Student’s t test in b,c). Data are representative of two experiments (af; mean ± s.e.m. in ag).
Fig. 8 |
Fig. 8 |. IL-17A promotes thermogenic responses in brown and inguinal adipose tissue.
a, Frequency of γδ T cells of CD45+ cells in BAT and iWAT 0, 8, and 24 h at 4 °C (n = 4 mice). b, Frequency of IL-17A-producing γδ T cells from BAT and iWAT after 5-h stimulation with PMA and ionomycin (n = 10 mice). c, Frequency of immune cells from BAT and iWAT that produce TNF, IL-17A, or TNF + IL-17A after 4-h stimulation with PMA and ionomycin at 4 °C (n = 5 mice). d, Representative histology of hematoxylin- and eosin-stained BAT and lipid-droplet quantification from WT and Il17a−/− mice after 6 h at 4 °C. Scale bars, 500 μm. e, Quantitative real-time PCR of Ucp1 (left) and immunoblot analysis of UCP1 and HSP90 loading control (right) in BAT tissue obtained from WT and Il17a−/− mice (n ≥ 5) after 6 h at 4 °C. f, Quantitative real-time PCR of Lipe (also known as Hsl) from WT and Il17a−/− iWAT after 6 h at 4 °C (n ≥ 5 mice). g, Quantitative real-time PCR of Ucp1 from WT and Il17a−/− iWAT after 6 h at 4 °C (n ≥ 5 mice). h, WT and Il17a−/− mice were gradually shifted from 30 °C to 4 °C at a continuous rate and monitored for survival. Mice (n = 5) were rescued when body temperature dropped to <28 °C. i, Energy expenditure measured between WT and Il17a−/− male mice (n = 5). Each symbol represents an individual mouse; small horizontal lines indicate the mean. Gene expression was normalized to that of Tbp. Immunoblots have been cropped to show relevant proteins. NS, not significant (P > 0.05); *P < 0.05; **P < 0.01; ***P < 0.001; ****P < 0.0001 (metabolic variable adjusted for differences in body composition by ANCOVA in h,i; one-way ANOVA in a; Two-tailed Student’s t test in dg; log-rank Mantel–Cox test in h). Data are representative of two experiments (ag; mean ± s.e.m. in ag).

Comment in

  • Got my γδ17 T cells to keep me warm.
    Papotto PH, Silva-Santos B. Papotto PH, et al. Nat Immunol. 2018 May;19(5):427-429. doi: 10.1038/s41590-018-0090-6. Nat Immunol. 2018. PMID: 29670236 No abstract available.
  • γδ T cells turn up the heat.
    Otto G. Otto G. Nat Rev Immunol. 2018 Jun;18(6):359. doi: 10.1038/s41577-018-0017-3. Nat Rev Immunol. 2018. PMID: 29725118 No abstract available.

References

    1. Brestoff JR & Artis D. Immune regulation of metabolic homeostasis in health and disease. Cell 161, 146–160 (2015). - PMC - PubMed
    1. Kohlgruber A. & Lynch L. Adipose tissue inflammation in the pathogenesis of type 2 diabetes. Curr. Diab. Rep 15, 92 (2015). - PubMed
    1. Lynch L. et al. Regulatory iNKT cells lack expression of the transcription factor PLZF and control the homeostasis of Treg cells and macrophages in adipose tissue. Nat. Immunol 16, 85–95 (2015). - PMC - PubMed
    1. Lynch L. et al. Adipose tissue invariant NKT cells protect against diet-induced obesity and metabolic disorder through regulatory cytokine production. Immunity 37, 574–587 (2012). - PMC - PubMed
    1. Molofsky AB et al. Innate lymphoid type 2 cells sustain visceral adipose tissue eosinophils and alternatively activated macrophages. J. Exp. Med 210, 535–549 (2013). - PMC - PubMed

Publication types

Substances