. 2018 Apr 18;8(1):6153.
doi: 10.1038/s41598-018-23844-y.

A combination of Lactobacillus mali APS1 and dieting improved the efficacy of obesity treatment via manipulating gut microbiome in mice

Affiliations

A combination of Lactobacillus mali APS1 and dieting improved the efficacy of obesity treatment via manipulating gut microbiome in mice

Yung-Tsung Chen et al. Sci Rep. .

Abstract

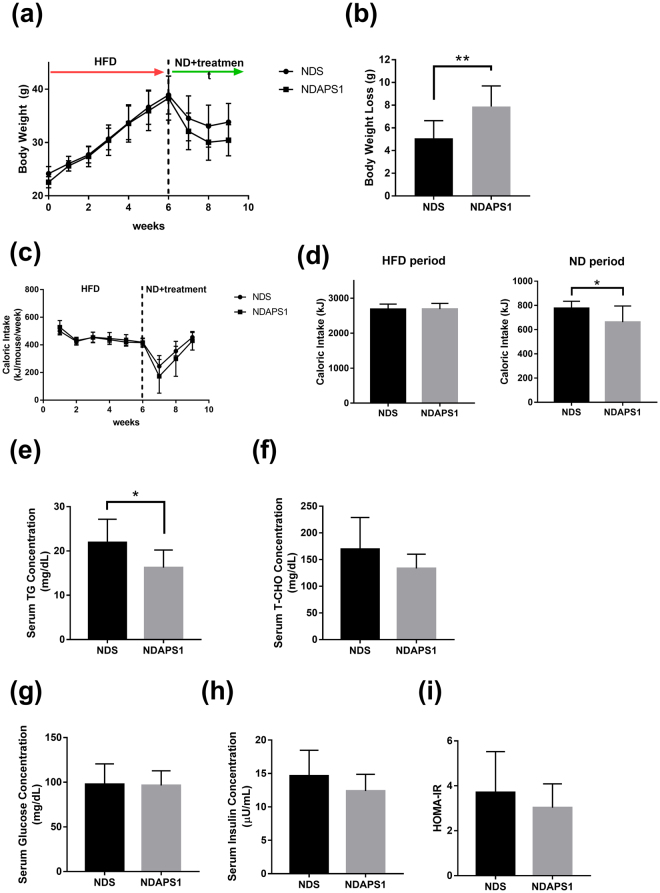
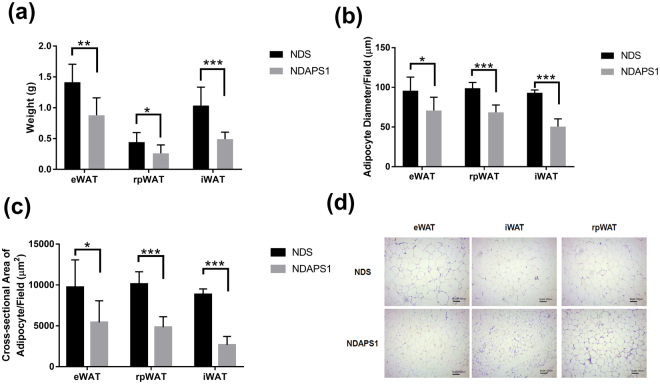
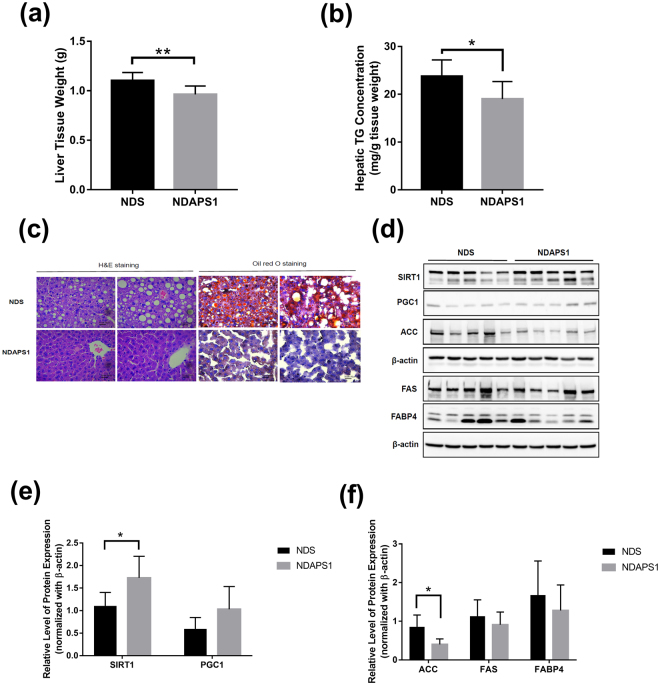
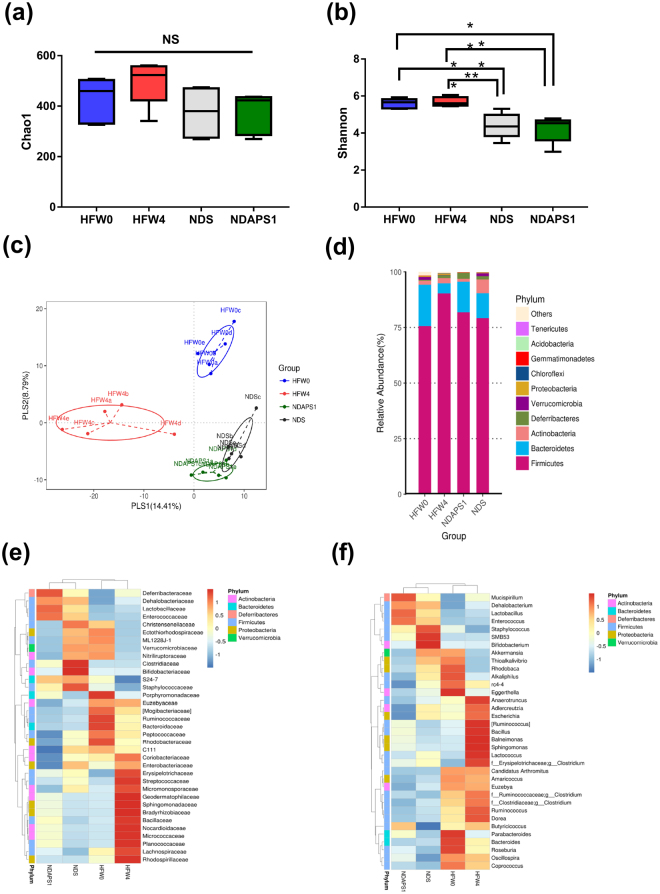
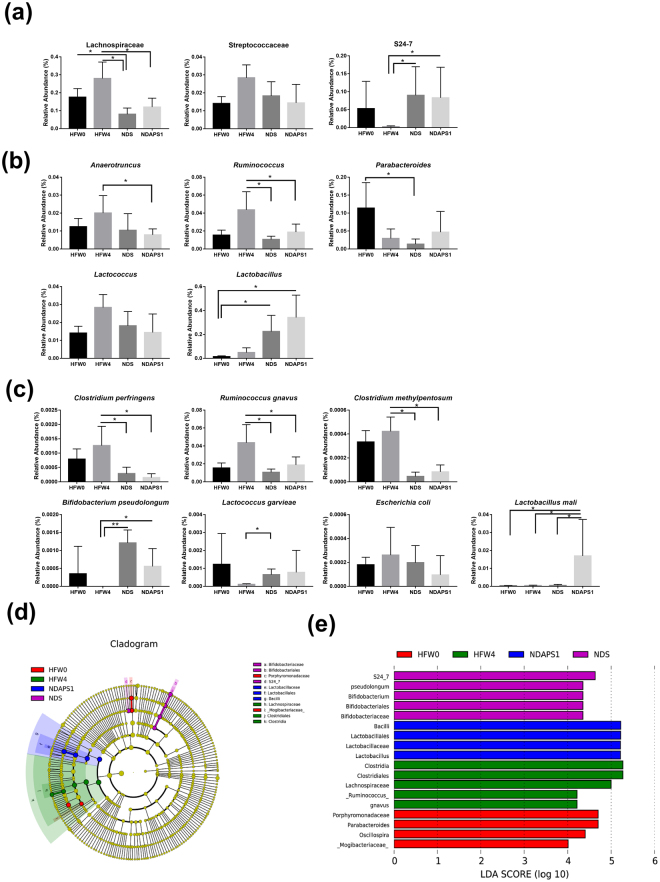
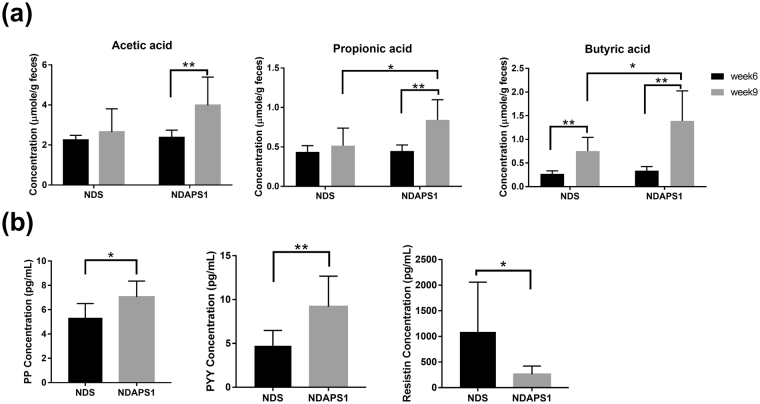
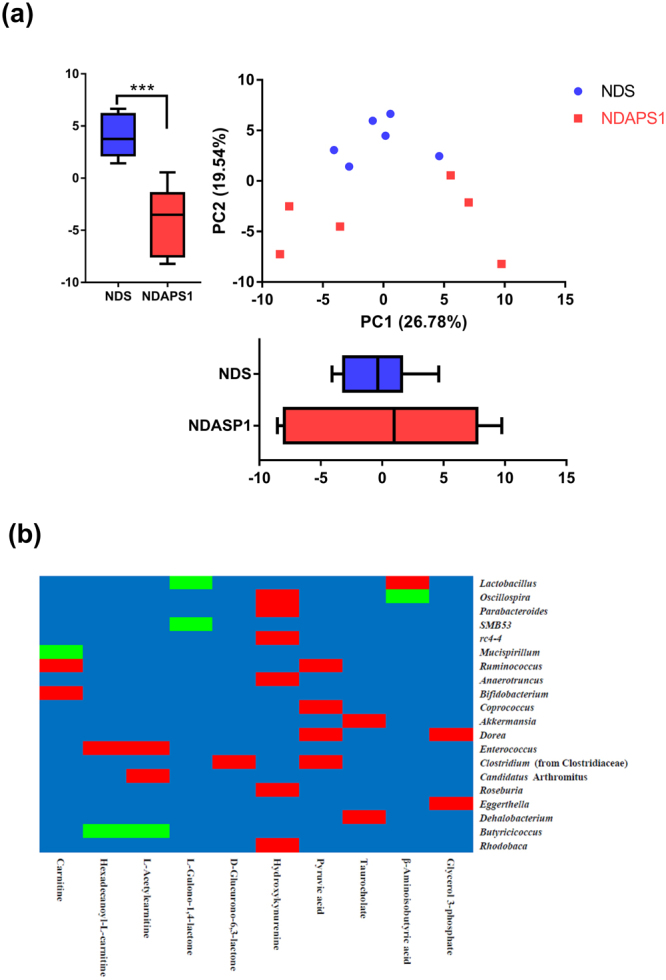
The difficulty of long-term management has produced a high rate of failure for obesity patients. Therefore, improving the efficacy of current obesity treatment is a significant goal. We hypothesized that combining a probiotic Lactobacillus mali APS1 intervention with dieting could improve the efficacy of obesity and hepatic steatosis treatment compared to dieting alone. Mice were fed a high-fat diet for 6 weeks and then treated with: saline + normal diet and APS1 + normal diet (NDAPS1) for 3 weeks. NDAPS1 accelerated body weight loss and reduced caloric intake and fat accumulation. The fecal microbiome showed that accelerating weight loss by NDAPS1 resulted in restoring intestinal microbiota toward a pre-obese state, with alteration of specific changes in the obesity-associated bacteria. APS1 manipulated the gut microbiome's obesity-associated metabolites, followed by regulation of lipid metabolism, enhancement of energy expenditure and inhibition of appetite. The specific hepatic metabolites induced by the APS1-manipulated gut microbiome also contributed to the amelioration of hepatic steatosis. Our results highlighted a possible microbiome and metabolome that contributed to accelerating weight loss following treatment with a combination of APS1 and dieting and suggested that probiotics could serve as a potential therapy for modulating physiological function and downstream of the microbiota.


Conflict of interest statement

The authors declare no competing interests.

Figures

Figure 1
Figure 1
NDAPS1 accelerated body weight loss compared to NDS in preexisting obese mice after dieting. Effect of NDAPS1 on (a) body weight, (b) body weight loss, (c,d) caloric intake, (e) serum triglyceride, (f) total cholesterol, (g) glucose, (h) insulin levels and (i) HOMA-IR in preexisting obese mice are shown. n = 8 per group. The data are expressed as the mean ± SD. Statistical analysis was conducted by using unpaired two-tailed student’s t-test. *P < 0.05, **P < 0.01, ***P < 0.001.
Figure 2
Figure 2
NDAPS1 reduced fat accumulation in preexisting obese mice after dieting. NDAPS1 reduced (a) WAT weight, (b) diameter and (c) cross-sectional area of adipocytes. (d) Representative histological sections of WAT from mice treated with NDS and NDAPS1 were stained with H&E staining. Scale bar indicates 100 μm. n = 8 per group. The data are expressed as the mean ± SD. Statistical analysis was conducted by using unpaired two-tailed student’s t-test. *P < 0.05, **P < 0.01, ***P < 0.001.
Figure 3
Figure 3
NDAPS1 reduced hepatic steatosis in preexisting obese mice after dieting. (a) NDAPS1 reduced liver weight. (b) NDAPS1 reduced hepatic TG levels. (c) Representative histological sections of liver tissues from mice treated with NDS and NDAPS1 were stained with H&E and Oil Red O staining. Scale bar indicates 25 μm. (d) Representative Western blot analysis for expression of SIRT1, PGC1, ACC, FAS, FABP4 and β-actin proteins in liver tissues of NDS and NDAPS1-treated mice. The cropped blots are displayed in the figure, the cropping line is delineated with the black frame line. Un-cropped full length blots are presented in Supplementary Figure S4. (e,f) Quantitative Western blot analysis by ImageJ software. n = 8 per group. The data are expressed as the mean ± SD. Statistical analysis was conducted by using unpaired two-tailed student’s t-test. *P < 0.05, **P < 0.01.
Figure 4
Figure 4
NDAPS1 manipulated gut microbiota in preexisting obese mice after dieting. (a) The chao1 richness estimator, (b) Shannon’s diversity index and (c) PLS-DA plots represented changes between samples collected from HFW0, HFW4, NDS and NDAPS1. NDAPS1 manipulated the abundance of the gut microbiota at the (d) phylum, (e) family and (f) genus levels. n = 5 per group. The nonparametric Wilcoxon signed rank test for paired data and Mann-Whitney U test for unpaired data (NDS vs. NDAPS1) were used. *P < 0.05, **P < 0.01, ***P < 0.001. NS: not significant.
Figure 5
Figure 5
NDAPS1 manipulated gut microbiota in preexisting obese mice after dieting. NDAPS1 manipulated the abundance of specific bacteria at the (a) family, (b) genus and (c) species level. (d,e) LEfSe comparison of gut microbiota between HFW0, HFW4, NDS and NDAPS1 groups. n = 5 per group. The data are expressed as the mean ± SD. The nonparametric Wilcoxon signed rank test for paired data and Mann-Whitney U test for unpaired data (NDS vs. NDAPS1) were used. *P < 0.05, **P < 0.01, ***P < 0.001.
Figure 6
Figure 6
NDAPS1 increased fecal SCFA extraction and serum satiety hormone production in preexisting obese mice after dieting. (a) NDAPS1 increased SCFA extraction in feces of test mice at 6 weeks and 9 weeks. (b) NDAPS1 regulated satiety hormone production in the serum of test mice n = 8 per group. The data are expressed as the mean ± SD. Statistical analysis was conducted by using paired (week 6 vs. week 9) and unpaired (NDS vs. NDAPS1) two-tailed student’s t-test. *P < 0.05, **P < 0.01, ***P < 0.001.
Figure 7
Figure 7
Two-dimensional PCA of metabolomics profile and Pearson’s correlation tests between predominant genera-level microbiota and metabolites. (a) PCA was based on PC1 and PC2 from mean intensity values of total detected metabolites in serum samples obtained from the NDS (solid blue circle) and NDAPS1 (solid orange square) groups. n = 6 per group. The data are expressed as the mean ± SD. Statistical analysis was conducted by using unpaired two-tailed student’s t-test. ***P < 0.001. (b) The relative abundance of bacterial taxa was significantly correlated with specific metabolites. Each cell was colored corresponding to Pearson’s correlation results. The significant positive correlation (P < 0.05) is represented as a red cell, and the significant negative correlation (P < 0.05) is represented as a green cell. The blue cells indicate the correlations were not significant (P > 0.05).

References

    1. Stevens J, Oakkar EE, Cui Z, Cai J, Truesdale KP. US adults recommended for weight reduction by 1998 and 2013 obesity guidelines, NHANES 2007-2012. Obesity. 2015;23:527–531. doi: 10.1002/oby.20985. - DOI - PubMed
    1. Hruby A, Hu FB. The epidemiology of obesity: A big picture. PharmacoEconomics. 2015;33:673–689. doi: 10.1007/s40273-014-0243-x. - DOI - PMC - PubMed
    1. Lombardo GE, et al. Normocaloric diet restores weight gain and insulin sensitivity in obese mice. Front. Endocrinol. 2016;7:49. doi: 10.3389/fendo.2016.00049. - DOI - PMC - PubMed
    1. Brestoff JR, et al. Manganese [III] tetrakis [5,10,15,20]-benzoic acid porphyrin reduces adiposity and improves insulin action in mice with pre-existing obesity. PLOS ONE. 2015;10:e0137388. doi: 10.1371/journal.pone.0137388. - DOI - PMC - PubMed
    1. He X, Ji G, Jia W, Li H. Gut microbiota and nonalcoholic fatty liver disease: Insights on mechanism and application of metabolomics. Int. J. Mol. Sci. 2016;17:300. doi: 10.3390/ijms17030300. - DOI - PMC - PubMed

Publication types