. 2018 Apr;556(7702):515-519.
doi: 10.1038/s41586-018-0039-9. Epub 2018 Apr 18.

Mechanism of NMDA receptor channel block by MK-801 and memantine

Affiliations

Mechanism of NMDA receptor channel block by MK-801 and memantine

Xianqiang Song et al. Nature. 2018 Apr.

Abstract

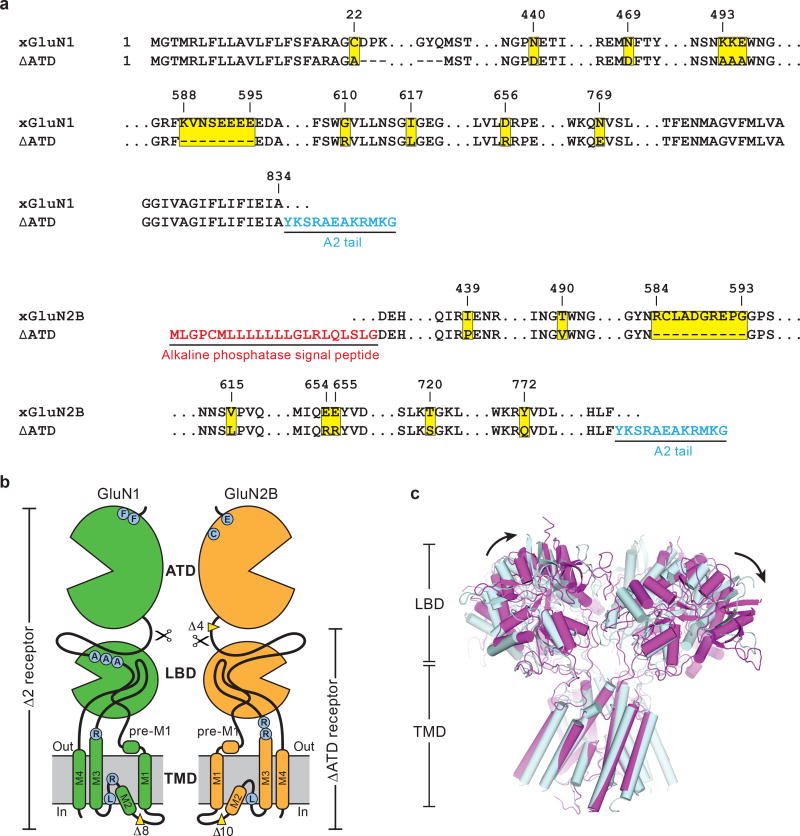
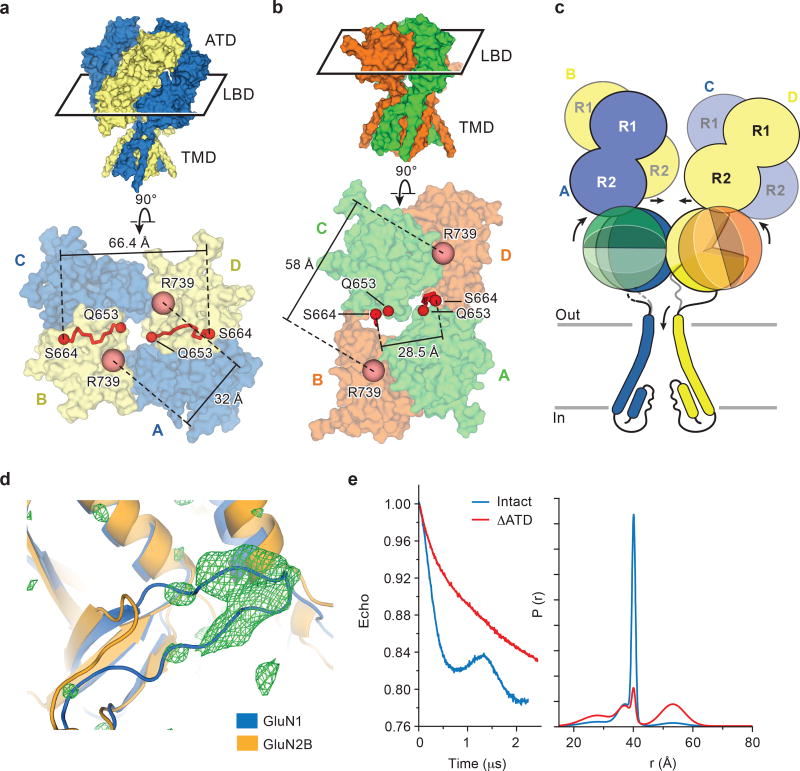
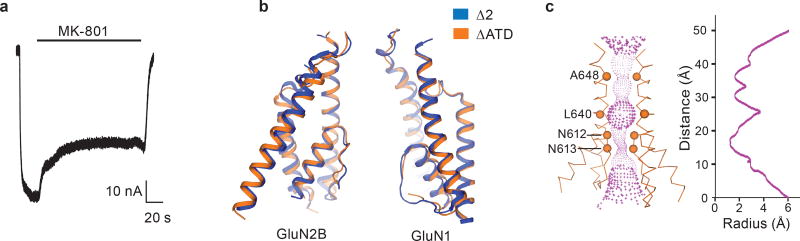
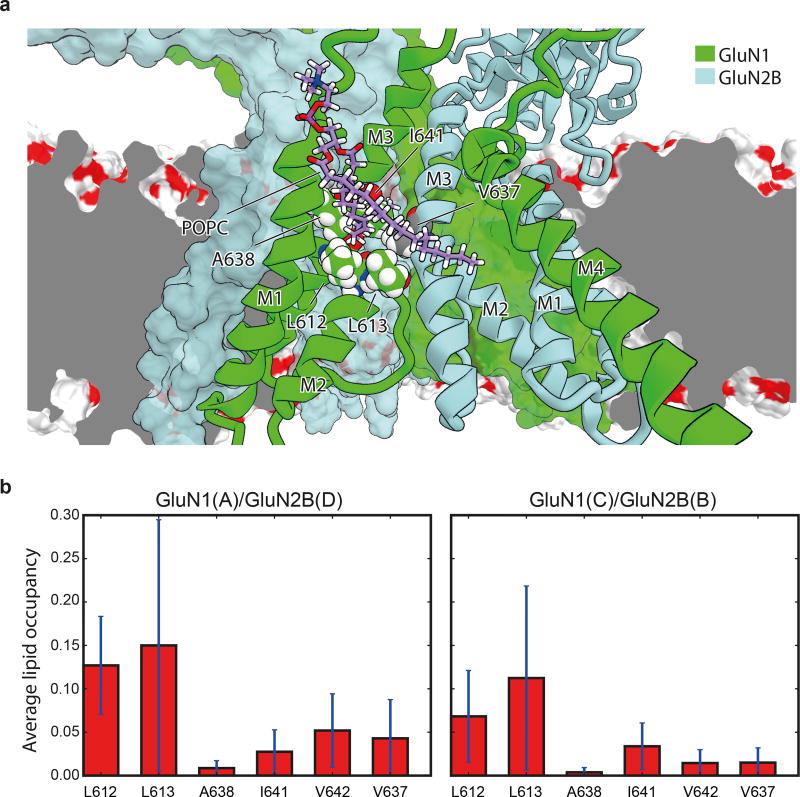
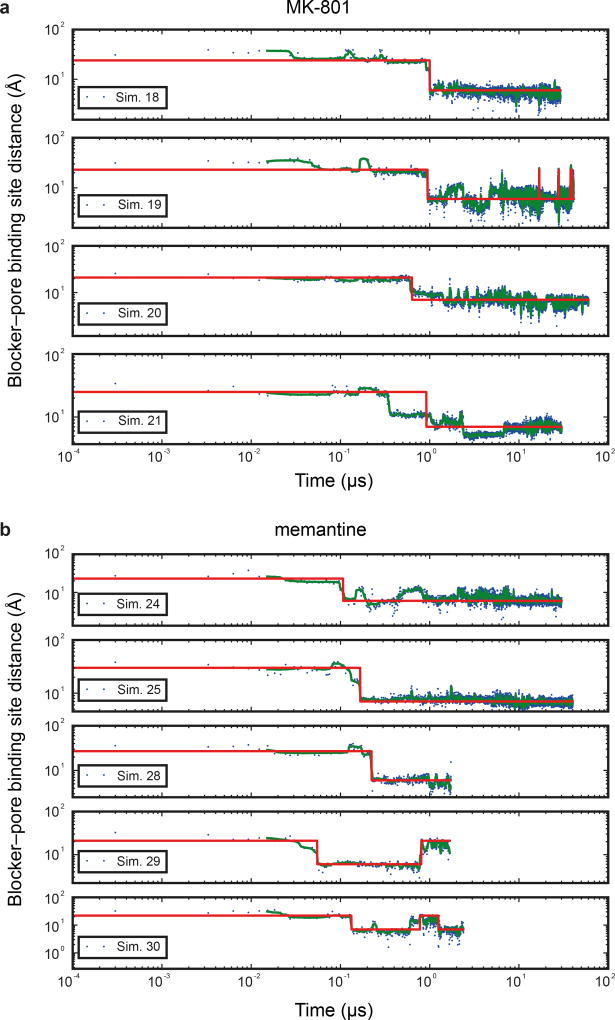
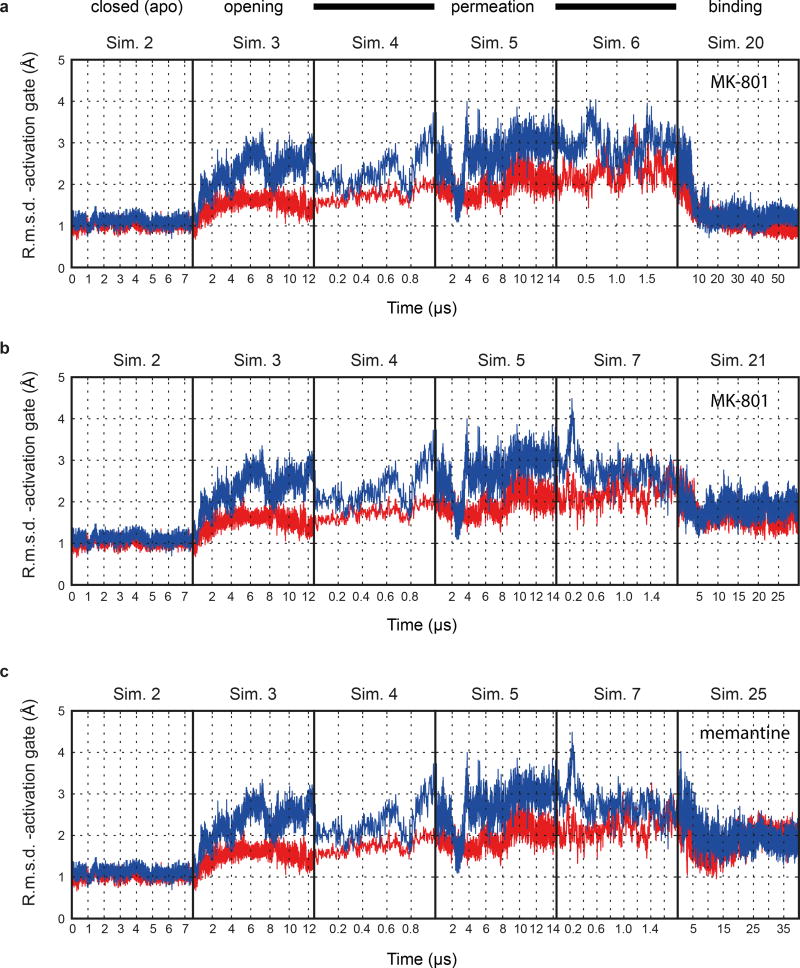
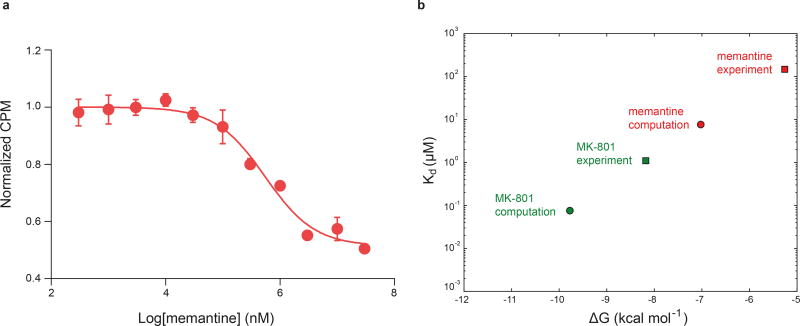
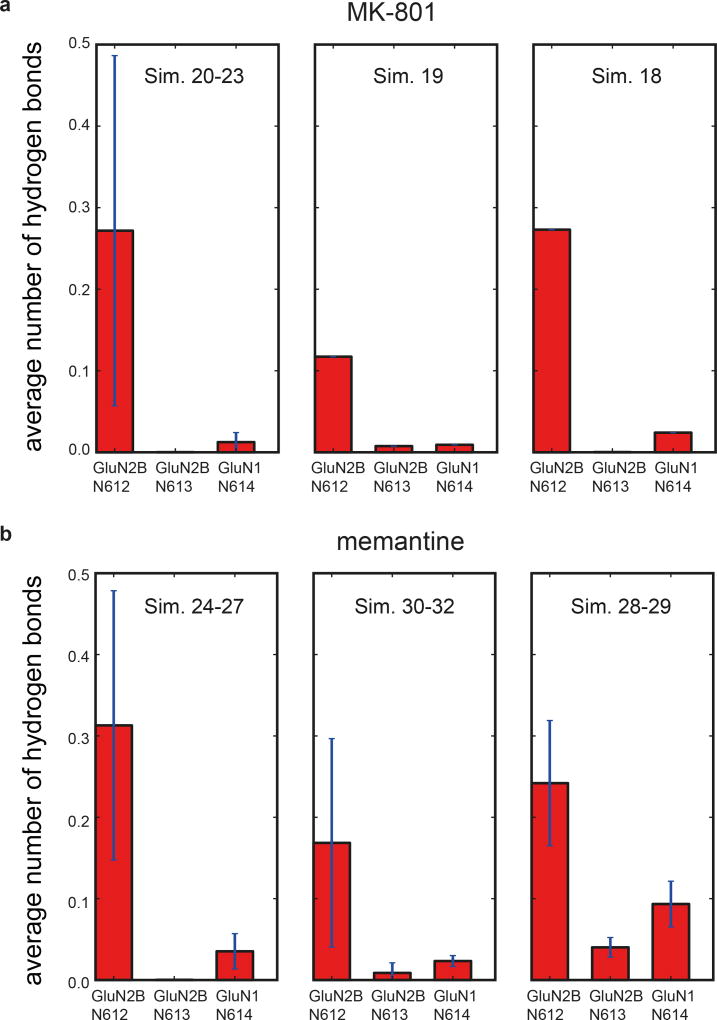
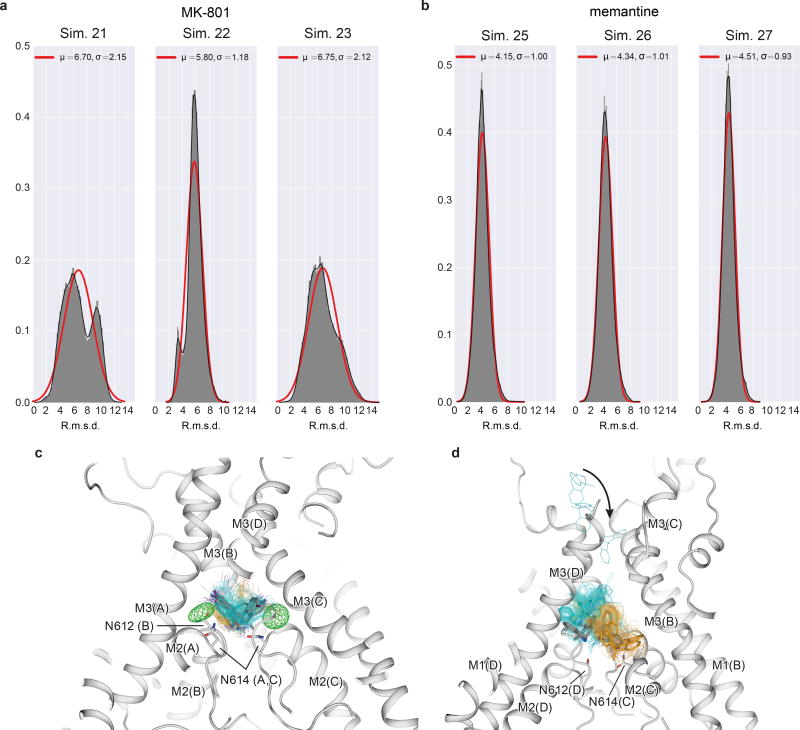
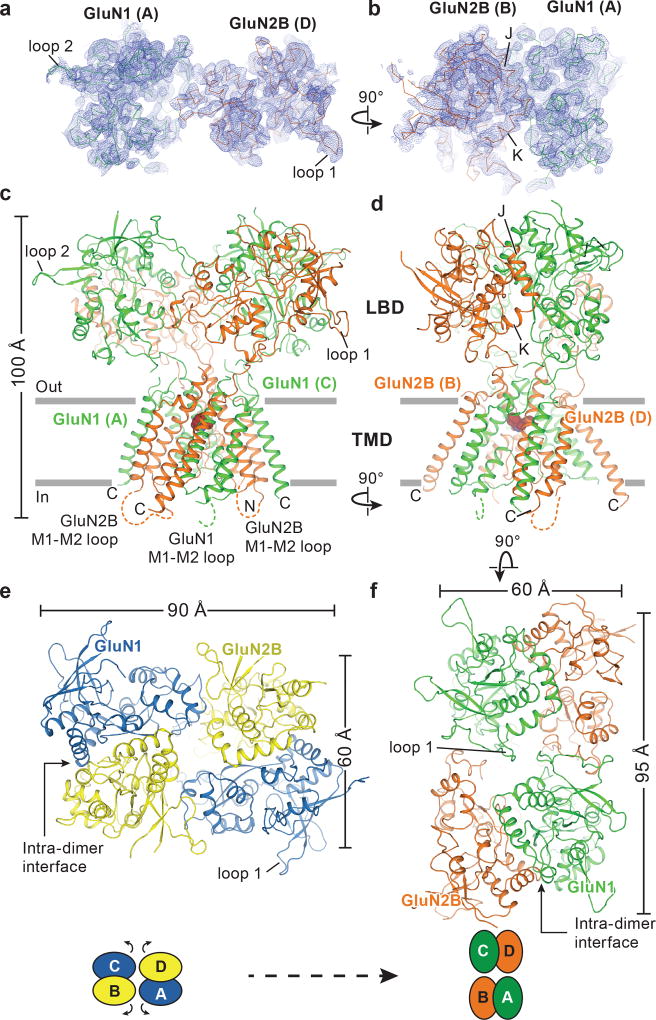
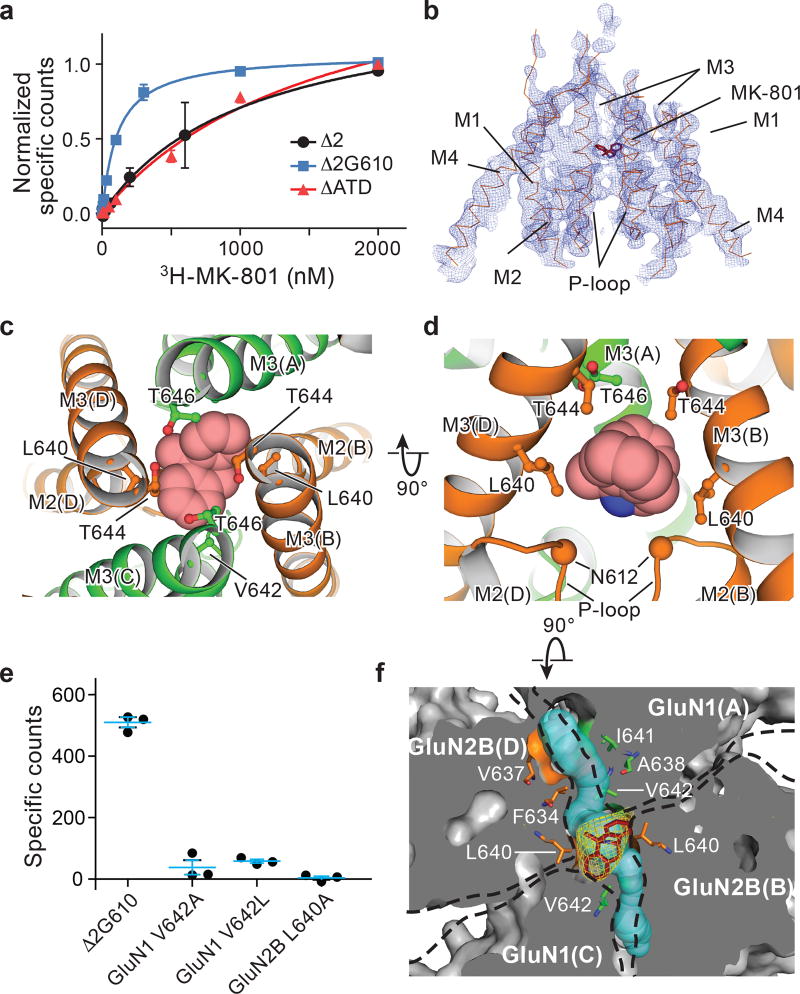
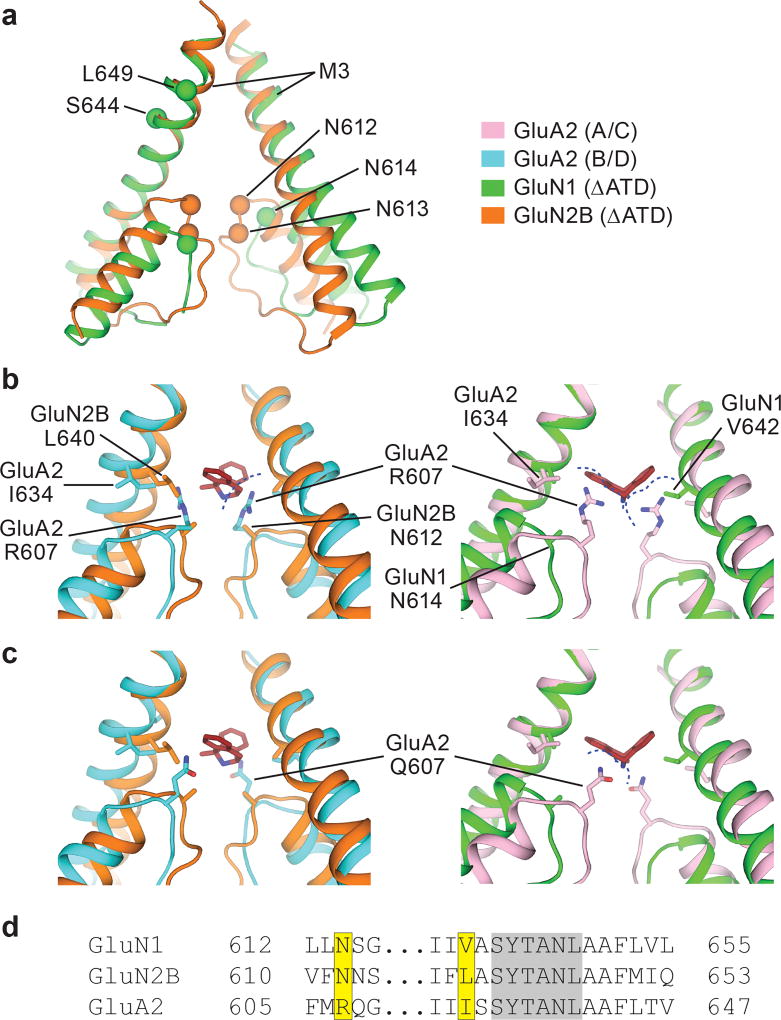
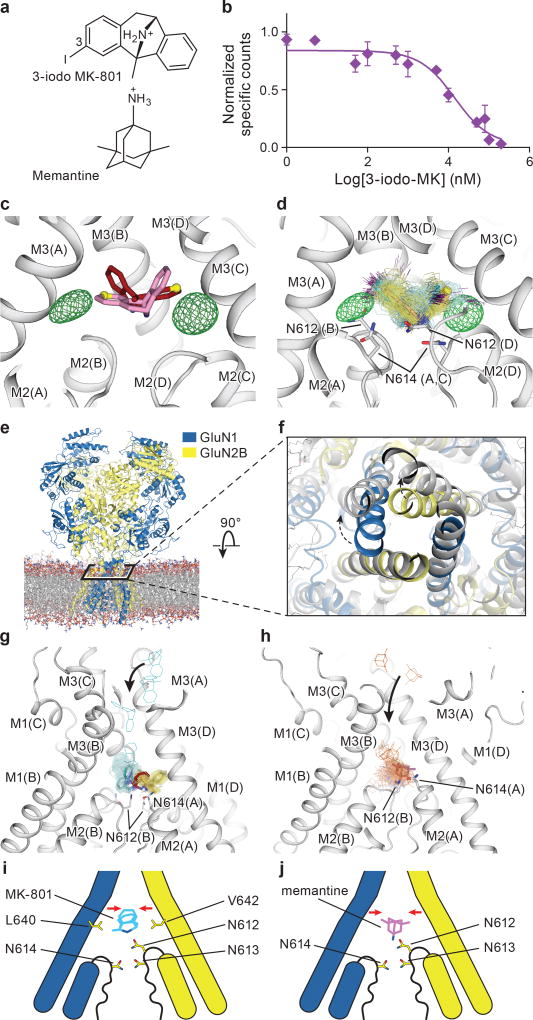
The NMDA (N-methyl-D-aspartate) receptor transduces the binding of glutamate and glycine, coupling it to the opening of a calcium-permeable ion channel 1 . Owing to the lack of high-resolution structural studies of the NMDA receptor, the mechanism by which ion-channel blockers occlude ion permeation is not well understood. Here we show that removal of the amino-terminal domains from the GluN1-GluN2B NMDA receptor yields a functional receptor and crystals with good diffraction properties, allowing us to map the binding site of the NMDA receptor blocker, MK-801. This crystal structure, together with long-timescale molecular dynamics simulations, shows how MK-801 and memantine (a drug approved for the treatment of Alzheimer's disease) bind within the vestibule of the ion channel, promote closure of the ion channel gate and lodge between the M3-helix-bundle crossing and the M2-pore loops, physically blocking ion permeation.


Figures

Extended Data Figure 1
Extended Data Figure 1. The ∆ATD NMDA receptor construct and structure
a, Selected amino acid sequences of constructs used in these studies are compared to the wild-type sequence to highlight mutations in both subunits. Locations of mutated sites and deletions are highlighted in yellow squares. Insertions of sequence are in blue or red. The ‘A2 tail’ is derived from residues 837-847 of GluA2 AMPA receptor carboxy terminus (NP_058957). b, Cartoon representation shows the GluN1 and GluN2B subunit constructs and modifications of the ∆ATD receptor. The locations of point mutations are highlighted in blue circles and the deletions are defined by yellow wedges. c, Superposition of the two ∆ATD NMDA receptors in the crystallographic asymmetric unit, aligned by the TMD. Black arrows show the shift between receptor 1 (light blue) and receptor 2 (magenta).
Extended Data Figure 2
Extended Data Figure 2. LBD dimer rearrangement and dynamics
a-b, Top down view from the extracellular side of the membrane, showing the LBD layer of the intact ∆2 NMDA receptor (a) with GluN1 in blue and GluN2B in yellow, and of the ∆ATD NMDA receptor (b) with GluN1 in green and GluN2B in orange. The M3-LBD linkers of GluN2B (red ribbon, Q653-S664) adopt distinct conformations in the two receptors. Shown are distances between GluN2B R739 residues (β carbon atoms; salmon spheres), the residue selected for the DEER experiments (in Å) in both the intact and ∆ATD receptors. c, Cartoon emphasizing how the ATDs participate in defining the conformation of the LBD layer and how this, in turn, keeps the GluN2B M3-D2 linker in a conformation capable of opening the channel gate. d, The Fo-Fc density (3σ, green mesh) fits loop 1 of the GluN1 subunit (blue cartoon) but not of the GluN2B subunit (orange cartoon). e, DEER data of MTSSL-labeled GluN2B R739C ∆ATD (red) (sample size n=2) and intact NMDA receptor (blue) (sample size n=1). Peak-normalized echo decay and the fits are shown on the left, and probability distributions of DEER distances are shown on the right. The probability distributions of the DEER distances show two major peaks, one centered at 35–40 Å and a second broad peak at ~55 Å. The amplitude of the two peaks in the ∆ATD receptor are comparable, with the 55 Å peak corresponding to the ‘rearranged’ LBD layer as seen in the ∆ATD crystal structure, whereas the shorter distance (~35–40 Å) indicates the canonical LBD arrangement, like that observed in the intact receptor structure. The intact receptor, by contrast, shows one major narrow peak at ~40 Å which corresponds nicely to the predicted distance based on the intact receptor crystal structure, whereas the small peak centered around 55 Å suggests the intact receptor may harbor a minor population with a ∆ATD-like LBD arrangement.
Extended Data Figure 3
Extended Data Figure 3. The ∆ATD NMDA receptor channel
a, Inhibition of agonist (300 μM glutamate and 300 μM glycine) induced current by 1 μM MK-801 for the ∆ATD NMDA receptor by TEVC. The inhibition ratio is 0.37 ± 0.06 (mean ± s.d., n=5). The holding potential is −60 mV. b, Superposition of the ∆2 and ∆ATD receptor TMDs shows that they adopt similar conformations. c, Side view of the ion pore with GluN2B subunits (orange ribbons) showing the van der Waals radius along the pore (magenta dots). The α carbons of selected residues facing the pore are shown as spheres. The radius is plotted against the distance along the pore axis.
Extended Data Figure 4
Extended Data Figure 4. Lipid accessibility of the TMD “tunnel”
a, Simulation snapshot (Sim. 2) of a lipid molecule with one of its tails trapped between the M2 and M3 helices of the GluN1 subunit (chain A, green ribbons) and the M3 helix of the adjacent GluN2B subunit (light blue ribbons) viewed from within the membrane and toward the pore. Residues L612, L613, A638, I641, and V642 of GluN1 (chain A) and V637 of GluN2B (chain D) of the tunnel walls (see main text) are shown as spheres with the carbon atoms being colored green and gray, respectively. GluN1 (chain C) and GluN2B (chain B) subunits are shown as green and light blue solid surfaces. The dark gray plane represents a cut across the lipid membrane, the remainder of which is shown as a red-white surface. b, Average lipid occupancy (number of lipid atoms) within 3.5 Å of the tunnel “walls,” defined by residues L612, L613, A638, I641, and V642 of GluN1 (chains A, C) and residue V637 of the GluN2B (chains B, D) subunit lining. The occupancy was calculated across the closed-pore and pore-opening simulations (Sims. 2 and 3) and all permeation simulations (Sims. 4–17). All individual simulations within a given panel = N; all individual data points aggregated across all simulations = n. N=16 (Sim. 2, 3, 4–17); n>>10. The error bars are standard deviations of the mean calculated from all individual data points aggregated across all simulations.
Extended Data Figure 5
Extended Data Figure 5. Binding time of MK-801 and memantine
a, Binding time of MK-801 in simulations 18–21. Green lines are 30-ns running medians, and red lines indicate bound and unbound states. (Binding was defined as the ligand heavy-atom center of mass being within 10 Å of the center of mass of the Cα atoms of the N612 residues of the two GluN2B subunits.) The mean binding time of simulations 20 and 21 at 0 mV was 0.78 ± 0.10 µs; application of voltage in simulations 18 and 19 (593.9 ± 3.8 and 197.9 ± 1.2 mV) did not significantly decrease the binding time. b, Binding time of memantine in simulations 24, 25, 28, 29, and 30. Simulations 26 and 27 were initiated with memantine already bound, and the binding curves from these simulations were thus omitted in the determination of the on-rates for this pore blocker. Green lines are 30-ns running medians, and red lines indicate bound and unbound states. The mean binding time in simulations 24 and 25 (at 0 mV) was 0.14 µs; application of voltage in simulations 28–30 (592.6 ± 0.3, 592.7 ± 0.3, and 196.9 ± 0.1 mV) did not significantly decrease the binding time. In simulations 29 and 30, “unbound” states following binding are artifacts due to the voltage driving memantine through the selectivity filter. N=1 in each panel.
Extended Data Figure 6
Extended Data Figure 6. Blocker-induced channel closure
The resemblance between the closed, deactivated receptor (leftmost panels) and the closed, pore-blocked receptor (rightmost panels) is shown. a-c, R.m.s.d. (Å; GluN1, red; GluN2B, blue) of the M3 bundle–crossing region (i.e., the activation gate) relative to the closed-state ∆2 crystal structure obtained from simulations of the closed pore (Sim. 2), pore opening (Sim. 3), permeation (Sim. 4 at 396.6 ± 2.7 mV, Sim. 5 at 593.8 ± 3.8 mV, and Sim. 6 (a) at 396.1 ± 2.7 mV or Sim. 7 (b, andc) at 415.1 ± 6.4 mV), two MK-801 binding simulations (Sims. 20 (a) and 21 (b)), and one memantine binding simulation (Sim. 25 (c)). N=1 in each panel.
Extended Data Figure 7
Extended Data Figure 7. Free energy estimates of MK-801 and memantine binding
a, Competition binding of memantine to the ∆2 receptor in the presence of 3 μM 3H MK-801, measured by the scintillation proximity assay. The plot shows data from a representative experiment with error bars representing s.e.m. from triplicate measurements. b, Dissociation constants (Kd, circles), derived from free energy estimates of binding of memantine and MK-801 to the open, intact, activated ∆2 receptor in which the pore has collapsed onto the ligand. The absolute experimental affinities of MK-801 (green) and memantine (red) for the ∆2 receptors are shown as squares. The free energies were calculated for four independent, ligand-bound configurations, all taken from binding simulations at zero transmembrane voltage (MK-801: Sims. 20 and 21; memantine: Sims. 24, 25, and 27). Each calculation consisted of 0.5 µs of simulation to solvate the ligand in water, followed by 3.0 µs of simulation of the protein-ligand complex. The average Kd values for MK-801 and memantine of ≈ 0.08 and ≈ 7.64 µM for the ∆2 receptor show a 100-fold difference in the affinities of these two ligands; the similar relative affinity of these two ligands has been found experimentally against the ∆2 receptor with Kd value of ≈ 1.1 μM for MK-801 and Ki value of ≈ 147.4 μM for memantine. The calculated binding free energies −9.78 ± 1.61 (MK-801) and −7.02 ± 1.24 kcal mol−1 (memantine), and thus the free energy–derived dissociation constants, are subject to large errors, estimated as standard errors of the mean, due to lack of convergence of including long-range effects from lipid molecules surrounding the pore. We note that the contribution of pore-cavity collapse upon ligand binding to the binding free energy is not included in the free energy calculations, which were performed with the pore-collapsed, intact, agonist-bound receptor. Also not included is the contribution of −ln(2)kBT arising from the two poses available to MK-801.
Extended Data Figure 8
Extended Data Figure 8. Hydrogen bonding propensity between MK-801 (a) and memantine (b) and the selectivity filter asparagine residues
a-b, The two N-site asparagine residues N614 (GluN1) and N612 (GluN2B) of the pore-loop tips, and the N+1 asparagine residue, N613, of the GluN2B subunit, which is believed to be involved in the voltage dependence of memantine binding. For MK-801 (a), the first panel shows data obtained at zero transmembrane voltage (Sims. 20–23), the second at 197.9 ± 1.2 mV (Sim. 19), and the third at 593.9 ± 3.8 mV (Sim. 18). N=4, N=1, N=1; n>>10. For memantine (b), the first panel shows data obtained at zero transmembrane voltage (Sims. 24–27), the second at 196.9 ± 0.1 mV (Sims. 30–32), and the third at 592.6 ± 0.3 and 592.7 ± 0.3 mV (Sims. 28 and 29). N=4, N=3, N=2; n>>10. Hydrogen bonding propensity is relatively low for N614 of GluN1, except at high voltage, suggesting that N612 and N613 of GluN2B are more important for pore-blocker binding and its voltage dependence, respectively; at nonzero transmembrane voltage, hydrogen bonding propensity increases at the N+1 site asparagine N613 of GluN2B. The error bars are standard deviations of the mean calculated from all individual data points aggregated across all simulations.
Extended Data Figure 9
Extended Data Figure 9. Binding mode distributions of MK-801 and memantine
a, MK-801 r.m.s.d. distributions (Å; heavy atoms only) obtained from MK-801 binding simulations 21–23, with respect to all MK-801 poses obtained in binding simulation 20. Mean (µ) and standard deviation (σ) are indicated in Å; solid red lines are best fits to a normal distribution, but the distributions for simulations 21 and 23 show clear evidence of two r.m.s.d. populations, consistent with the observation that MK-801 can block the pore in two symmetry-related poses. The degree of asymmetry of the distributions observed for simulations 21 and 23 indicates nonequal occupancy of the two poses, a result of incomplete sampling. We note that in simulation 22, one of the two poses almost completely predominates. N=1 for each panel; n>>10. b, Memantine r.m.s.d. distributions (Å; heavy atoms only), obtained from binding simulations 25–27, with respect to all poses obtained in memantine binding simulation 24. Mean (µ) and standard deviation (σ) are indicated in Å; solid lines are best fits to a normal distribution. The relatively narrow and unimodal distributions reflect that memantine appears to predominantly block the pore in a single pose. The heavy-atom average r.m.s.d. of the main poses of memantine was 3.7 ± 0.2 Å, less than that observed for MK-801. N=1 for each panel; n>>10. c, MK-801-I poses obtained in simulations with and without selectivity filter backbone torsional corrections. Gray: the two predominant poses observed with corrections (Sim. 1); cyan and orange: predominant poses identified from the initial portion (1–3 µs), before the filter deteriorated too extensively, of two different simulations without torsional corrections (pose 1: Sim. 42; pose 2: Sim. 47). 100 individual poses from the initial portion (1–3 µs, uniformly separated by 0.02 µs) are shown as cyan and orange lines with the iodine atoms shown as spheres. Both poses of MK-801-I observed in our simulations with torsional backbone corrections (Sim. 1) were thus also observed, with comparable stability, in these additional simulations without these corrections. d, MK-801 poses obtained in free binding simulations with and without filter backbone torsional corrections. Gray: the two distinct poses observed in a free binding simulation with backbone corrections (Sim. 20); cyan and orange: poses in the three independent simulations without corrections in which MK-801 bound stably (Sim. 50: pose identification period: 4–18 µs; Sim. 51: pose identification period: 9–12 µs; Sim. 53: pose identification period: 3–4 µs). MK-801 bound stably to the receptor in three (Sims. 50, 51, and 53) out of five simulations performed without corrections—again in two distinct poses, as observed in our simulations with torsional corrections—and some closure of the activation gate (i.e., the bundle-crossing region) was also observed in these three simulations before the filter deteriorated.
Figure 1
Figure 1. Architecture of the GluN1/GluN2B ∆ATD NMDA receptor
a-b, Composite omit maps (blue mesh) of GluN1 (green ribbon) and GluN2B (red ribbon) LBDs contoured at 1.0 σ, showing the inter-dimer (a) and intra-dimer interfaces (b). c, d, Side views of the ∆ATD receptor with GluN1 (green) and GluN2B (orange) subunits. e-f, Top-down views of the ∆2 receptor (e) and the ∆ATD receptor (f) from the extracellular side of the membrane.
Figure 2
Figure 2. MK-801 binding site defined by x-ray crystallography
a, Saturation binding of 3H-MK-801 to the intact ∆2 NMDA receptor and to the ∆ATD receptor, which both feature the GluN1 G610R mutation, compared to the intact ∆2 G610 receptor, which harbors the native glycine residue at position 610. Error bars represent standard errors of the mean (s.e.m.) from triplicate measurements. b, Composite omit map (blue mesh) in the TMD region of the ∆ATD GluN2B subunits (orange ribbon) and MK-801 (red stick), contoured at 1.0 σ. c-d, Top-down (c) and side views (d) of MK-801 bound (carbon atoms in red, nitrogen atom in blue) in the central vestibule, with the residues involved in the binding pocket shown in sticks and the α-carbons of the N612 residues (GluN2B) shown as spheres (d). e, Single point binding of 3H-MK-801 to the ∆2 G610 receptor and to site-directed mutants. Error bars represent s.e.m. from triplicate measurements. f, Top-down view of a slice through the TMD, where the protein surface is in solvent accessible surface representation, showing the Fo-Fc electron density (3.0σ, yellow mesh) of MK-801, the residues (sticks) involved in the binding pocket, and two tunnels (cyan) which connect the central vestibule to the cell membrane.
Figure 3
Figure 3. Steric clashes block MK-801 binding at AMPA receptors
a, Superposition of the M2, pore loop and M3 elements of the GluN1 (green) and GluN2B (orange) subunits from the ∆ATD receptor crystal structure. The α carbons of key asparagine residues are shown as spheres. b-c, Superposition of elements of the ∆ATD receptor from panel a with the equivalent elements of the GluA2 AMPA receptor (PDB code: 5VOT) with R607 (b) or Q607 (c). The NMDA receptor GluN2B subunits (orange) and GluN1 subunits (green) are superposed on the equivalent regions of the GluA2 AMPA receptor B/D subunits (cyan) or the A/C subunits (pink), respectively. All superpositions are based on the Cα atoms of the conserved ‘SYTANL’ region. Dashed lines show likely steric clashes. d, Sequence alignment of the channel region between the NMDA receptor and AMPA receptor subunits. The residues involved in MK-801 binding and the corresponding GluA2 residues are highlighted in yellow. Residues of the ‘SYTANL’ motif are highlighted in gray.
Figure 4
Figure 4. Mechanism of MK-801 and memantine binding
a, The chemical structures of 3-iodo MK-801 and memantine. b, Plots of competition binding of cold 3-iodo MK-801 to the 3H-MK-801 bound ∆2 G610 receptor. The plot shows data from a representative experiment with error bars representing s.e.m. from triplicate measurements. c, The iodine anomalous density (green mesh) shown together with the positions of the MK-801 molecule in the crystal structure (red sticks) and the pseudo-2-fold related binding pose (salmon sticks). The carbon atoms at the 3 position are shown in yellow spheres. d, Positions of 3-iodo MK-801 obtained from MD simulations (Sim. 1) initiated from 3-iodo MK-801 docked in the binding pocket of the ∆2 structure. The movement of the iodine atoms (purple) of 3-iodo MK-801 clustered into two populations, in agreement with the anomalous difference densities (green mesh). In each of its two predominant poses (cyan and yellow sticks), MK-801 forms hydrogen bonds with N614 (GluN1) and N612 (GluN2B) (gray sticks). e, Simulation snapshot of ∆2 NMDA receptor (GluN1 in blue and GluN2B in yellow) embedded in POPC lipid membrane (red and gray lines). f, The open pore (gray) obtained in simulation 3, superposed onto the closed pore of the ∆2 receptor crystal structure. Arrows indicate the transition of gate opening. g-h, MD simulation snapshots of MK-801 (g, cyan, Sim. 20) and memantine (h, orange, Sim. 24) during free-binding simulations in which they bound to the open state of the ∆2 receptor (at zero transmembrane voltage). The blockers enter the pore by the aqueous path (black arrows). MK-801 demonstrates two distributions of binding poses (cyan and yellow sticks), overlapping with MK-801 in the crystal structure (red stick) but memantine shows a predominant pose (purple). Both of them interact with asparagine residues (gray sticks) on the pore loops. i-j, Schematic representations of MK-801 and memantine binding sites, respectively. Both channel blockers induce channel closure (red arrows) while blocking the pore and adopting similar interactions with key asparagine residues.

References

    1. Traynelis SF, et al. Glutamate receptor ion channels: structure, regulation, and function. Pharmacol. Rev. 2010;62:405–496. - PMC - PubMed
    1. Paoletti P. Molecular basis of NMDA receptor functional diversity. Eur. J. Neurosci. 2011;33:1351–1365. - PubMed
    1. Lee CH, et al. NMDA receptor structures reveal subunit arrangement and pore architecture. Nature. 2014;511:191–197. - PMC - PubMed
    1. Karakas E, Furukawa H. Crystal structure of a heteromeric NMDA receptor ion channel. Science. 2014;344:992–997. - PMC - PubMed
    1. Mayer ML, Westbrook GL, Guthrie PB. Voltage-dependent block by Mg2+ of NMDA responses in spinal cord neurones. Nature. 1984;309:261–263. - PubMed

Publication types

MeSH terms