. 2018 Apr;556(7702):501-504.
doi: 10.1038/s41586-018-0052-z. Epub 2018 Apr 18.

Electrophilic properties of itaconate and derivatives regulate the IκBζ-ATF3 inflammatory axis

Affiliations

Electrophilic properties of itaconate and derivatives regulate the IκBζ-ATF3 inflammatory axis

Monika Bambouskova et al. Nature. 2018 Apr.

Abstract

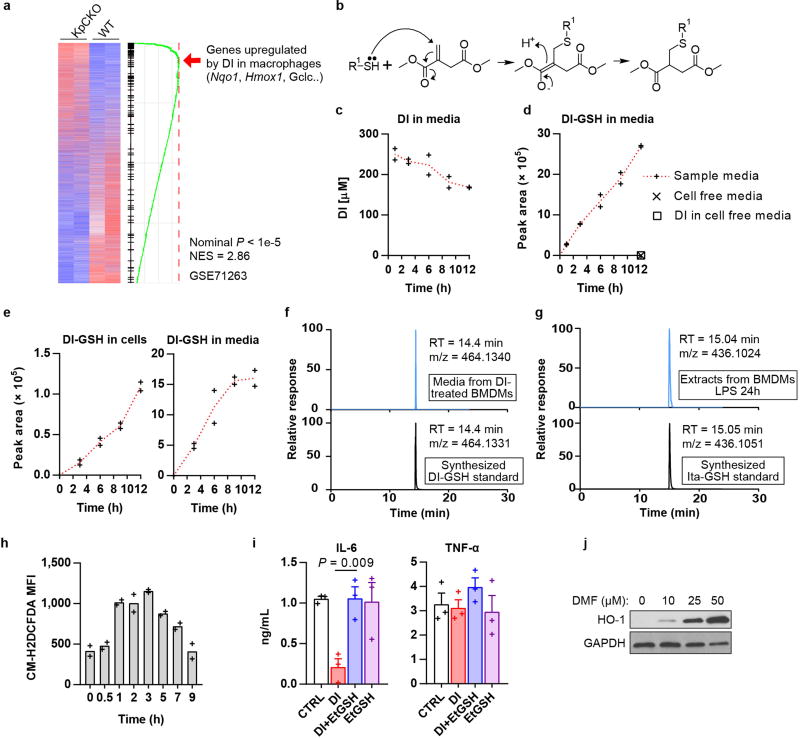
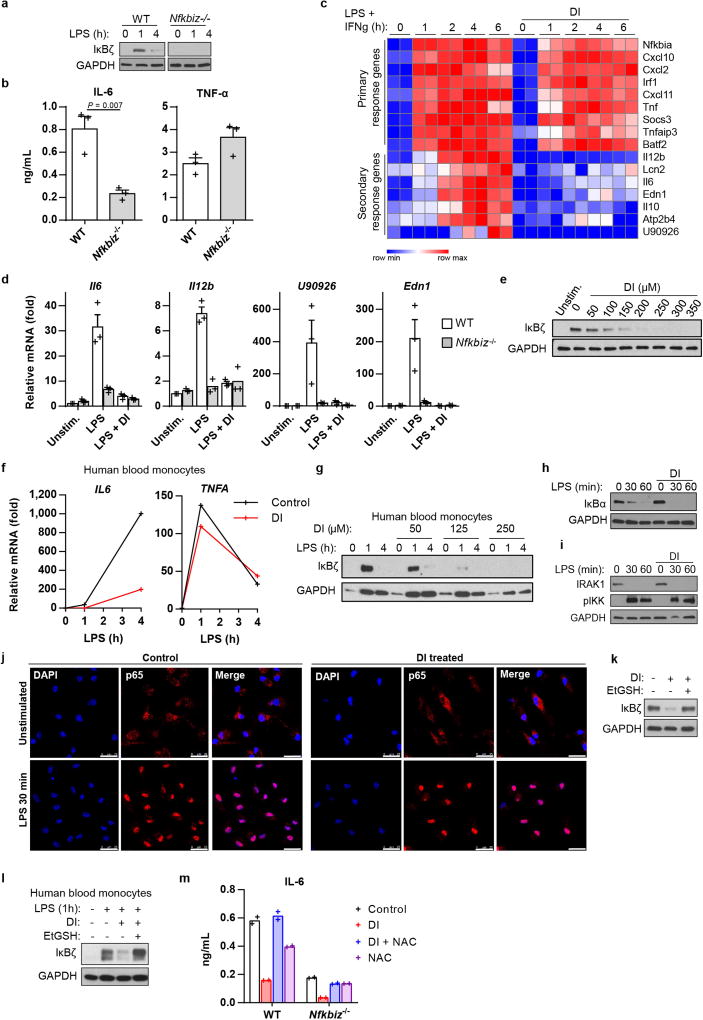
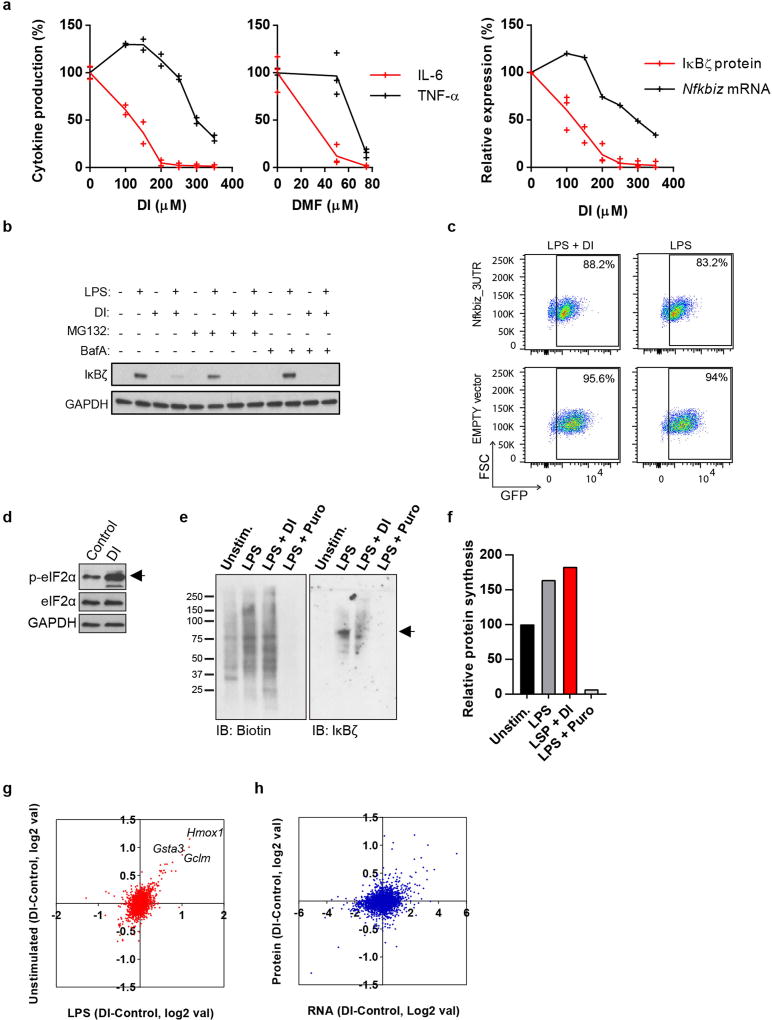
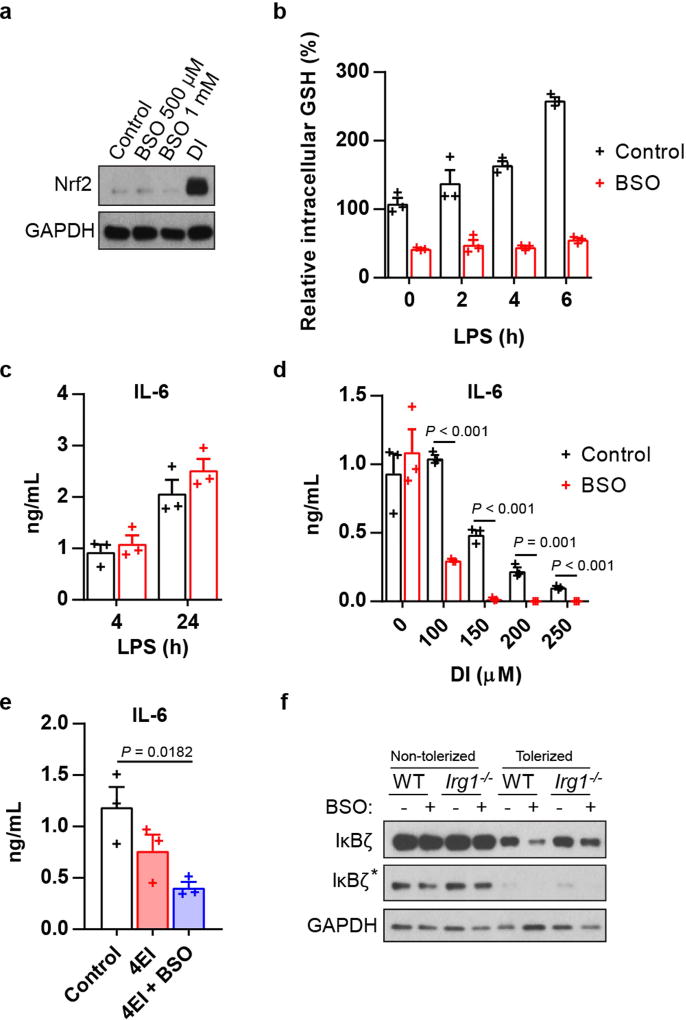
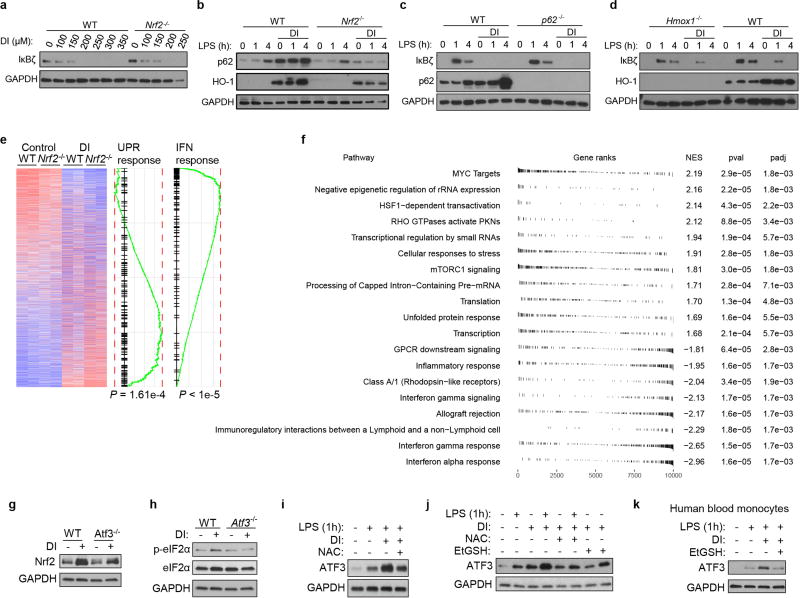
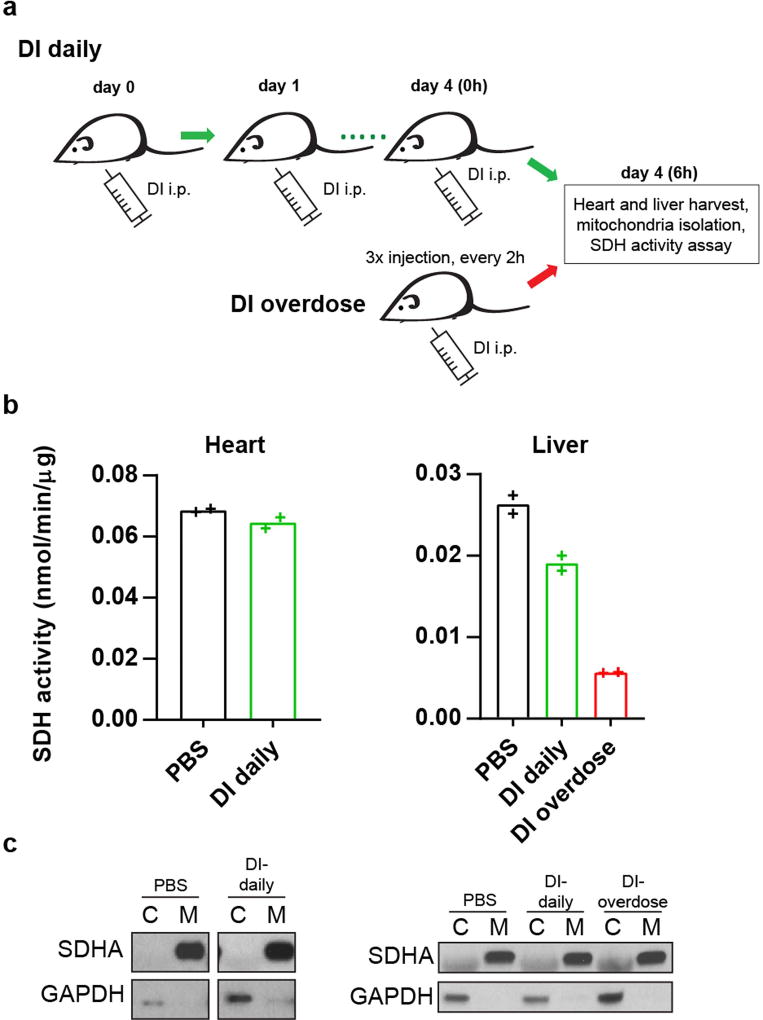
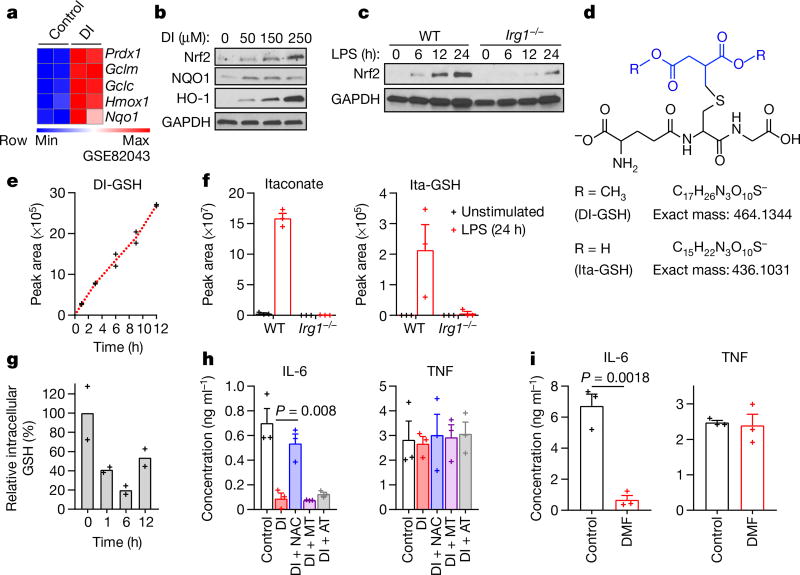
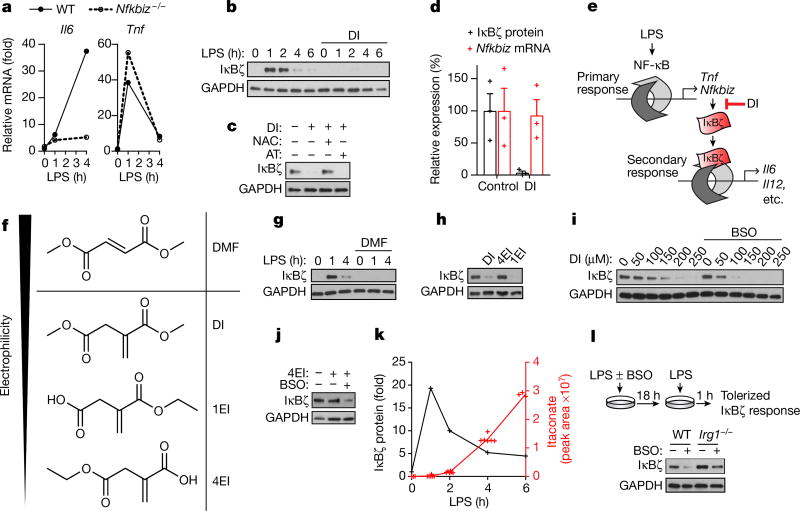
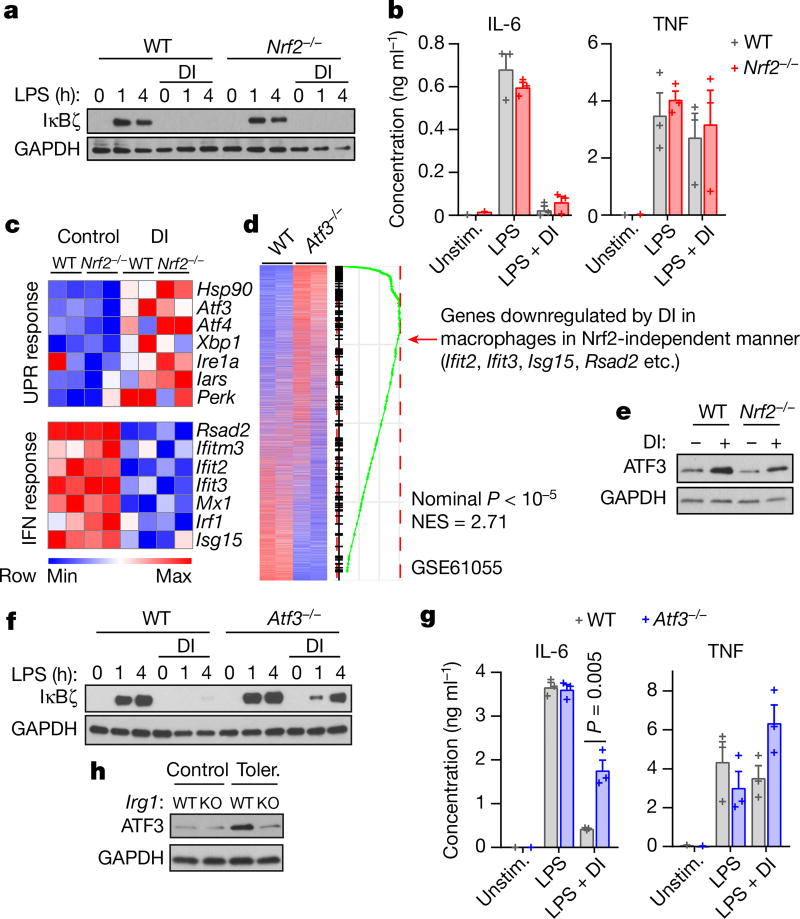
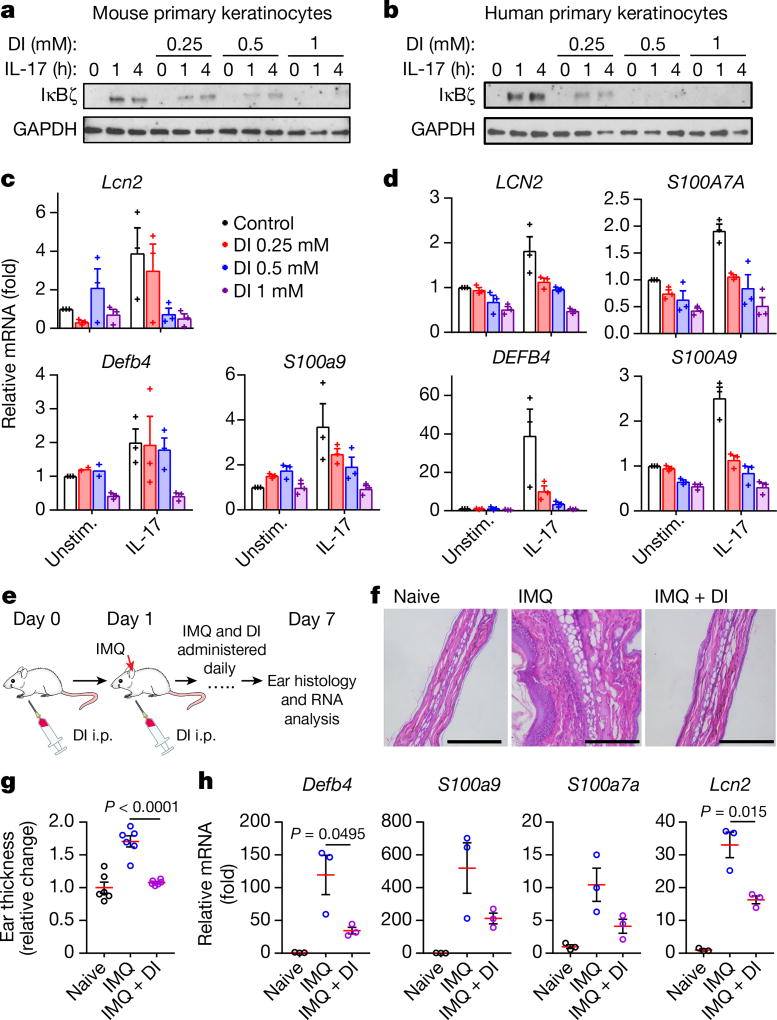
Metabolic regulation has been recognized as a powerful principle guiding immune responses. Inflammatory macrophages undergo extensive metabolic rewiring 1 marked by the production of substantial amounts of itaconate, which has recently been described as an immunoregulatory metabolite 2 . Itaconate and its membrane-permeable derivative dimethyl itaconate (DI) selectively inhibit a subset of cytokines 2 , including IL-6 and IL-12 but not TNF. The major effects of itaconate on cellular metabolism during macrophage activation have been attributed to the inhibition of succinate dehydrogenase2,3, yet this inhibition alone is not sufficient to account for the pronounced immunoregulatory effects observed in the case of DI. Furthermore, the regulatory pathway responsible for such selective effects of itaconate and DI on the inflammatory program has not been defined. Here we show that itaconate and DI induce electrophilic stress, react with glutathione and subsequently induce both Nrf2 (also known as NFE2L2)-dependent and -independent responses. We find that electrophilic stress can selectively regulate secondary, but not primary, transcriptional responses to toll-like receptor stimulation via inhibition of IκBζ protein induction. The regulation of IκBζ is independent of Nrf2, and we identify ATF3 as its key mediator. The inhibitory effect is conserved across species and cell types, and the in vivo administration of DI can ameliorate IL-17-IκBζ-driven skin pathology in a mouse model of psoriasis, highlighting the therapeutic potential of this regulatory pathway. Our results demonstrate that targeting the DI-IκBζ regulatory axis could be an important new strategy for the treatment of IL-17-IκBζ-mediated autoimmune diseases.


Conflict of interest statement

Competing interests M.B., V.L. and M.N.A. are listed as inventors on provisional patent applications regarding the anti-inflammatory properties of itaconate derivatives.

Figures

Extended Data Fig. 1
Extended Data Fig. 1. Detection of DI-GSH and Ita-GSH and electrophilic stress response
a, Transcriptional comparison of KpCKO and wild-type BMDMs and enrichment of the DI gene signature. b, The reaction of DI with a thiol group in a Michael reaction. c, DI levels in media of BMDMs treated with DI for the indicated time, as determined by GC–MS. Mean of n = 2 cultures. d, Levels of the DI-GSH conjugate in the media of BMDMs treated with DI for the indicated time, as detected by LC–MS. Mean of n = 2 cultures. Data from Fig. 1e are overlaid with data for cell-free media. e, Levels of DI-GSH conjugate in BMDMs (left) and in their media (right) after treatment with 13C5-labelled DI for the indicated time, as detected by LC–MS. Mean of n = 2 cultures. f, g, Representative extracted ion chromatograms of DI-GSH detected in the media of BMDMs treated with DI for 6 h compared to the synthesized DI-GSH standard (f), and Ita-GSH detected in BMDMs stimulated with LPS for 24 h compared to the synthesized Ita-GSH standard (g). n = 10 technical replicates. h, Detection of reactive oxygen species in BV2 cells treated with DI for the indicated time, as determined by flow cytometry. Mean of n = 2 experiments. i, Cytokine production in BMDMs treated with DI in the presence of EtGSH and stimulated with LPS for 4 h, mean ± s.e.m., n = 3 experiments. j, Western blot of HO-1 expression in BMDMs treated with DMF. Representative of three experiments. For gel source data, see Supplementary Fig. 1. Statistical tests used were two-tailed t-tests.
Extended Data Fig. 2
Extended Data Fig. 2. DI downregulates secondary transcriptional response to TLR stimulation
a, Western blot of IκBζ expression in wild-type or Nfkbiz−/− BMDMs stimulated with LPS. b, Cytokine production in wild-type and Nfkbiz−/− BMDMs stimulated with LPS for 4 h, mean ± s.e.m., n = 3 experiments. c, RNA-seq analysis of BMDMs treated with DI and stimulated with LPS and IFNγ. d, mRNA expression show the induction of the indicated target genes in wild-type and Nfkbiz−/− BMDMs treated with DI and stimulated with LPS for 4 h, mean ± s.e.m., n = 3 experiments. e, Western blot of IκBζ expression in DI-treated BMDMs stimulated with LPS for 1 h. f, mRNA expression in human blood monocytes treated with DI and stimulated with LPS. g, Western blot of IκBζ expression in human blood monocytes treated with DI and stimulated with LPS. h, i, Western blot of IκBα (h) and IRAK1 expression and IKK phosphorylation (i) in BMDMs treated with DI and stimulated with LPS. j, p65 localization in DI-treated, LPS-stimulated BMDMs. Nuclei are stained with DAPI. Scale bars, 25 µm. Representative of two cultures. k, Western blot of IκBζ expression in BMDMs treated with DI in the presence of EtGSH and stimulated with LPS for 1 h. l, Western blot of IκBζ expression in human blood monocytes treated with DI in the presence of EtGSH and stimulated with LPS for 1 h. m, Cytokine production in wild-type or Nfkbiz−/− BMDMs treated with DI in the presence of NAC, stimulated with LPS for 4 h. Mean of n = 2 cultures. Representative data from two experiments (a), three experiments (e, h, i, k), three donors (f, g) and two donors (l). For gel source data, see Supplementary Fig. 1. Statistical tests used were two-tailed t-tests.
Extended Data Fig. 3
Extended Data Fig. 3. DI regulates IκBζ at the post-transcriptional level
a, Comparison of the effects of DI on IL-6, TNF and IκBζ on the protein and mRNA levels. Cytokine production is shown in BMDMs treated with DI (left) or DMF (middle) and stimulated with LPS for 4 h (DI), mean of n = 2 experiments, or 24 h (DMF), mean ± s.e.m., n = 3 experiments. Right, densitometric quantification of IκBζ protein and mRNA expression is shown for BMDMs treated with DI, stimulated with LPS for 1 h. Mean of n = 3 experiments, mRNA representative of two experiments. b, Western blot of IκBζ expression in BMDMs treated with DI and stimulated with LPS for 1 h. MG132 or bafilomycin A (BafA) were added 30 min before LPS stimulation. c, Nfkbiz 3′ UTR reporter expressing GFP in BV2 cells treated with DI (250 µM) for 12 h and stimulated with LPS for 1 h. EMPTY vector expressed GFP only; GFP expression determined by flow cytometry. d, Western blot of phosphorylated and total eIF2α in DI-treated BMDMs. e, Western blot of nascent protein synthesis detected using biotin–alkyne click chemistry in BMDMs treated with DI and stimulated with LPS for 1 h. The same membrane was reprobed for IκBζ. Representative of two experiments. f, Densitometric quantification of the biotin signal in the membrane in e. g, log fold change of proteomic signal in unstimulated and LPS-stimulated cells. h, log fold change of transcript and protein. For bd, data is representative of three experiments.
Extended Data Fig. 4
Extended Data Fig. 4. BSO potentiates the inhibitory effect of DI
a, Western blot of Nrf2 expression in BMDMs treated with BSO or DI. b, GSH levels in BMDMs treated with BSO and stimulated with LPS. Mean ± s.e.m., n = 3 cultures. c, Cytokine production in BMDMs treated with BSO and stimulated with LPS. Mean ± s.e.m., n = 3 experiments. d, Cytokine production in BMDMs treated with DI and BSO and stimulated with LPS for 4 h. Mean ± s.e.m., n = 3 experiments. e, Cytokine production in BMDMs treated with 4EI (10 mM) and BSO and stimulated with LPS for 4 h. Mean ± s.e.m., n = 3 experiments. f, Western blot of IκBζ expression in BMDMs tolerized with LPS in the presence of BSO for 18 h and restimulated for 1 h (see Fig. 2l), asterisk shows the different exposures. Western blot data are representative of three experiments. For gel source data, see Supplementary Fig. 1. Statistical tests used were two-tailed t-tests.
Extended Data Fig. 5
Extended Data Fig. 5. Nrf2-independent action of DI
a, Western blot of IκBζ expression in wild-type or Nrf2−/− BMDMs treated with DI and stimulated with LPS for 1 h. b, Western blot of p62 and HO-1 in wild-type or Nrf2−/− BMDMs treated with DI and stimulated with LPS. c, Western blot of IκBζ expression in wild-type and p62-deficient BMDMs treated with DI and stimulated with LPS. d, Western blot of IκBζ expression in wild-type and Hmox1-deficient BMDMs treated with DI and stimulated with LPS. e, Transcriptional comparison of Nrf2−/− and wild-type BMDMs treated with DI and GSEA statistics for unfolded protein response (UPR) and IFNα pathways. f, Pathways regulated by DI in an Nrf2-independent manner. Gene ranks, normalized enrichment score (NES), P and adjusted P (padj) are shown. g, h, Western blot of Nrf2 expression (g) or phosphorylated and total eIF2α (h) in DI-treated wild-type or Atf3−/− BMDMs. ik, Western blot of ATF3 in BMDMs (i, j) and human blood monocytes (k) treated with DI in combination with NAC or EtGSH and stimulated with LPS. Data are representative of three experiments (a, g, i, j), two experiments (b, c, h), one experiment (d) and from two donors (k). For gel source data, see Supplementary Fig. 1.
Extended Data Fig. 6
Extended Data Fig. 6. Viability of keratinocytes after DI treatment
Mouse and human primary keratinocytes were treated with DI for 12 h and viability was determined by propidium iodide staining and flow cytometry. Percentage of propidium iodide-negative cells is shown. Representative of two mice or donors.
Extended Data Fig. 7
Extended Data Fig. 7. DI shows a lack of in vivo toxicity
a, Schematic of DI administration for the analysis of succinate dehydrogenase (SDH) activity in the heart and the liver. b, SDH activity in the heart and the liver of mice treated as in a. Mean of n = 2 technical replicates. Representative data from two mice. c, Western blot of SDH and GAPDH in mitochondrial and cytoplasmic fractions from the heart and the liver of mice treated as in a. Representative of two mice. For gel source data, see Supplementary Fig. 1.
Fig. 1
Fig. 1. DI and itaconate induce electrophilic stress in macrophages
a, Nrf2-response genes in DI-treated BMDMs. b, c, Western blots of Nrf2 and Nrf2 targets in DI-treated (b) or LPS-stimulated (c) BMDMs. d, The chemical structures of DI-GSH and Ita-GSH. e, DI-GSH levels in the media of DI-treated BMDMs, mean of n = 2 cultures. f, Itaconate (left) and Ita-GSH (right) levels in BMDMs, mean ± s.e.m., n = 3 cultures. g, GSH levels in DI-treated BMDMs, mean of n = 2 experiments. h, i, Cytokine levels in BMDMs treated as indicated and LPS-stimulated for 4 h (h) and 24 h (i); mean ± s.e.m., n = 3 experiments. Western blots are representatives of three experiments. For gel source data, see Supplementary Fig. 1. Statistical tests used were two-tailed t-tests. AT, α-tocopherol; MT, MitoTEMPO.
Fig. 2
Fig. 2. DI inhibits LPS-mediated IκBζ induction
a, mRNA expression in LPS-stimulated BMDMs. Representative of two experiments. b, c, gj, Western blots of IκBζ expression in BMDMs treated with DI, DMF, 4EI (h, 5 µM; j, 10 µM) or 1EI, LPS for 1 h or as indicated. d, Relative levels of IκBζ protein and mRNA in BMDMs treated with DI and then LPS for 1 h, mean ± s.e.m., n = 3 experiments. e, Schematic showing the mechanism of action of DI. f, Structures of DMF and itaconate derivatives. k, Densitometry of IκBζ from b and itaconate levels, mean of n = 6 cultures. l, Schematic (top) and western blot (bottom) for the measurement of IκBζ expression in BMDMs tolerized in the presence of BSO. Western blots are representative of three experiments (except for h, two experiments). For gel source data, see Supplementary Fig. 1.
Fig. 3
Fig. 3. DI induces an Nrf2-independent response and inhibits the IL-6–IκBζ axis via ATF3
a, f, Western blots showing IκBζ expression in Nrf2−/− (a) and Atf3−/− (f) BMDMs. b, g, Cytokine levels in BMDMs treated with DI, stimulated with LPS for 4 h (b) and 24 h (g), mean ± s.e.m., n = 3 experiments. c, Genes regulated by DI independently of Nrf2. Hsp90, Ire1a and Perk are also known as Hsp84-2, Ern1 and Eif2ak3, respectively. ‘UPS response’ indicates UPS response pathways. d, Transcriptional comparison of Atf3−/− and wild-type BMDMs and enrichment of the Nrf2-independent DI signature. e, h, Western blots of ATF3 expression in BMDMs after DI treatment (e) and tolerized in the presence of BSO (h). Western blot data are representative of three experiments. For gel source data, see Supplementary Fig. 1. Statistical tests used were two-tailed t-tests. KO, knockout; NES, normalized enrichment score; UPR, unfolded protein response.
Fig. 4
Fig. 4. DI inhibits IL-17-mediated IκBζ induction in keratinocytes and ameliorates psoriatic pathology
a, b, Western blot of IκBζ expression in DI-treated, IL-17A-stimulated primary mouse (a) and human (b) keratinocytes. Representative of three mice or donors. For gel source data, see Supplementary Fig. 1. c, d, mRNA expression in DI-treated, IL-17A-stimulated (4 h) primary mouse (c) and human (d) keratinocytes, mean ± s.e.m., n = 3 mice or donors. e, Schematic of DI administration in a psoriasis model. f, Ear histology of control mice (left), IMQ-treated mice (middle) and mice treated with both IMQ and DI (right). Scale bars, 100 µm. Representative of six mice in two experiments. g, Quantification of the histology results in f, showing the relative change in ear thickness. Mean ± s.e.m., n = 6 mice. h, mRNA expression to show the induction of the indicated IκBζ target genes in ear tissue, mean ± s.e.m., n = 3 mice. Statistical tests used were two-tailed t-tests.

Comment in

  • Itaconate charges down inflammation.
    Bordon Y. Bordon Y. Nat Rev Immunol. 2018 Jun;18(6):360-361. doi: 10.1038/s41577-018-0016-4. Nat Rev Immunol. 2018. PMID: 29725119 No abstract available.

References

    1. Jha AK, et al. Network integration of parallel metabolic and transcriptional data reveals metabolic modules that regulate macrophage polarization. Immunity. 2015;42:419–430. - PubMed
    1. Lampropoulou V, et al. Itaconate links inhibition of succinate dehydrogenase with macrophage metabolic remodeling and regulation of inflammation. Cell Metab. 2016;24:158–166. - PMC - PubMed
    1. Cordes T, et al. Immunoresponsive gene 1 and itaconate inhibit succinate dehydrogenase to modulate intracellular succinate levels. J. Biol. Chem. 2016;291:14274–14284. - PMC - PubMed
    1. Gorrini C, Harris IS, Mak TW. Modulation of oxidative stress as an anticancer strategy. Nat. Rev. Drug Discov. 2013;12:931–947. - PubMed
    1. Kobayashi EH, et al. Nrf2 suppresses macrophage inflammatory response by blocking proinflammatory cytokine transcription. Nat. Commun. 2016;7:11624. - PMC - PubMed

Publication types

MeSH terms