. 2018 Apr;556(7702):452-456.
doi: 10.1038/s41586-018-0043-0. Epub 2018 Apr 18.

Renewing Felsenstein's phylogenetic bootstrap in the era of big data

Affiliations

Renewing Felsenstein's phylogenetic bootstrap in the era of big data

F Lemoine et al. Nature. 2018 Apr.

Abstract

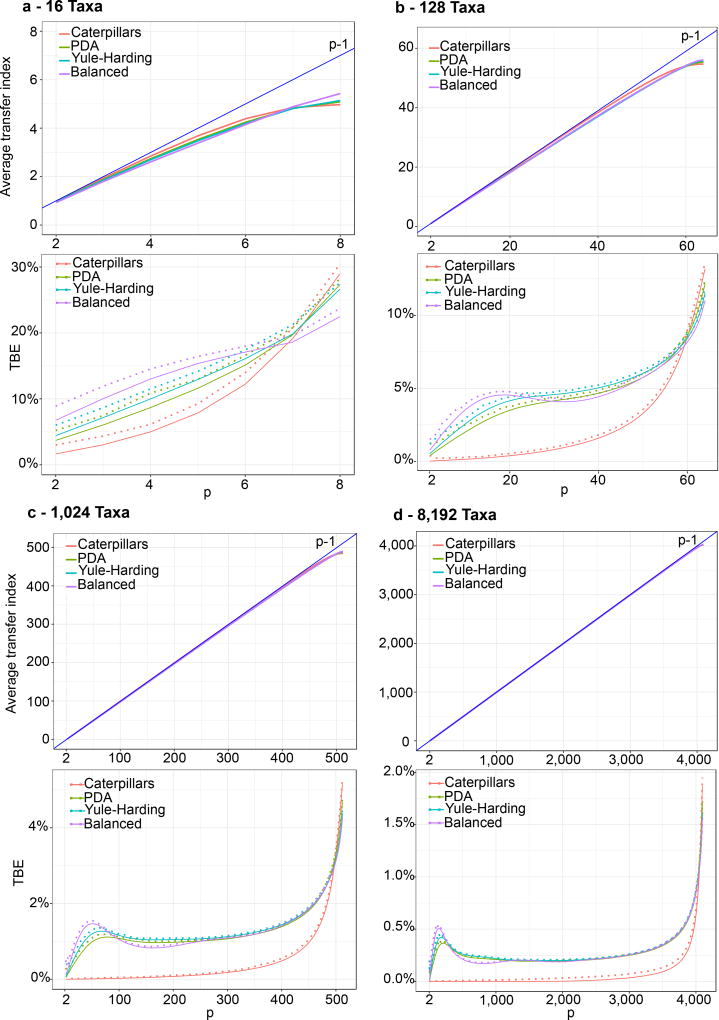
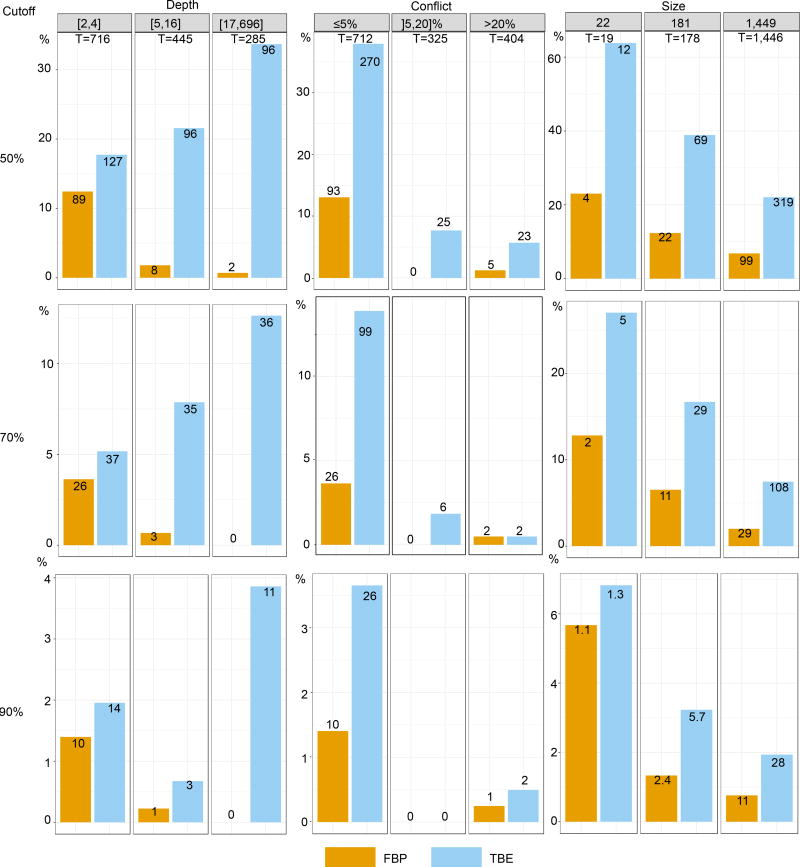
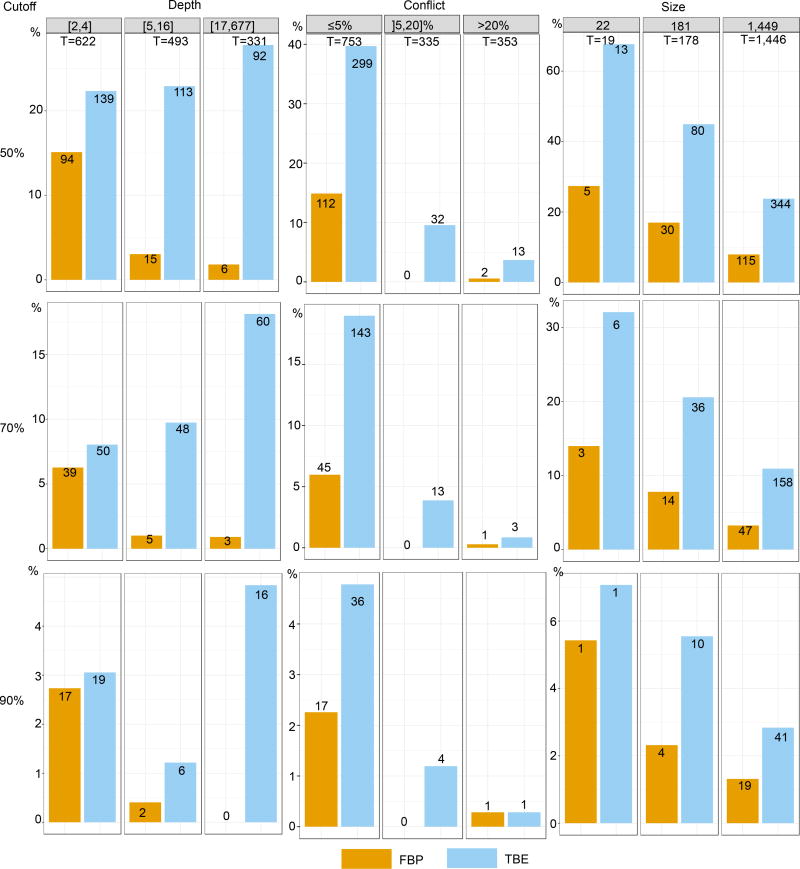
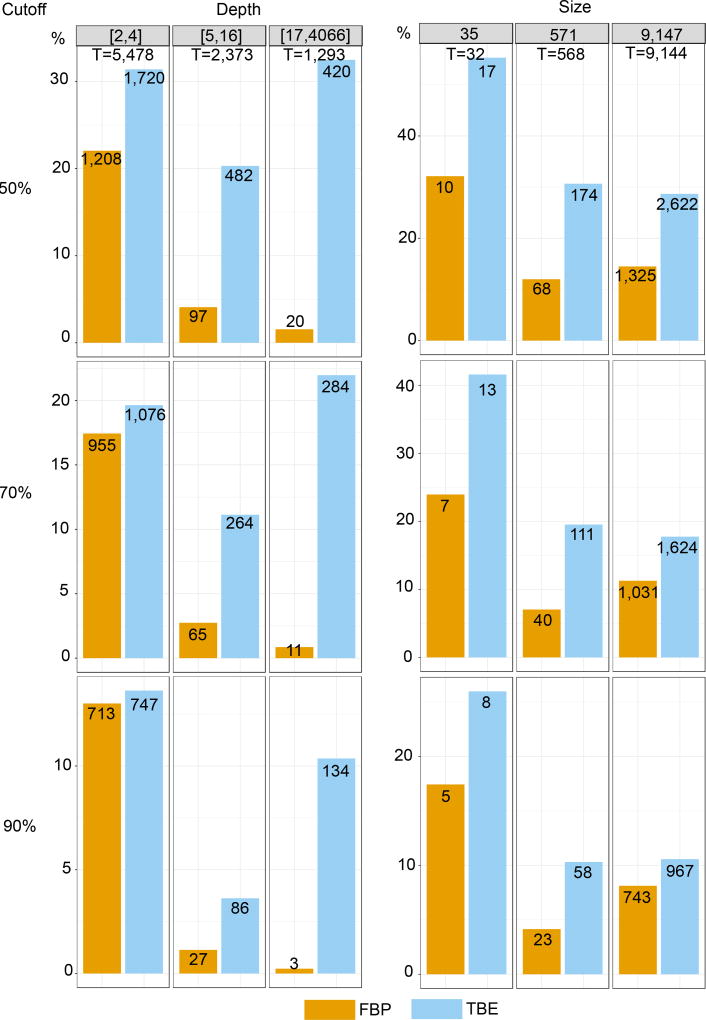
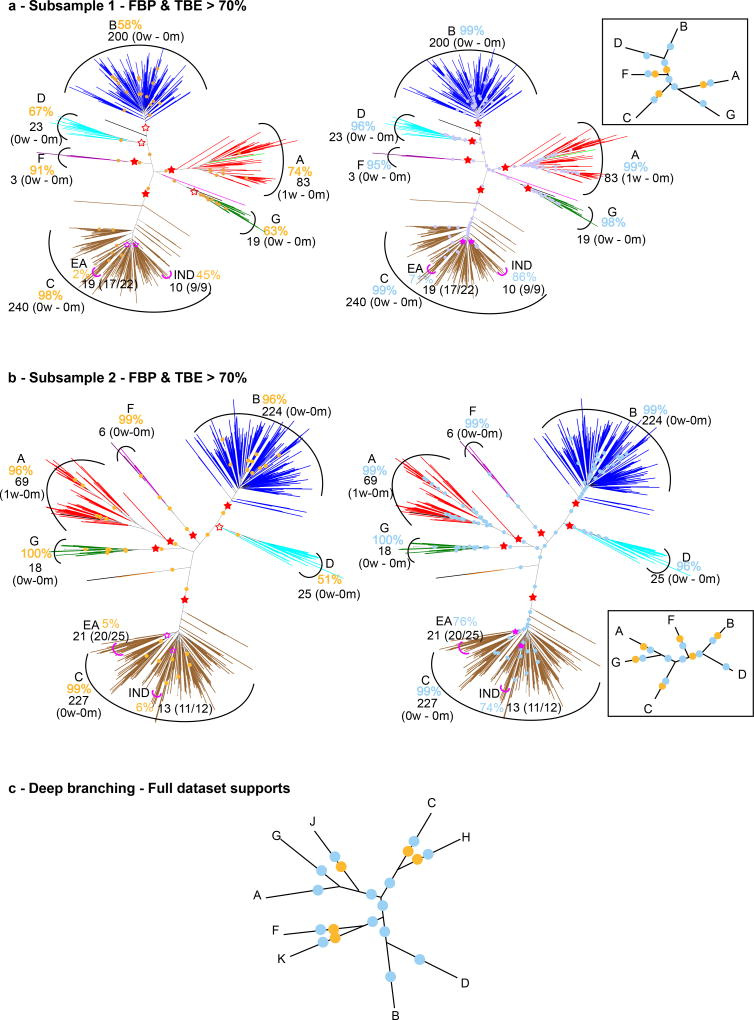
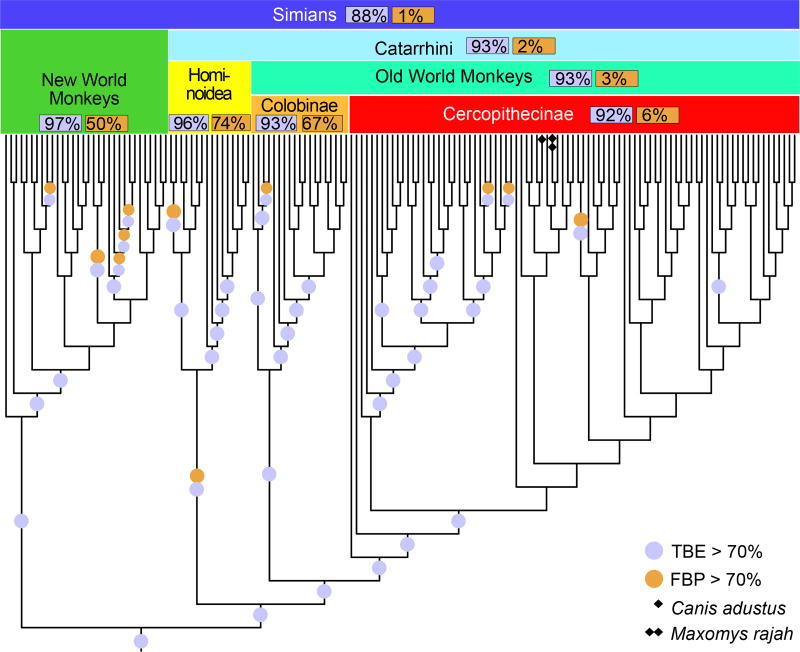
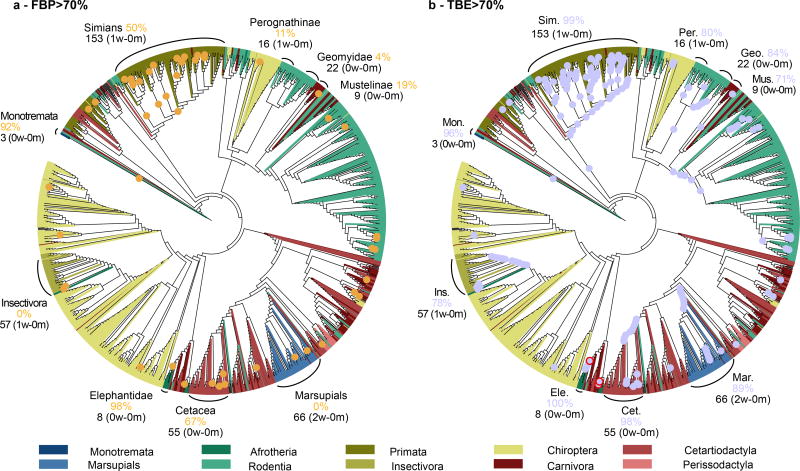
Felsenstein's application of the bootstrap method to evolutionary trees is one of the most cited scientific papers of all time. The bootstrap method, which is based on resampling and replications, is used extensively to assess the robustness of phylogenetic inferences. However, increasing numbers of sequences are now available for a wide variety of species, and phylogenies based on hundreds or thousands of taxa are becoming routine. With phylogenies of this size Felsenstein's bootstrap tends to yield very low supports, especially on deep branches. Here we propose a new version of the phylogenetic bootstrap in which the presence of inferred branches in replications is measured using a gradual 'transfer' distance rather than the binary presence or absence index used in Felsenstein's original version. The resulting supports are higher and do not induce falsely supported branches. The application of our method to large mammal, HIV and simulated datasets reveals their phylogenetic signals, whereas Felsenstein's bootstrap fails to do so.


Conflict of interest statement

Competing interests: None.

Figures

Fig. ED1
Fig. ED1. Transfer index expectation and TBE support with random trees
For each number of taxa (panels (a) to (d)) and random tree model, we compare the transfer index average over 100 runs with the upper-bound p−1 (top graphs). We also compare the average transfer bootstrap support (TBE) to 0, and provide (dashed lines) the maximum value observed among 100 runs, thus approximating the 1% quantile of the distribution (bottom graphs). With l ≥ 1, 024 (c), the average transfer index with random trees is surprisingly close to the upper bound p − 1, and the approximation is already satisfying with l = 128 (b). Moreover, the results are nearly the same for the four random tree models, suggesting that the asymptotic behaviour holds in a number of settings. As expected, the approximation of the transfer index over random bootstrap trees by p − 1 is better with small p. These results explain why moderate TBE supports, for example 70% as used throughout the article, are sufficient to reject poor branches, as a TBE branch support of 70% cannot be observed by chance, even with a small number of taxa (e.g. 16, (a)).
Fig. ED2
Fig. ED2. Comparison of FBP and TBE – Mammal dataset – FastTree
Both supports are compared regarding branch depth, quartet conflicts with the NCBI taxonomy, and tree size (see text and notes to Fig. 1 and 2 for explanations). Three support cut-offs are used to select the branches: 50%, 70%, and 90% (e.g. 28 branches among 1,446 have TBE ≥ 90% and 11 have FBP ≥ 90%). The FastTree topology is poor, with 38% of quartets contradicted by the NCBI taxonomy, and 404/1441 branches with contradiction >20%. Despite this difficulty, FBP and TBE perform well as they give supports larger than 70% to a very low number of moderately (]5,20]%) and highly (>20%) conflictual branches. FBP supports very few deep branches, while TBE supports a larger number of them, and is especially useful with large trees. Comparing the three cut-offs, we see that with 50% the selected branches are still weakly contradicted, especially with FBP; as expected, with TBE the fraction of contradicted branches (>5%) is a bit higher but still low (~7%). With 90%, very few branches are selected (~2% with TBE), thus justifying the use of the same 70% threshold for TBE as is standard with FBP.
Fig. ED3
Fig. ED3. Comparison of FBP and TBE – Mammal dataset – RAxML with rapid bootstrap
Both supports are compared regarding branch depth, quartet conflicts with the NCBI taxonomy, and tree size (see text and notes to Fig. 1 and 2 for explanations). Three support cut-offs are used to select the branches: 50%, 70%, and 90% (e.g. 41 branches among 1,446 have TBE ≥ 90% and 19 have FBP ≥ 90%). The RAxML topology is closer to the NCBI taxonomy than the FastTree topology is (27% versus 38% of contradicted quartets, and 353 versus 404 branches with contradiction >20%, respectively). However, the RAxML topology is still relatively poor, as expected in this type of phylogenetic study based on a unique marker (Fig. 4 and text). Despite this difficulty, FBP and TBE perform well as they give supports larger than 70% to a very low number of moderately (]5,20]%) and highly (>20%) conflictual branches. The supports obtained with RAxML are higher than FastTree’s (47 versus 29 branches with FBP>70%, and 158 versus 108 with TBE>70%, for RAxML and FastTree, respectively). Part of the explanation could be that the RAxML tree is more accurate than that of FastTree, and thus better supported. Another factor is that the rapid bootstrap tends to be more supportive than the standard procedure (e.g. 16). Indeed, the rapid bootstrap uses already inferred trees to initiate tree searching, and therefore tends to produce less diverse bootstrap trees than the standard (slower) procedure, which restarts tree searching from the very beginning for each replicate. Despite these differences between FastTree and RAxML with rapid bootstrap, similar conclusions are drawn when comparing FBP and TBE: FBP supports very few deep branches, while TBE supports a larger number of them; TBE is especially useful with large trees; both methods support a very low number of contradicted branches. Comparing the support cut-off, 70% again appears as a good compromise for both FBP and TBE.
Fig. ED4
Fig. ED4. Comparison of FBP and TBE – HIV dataset – FastTree
Both supports are compared regarding branch depth, and tree size (see text and notes to Fig. 1 and 2 for explanations). Three support cut-offs are used to select the branches: 50%, 70%, and 90% (e.g. 1,624 branches among 9,144 have TBE>70% and 1,031 have FBP>70%). Results are mostly similar to those observed with the mammal dataset. Again, we see a major impact of the depth on FBP supports: with the full dataset, less than 1% of the deep (p > 16) branches have FBP support larger than 70%, whereas this percentage is higher than 20% with TBE. The impact of tree size is less pronounced. The fraction of supported branches decreases when the tree size increases from 35 to 571 taxa, but is analogous between 571 and 9,147 taxa. Moreover, the gap between FBP and TBE remains similar, likely due to the very large number of cherries and small clades, where TBE and FBP are nearly equivalent. Regarding the support cut-off, 70% again appears as a good compromise for TBE, though there is no way to evaluate the fraction of supported branches that are actually erroneous. The interpretability of TBE will be a major asset for choosing the support level depending on the phylogenetic question being addressed. Here, as recombinant sequences are inevitable, lower supports than with mammals will likely be acceptable.
Fig. ED5
Fig. ED5. Medium-sized HIV datasets, subtype deep branching
As the taxa were randomly drawn from the full dataset, the supports and findings show some fluctuations. We display the trees obtained with two of the medium-sized datasets in panels (a) and (b); branches with FBP>70%: yellow dots; branches with TBE>70%: blue dots; subtype clades: red stars, filled if support >70% (see Methods and note to Fig. 1 for further details). (c) Deep branching of the subtypes and supports obtained on the full data set (see also Fig. 1). Rare subtypes (H, J, K) are absent in the medium datasets, and the subtype clades are almost perfectly recovered (only 1 wrong taxon in A clade for both trees). FBP supports are higher than with the full dataset (e.g. 58% and 99% for subtype B, versus 3% in Fig. 1). However, some subtype clades have moderate FBP (e.g. D), though the clade matches the subtype perfectly. With TBE, all subtype supports are higher than 95%. The deep branching is the same for all (full, medium) datasets and identical to Hemelaar, but not supported by FBP, while TBE is larger than 70% for every branch (or path in Fig. 1). Again, the Indian and East African sub-epidemics of subtype C are supported by TBE, but not by FBP.
Fig. ED6
Fig. ED6. Distribution of the instability score in HIV recombinants
We see a clear difference between the distributions of the instability score for the recombinant and non-recombinant sequences, meaning that the approach can be used to detect or confirm the recombinant status of sequences (box quantiles: 25%, 50% and 75%). See text for details.
Fig. ED7
Fig. ED7. Comparison of FBP and TBE – Simulated, non-noisy and noisy data
Noisy data include rogue taxa and homoplasy, as opposed to non-noisy data. These graphics display the distribution of branches with FPB/TBE support >70%. Both supports are compared regarding branch depth, tree size, and quartet conflicts with the model tree used for simulations (see text and notes to Fig. 1 and 2 for explanations). Results are fully congruent with those obtained with real datasets. TBE supports more deep branches than FBP, especially with noisy data. The effect of tree size is also more visible with noisy MSA, and the number of supported branches with moderate (]5,20]%) and high (>20%) conflict levels is very low, for both FBP and TBE.
Fig. ED8
Fig. ED8. Comparison of FBP and TBE at different support cut-offs – Simulated, noisy data
Comparison of FBP and TBE regarding branch depth, quartet conflicts, and tree size, at different support cut-offs (see text and notes to Fig. 1 and 2 for explanations). A cut-off of 50% seems to be acceptable, as neither FBP nor TBE support highly contradicted branches. But this could be due to the low level of contradiction, compared to real datasets (85 branches with contradiction >20%, versus ~400 with the mammal dataset in Fig. ED2–ED3).
Fig. ED9
Fig. ED9. Distribution of the instability score in rogue taxa – Simulated, noisy data
TBE again appears to be useful for detecting and confirming rogue taxa (box quantiles: 25%, 50% and 75%). See text for details.
Fig. ED10
Fig. ED10. Repeatability and accuracy of FBP and TBE – Simulated data
The bootstrap theory, indicates that, with large samples, the supports estimated using bootstrap replicates should be close to supports obtained with datasets of the same size drawn from the same distribution as the original sample. We used simulated data to check that this property holds with protein MSAs of 1,449 taxa and ~500 sites (see text for details). Top panels ((a): FBP, (b): TBE) compare these two supports for all branches in the tree inferred by RAxML from the original MSA. We observe a clear correlation, which is higher for TBE (ρ = 0.85) than for FBP (ρ = 0.75) using Pearson’s linear correlation coefficient, but identical (0.83) using Spearman’s rank coefficient, which is better suited to the discontinuous nature of FBP. These results appear to contradict those of Hillis and Bull who concluded that the bootstrap is a highly imprecise measure of repeatability. However, they measured the probability to infer the correct tree (not the supports of inferred branches, as consistent in the bootstrap context), and their main result was based on 50 sites, which is likely too low for the bootstrap theory to apply. The bootstrap also relies on the plug-in principle,,, stating that the distribution of the distance between the true tree and the inferred tree can be well-approximated by the distribution of the distance between the inferred and bootstrap trees. Panel (c) measures for every branch b inferred by RAxML from the original MSA, the accuracy of TBE in predicting the topological distance between b and the true tree, as measured using the normalized transfer index. Again, we observe a clear correlation (ρ = 0.74, Spearman’s = 0.70). We performed the same experiment with FBP, seeking to predict the presence/absence (1/0) of the inferred branch in the tree true; a lower but still significant correlation was found (ρ = 0.59, Spearman’s = 0.54). Panel (d) compares using RAxML the performance of simulation-based and bootstrap-based instability scores in detecting rogue taxa; both are nearly identical (TPR: true positive rate; FPR: false positive rate). Table (e) summarizes the results described above, and those of FastTree, which are nearly identical to those of RAxML, except regarding topological accuracy (%correct: fraction of correct branches), where RAxML is again more accurate than FastTree.
Fig. 1
Fig. 1. Felsenstein (FBP) and transfer (TBE) bootstrap supports on the same tree with 9,147 HIV-1M pol sequences
(a): FBP; (b): TBE. Subtypes are colorized; recombinant sequences are black; dots correspond to branches with support >70%. Supports are given for the tree clades that are closer to the subtypes (red stars, filled when support >70%); for each of these clades we provide, using jpHMM predictions, the number of wrong (w) taxa that do not belong to the corresponding subtype, and the number of missing (m) taxa that belong to the subtype but not to the clade. For the C and the H, these clades are not supported by FBP, but there exist neighbouring clades with FBP >70%, and these are shown in brackets. The same approach is applied to the C sub-epidemics in India (IND) and Eastern Africa (EA); the ratio provides the coverage of the clade, i.e. the number of studied (e.g. Indian) taxa in the clade versus the total number of those taxa in the dataset. The South American clade (SA, not shown, included in EA) is supported by TBE but not by FBP (73% vs. 14%, 15 taxa, 14/14). The histograms provide the number of branches with support >70% depending on branch depth, which is measured by the number of taxa in the smaller of the two clades defined by the given branch.
Fig. 2
Fig. 2. Felsenstein (FBP) and transfer (TBE) bootstrap supports with 1,449 COI-5P mammal sequences – FastTree phylogeny
Graphs (a) to (d) refer to branches with supports >70%, with the vertical axis denoting the percentage of these branches in a given condition (e.g. (b): 19 internal branches with 22-taxon trees, and 2/19 ≈ 10% of branches with FBP >70%). (a) Supports regarding branch depth (see note to Fig. 1). (b) Supports regarding tree size (i.e. number of taxa). (c) Supports regarding percentage of quartet conflicts with NCBI taxonomy (≤5%: low conflict level;] 5,20]% moderate; ≥20%: high). (d) Same as (c) but regarding the true tree used for simulations.
Fig. 3
Fig. 3. Felsenstein (FBP) and transfer (TBE) bootstrap supports – FastTree phylogeny using 1,449 COI-5P mammal sequences – Focus on the simian clade
All simian sequences are included, but two additional non-simian sequences are added, one rogue taxon (Maxomys rajah, detected by TBE, see text) and one stable but erroneous taxon with partial sequence (Canis adustus); this simian tree is very close to the NCBI taxonomy (<2.5% of contradicted quartets, when both erroneous taxa are pruned).
Fig. 4
Fig. 4. Felsenstein (FBP) and transfer (TBE) supports on the same tree with 1,449 COI-5P mammal sequences – RAxML with rapid bootstrap
(a): FBP; (b): TBE. This phylogeny is more accurate than the one by FastTree (27% versus 38% of contradicted quartets, respectively), but still relatively poor, especially regarding deep nodes and larger groups. For example, rodents and chiropters are not monophyletic and are distributed in several subtrees. However, some parts of the tree are more accurate. A few clades are highlighted, corresponding (almost) exactly to the NCBI taxonomy. For example, all elephantidae taxa are recovered by RAxML in a single clade, containing elephantidae only, while insectivores are included in a clade containing one extra taxon. To select these clades, we minimized the transfer distance with the NCBI taxonomy, in case of ambiguity. See note to Fig. 1 and Methods for details.

References

    1. Efron B. Bootstrap Methods: Another Look at the Jackknife. Ann. Stat. 1979;7:1–26.
    1. Efron B, Tibshirani RJ. An introduction to the bootstrap. Chapman & Hall, NY; 1993.
    1. Felsenstein J. Confidence limits on phylogenies: an approach using the bootstrap. Evolution. 1985;39:783–791. - PubMed
    1. Van Noorden R, Maher B, Nuzzo R. The top 100 papers. Nature. 2014;514:550–553. - PubMed
    1. Sanderson MJ. Objections to bootstrapping phylogenies: A critique. Syst. Biol. 1995;44:299–320.

Publication types

MeSH terms

Substances