. 2018 Apr 4:9:203.
doi: 10.3389/fneur.2018.00203. eCollection 2018.

The Dynamics of Concussion: Mapping Pathophysiology, Persistence, and Recovery With Causal-Loop Diagramming

Affiliations

The Dynamics of Concussion: Mapping Pathophysiology, Persistence, and Recovery With Causal-Loop Diagramming

Erin S Kenzie et al. Front Neurol. .

Abstract

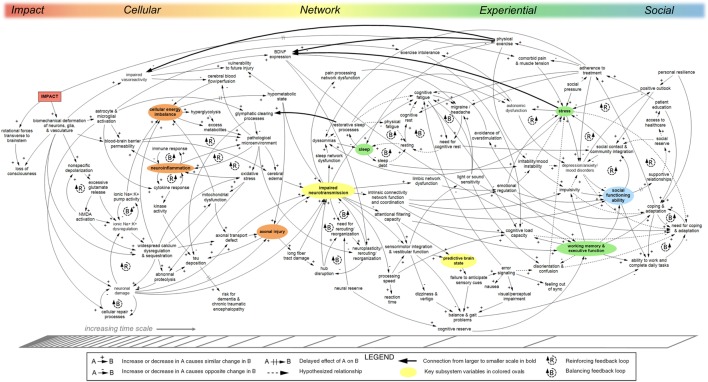
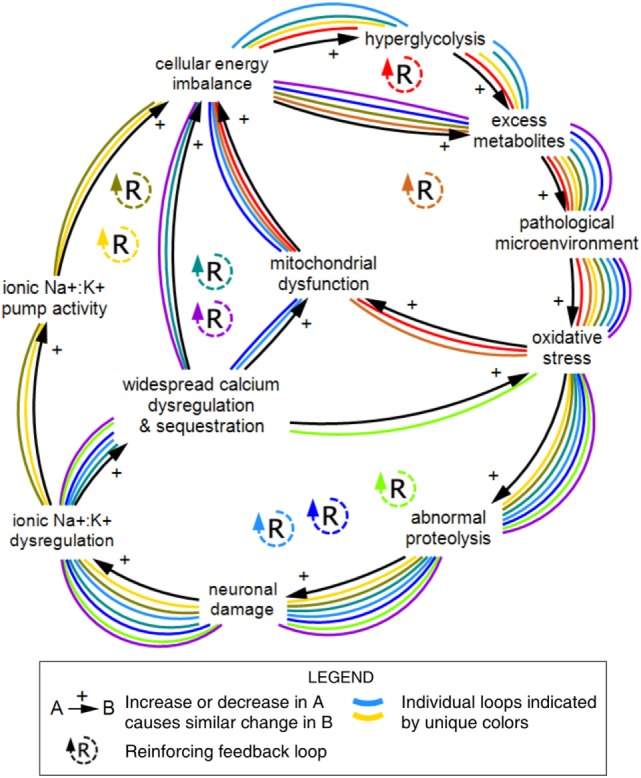
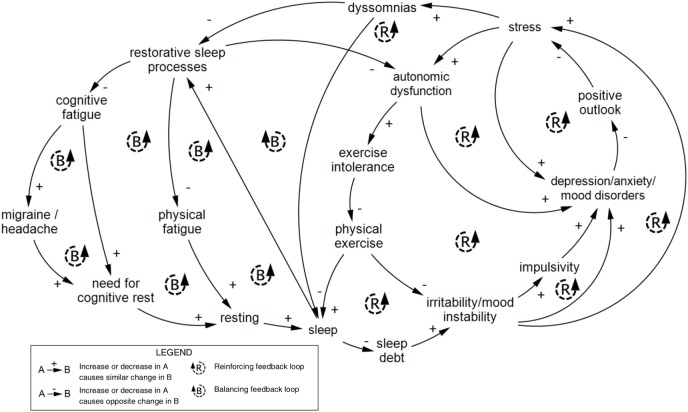
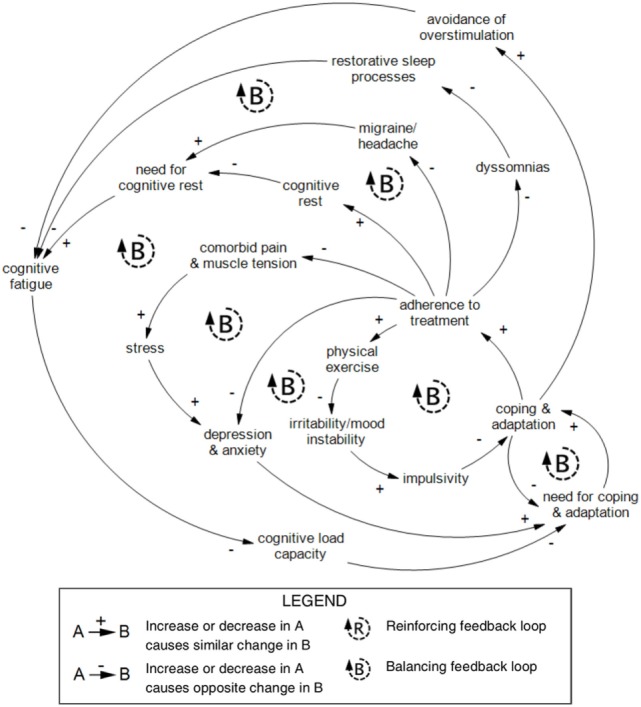
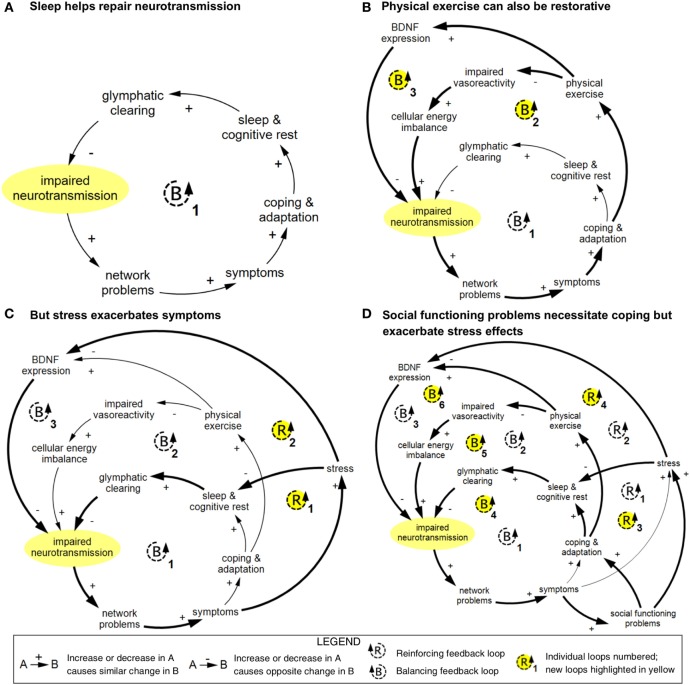
Despite increasing public awareness and a growing body of literature on the subject of concussion, or mild traumatic brain injury, an urgent need still exists for reliable diagnostic measures, clinical care guidelines, and effective treatments for the condition. Complexity and heterogeneity complicate research efforts and indicate the need for innovative approaches to synthesize current knowledge in order to improve clinical outcomes. Methods from the interdisciplinary field of systems science, including models of complex systems, have been increasingly applied to biomedical applications and show promise for generating insight for traumatic brain injury. The current study uses causal-loop diagramming to visualize relationships between factors influencing the pathophysiology and recovery trajectories of concussive injury, including persistence of symptoms and deficits. The primary output is a series of preliminary systems maps detailing feedback loops, intrinsic dynamics, exogenous drivers, and hubs across several scales, from micro-level cellular processes to social influences. Key system features, such as the role of specific restorative feedback processes and cross-scale connections, are examined and discussed in the context of recovery trajectories. This systems approach integrates research findings across disciplines and allows components to be considered in relation to larger system influences, which enables the identification of research gaps, supports classification efforts, and provides a framework for interdisciplinary collaboration and communication-all strides that would benefit diagnosis, prognosis, and treatment in the clinic.

Keywords: causal-loop diagram; complexity; concussion; models of injury; recovery; systems medicine; systems science; traumatic brain injury.


Figures

Figure 1
Figure 1
Causal-loop diagram (CLD) of concussion pathophysiology, persistence, and recovery. The model shows causal relationships between factors influencing recovery from impact concussion. Reinforcing feedback loops characterized by exponential growth or decline are indicated with R-loop symbols; balancing feedback loops for repair, replenishing, or homeostatic processes that strive to move the systems toward a set point are indicated with B-loop symbols. Hash marks across an arrow indicate a significant delay. Approximate organization across biological scales is shown on the top axis; change in time scale is indicated on the bottom axis. Key indicator variables representative of subsections of the model are shown in colors corresponding to the top axis. Solid arrows indicate relationships identified in the literature. Relationships not supported directly by published literature are shown with dotted arrows. “Downscale” connections linking variables at larger scales to variables at smaller scales are indicated in bold. The model was developed qualitatively based on iterative review of relevant literature, expert interviews, and expert review. A web-based interactive version of this diagram can be found at www.dynamicsofconcussion.com. Supporting documentation can be found in the Evidence Table (Table S2 in Supplementary Material). Diagram rendered in MapSys (Simtegra Version 4.0).
Figure 2
Figure 2
Interactions between intrinsic connectivity networks. The default-mode network (DMN) (64) is a highly coordinated network of hubs throughout the brain connected by long-range white matter tracts. The DMN is thought to be activated while an individual is at rest, and deactivated during goal-directed tasks (although there is some evidence that external tasks requiring social working memory may engage the DMN). In general, however, the DMN and other resting-state networks are deactivated once an individual begins task processing associated with external stimuli. Operating as a dynamic switch, the salience network deactivates the DMN and activates the central executive network, or vice versa. Successful switching between networks requires sensitivity to contextual demands, integration of multiple sources of information, and rapid appraisal, all of which are compromised with impaired or slowed neurotransmission. The dependence of such networks on long-range white matter tracts renders them particularly susceptible to the types of cellular insult observed in concussion.
Figure 3
Figure 3
Examples of reinforcing and balancing feedback. Panel (A) shows a reinforcing feedback loop and a corresponding graph of exponentially increasing behavior over time. Panel (B) shows a balancing feedback loop and a corresponding graph of decreasing behavior over time toward an internal set point, based on ionic pump activity attenuating ionic dysregulation. Reinforcing and balancing feedback are the two types of feedback loops found in complex systems.
Figure 4
Figure 4
Within-scale and cross-scale feedback loops. Generic feedback loops are shown across four scales of organization relevant to concussion pathophysiology and recovery. Some loops occur within a given scale, and others span multiple scales.
Figure 5
Figure 5
Nine feedback loops within the cellular scale of concussion. A series of reinforcing loops across the metabolic, ionic, and neuronal subsystems demonstrate the large number of feedback relationships that emerge from connections between a relatively small number of variables. The reinforcing structure of these relationships indicates compounding effects over time. Individual feedback loops are marked with unique colors. Diagram rendered in MapSys.
Figure 6
Figure 6
Feedback loops within the experiential scale of concussion. A series of nested feedback loops across the sleep/fatigue, autonomic, mood, and stress subsystems within the experiential scale are shown to illustrate the interconnectedness of variables across subsystems. This series of loops was reproduced from Figure 1. Diagram rendered in MapSys.
Figure 7
Figure 7
Balancing loops related to coping and adaptation within the experiential scale in recovery from concussion. This series of nested balancing feedback loops was reproduced from Figure 1. A core loop distinguishes coping and adaptation from the need for coping and adaptation. Coping and adaptation lead to two behaviors: avoidance of overstimulation and adherence to treatment. Avoidance of overstimulation reduces cognitive fatigue. Access and quality of medical treatment and advice will vary between cases, but targeted treatments may be prescribed by a clinician to increase cognitive rest or reduce migraine/headache, cognitive fatigue, comorbid pain and muscle tension, stress, depression and anxiety, irritability/mood instability, and impulsivity. Diagram rendered in MapSys.
Figure 8
Figure 8
Simplified cross-scale feedback loops pertaining to impaired neurotransmission. These diagrams depict abbreviated versions of feedback loops described in Figure 1 and demonstrate how connected loops can have compounding and counteractive effects. (A) In loop B1, impaired neurotransmission affects the function of networks; these networks and network functions include limbic, intrinsic connectivity networks, attentional filtering, and processing speed. Disruption in these networks results in a range of symptoms included in Figure 1 (specifically, light or sound sensitivity, impairment in emotional regulation, impulsivity, irritability/mood instability, stress, depression/anxiety/mood disorders, reduced social functioning, impaired working memory and executive function, reduced cognitive load capacity, dizziness and vertigo, balance and gait problems, impaired prediction of sensory input, visual/perceptual impairment, disorientation and confusion, and reduced ability to work and complete daily tasks). Either directly or indirectly, these symptoms prompt coping and adaptation strategies, including avoidance of overstimulation, pursuit of and adherence to treatment, cognitive rest, and addressing of sleep problems. Restorative sleep processes lead to glymphatic clearing of brain waste and energy byproducts, which in turn results in improved neurotransmission via an improved cellular milieu and support of neuroplasticity. (B) In loop B2, physical exercise is used as a coping and adaptation strategy, which improves vasoreactivity and cellular energy imbalance, which supports neurotransmission. In loop B3, brain-derived neutrophic factor (BDNF) expression is strengthened, which reduces impaired neurotransmission via improved neuroplasticity. (C) Stress can disrupt sleep and inhibit BDNF expression, which creates two reinforcing loops. (D) Social functioning problems can prompt coping and adaptation, which introduces three additional balancing loops, and increase stress, which compounds the reinforcing effects of stress. Diagrams rendered in MapSys.
Figure 9
Figure 9
Shifting loop dominance evidenced in trajectory of symptoms over time. This hypothetical graph of symptom severity over time demonstrates a pattern of shifting dominance of interlinked feedback loops. In the scenario, the patient is injured at t = 0 and experiences a decreasing severity of symptoms. During this time (indicated by the first blue phase), balancing feedback is dominant. After a stressful life event, symptoms exponentially increase, meaning that reinforcing loops are dominant. Shortly after beginning treatment, balancing processes again dominate, indicated by the second blue phase. This sample recovery trajectory illustrates how feedback structure can cause nonlinear behavior of different types throughout recovery.

Similar articles

Cited by

References

    1. McCrory P, Meeuwisse W, Dvořák J, Aubry M, Bailes J, Broglio S, et al. Consensus statement on concussion in sport—the 5th International conference on concussion in sport held in Berlin. Br J Sports Med (2017) 51(11):838–47.10.1136/bjsports-2017-097878 - DOI - PubMed
    1. Raskin SA, Lovejoy DW, Stevens MC, Zamroziewicz M, Oakes HJ. Mild traumatic brain injury. In: Levin HS, Shum DHK, Chan RCK, editors. Understanding Traumatic Brain Injury: Current Research and Future Directions. New York: Oxford University Press; (2014). p. 370–412.
    1. Katz DI, Cohen SI, Alexander MP. Mild traumatic brain injury. Handb Clin Neurol (2015) 127:131–56.10.1016/B978-0-444-52892-6.00009-X - DOI - PubMed
    1. Hawryluk GWJ, Bullock MR. Design of acute neuroprotection studies. Handb Clin Neurol (2015) 128:761–78.10.1016/B978-0-444-63521-1.00047-9 - DOI - PubMed
    1. Hiploylee C, Dufort PA, Davis HS, Wennberg RA, Tartaglia MC, Mikulis D, et al. longitudinal study of postconcussion syndrome: not everyone recovers. J Neurotrauma (2017) 34(8):1511–23.10.1089/neu.2016.4677 - DOI - PMC - PubMed

LinkOut - more resources