. 2018 Apr 4:9:601.
doi: 10.3389/fmicb.2018.00601. eCollection 2018.

A New Age-Structured Multiscale Model of the Hepatitis C Virus Life-Cycle During Infection and Therapy With Direct-Acting Antiviral Agents

Affiliations

A New Age-Structured Multiscale Model of the Hepatitis C Virus Life-Cycle During Infection and Therapy With Direct-Acting Antiviral Agents

Barbara de M Quintela et al. Front Microbiol. .

Abstract

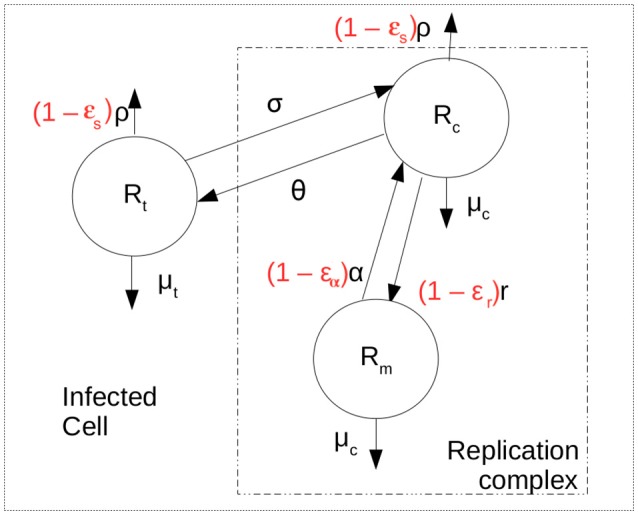
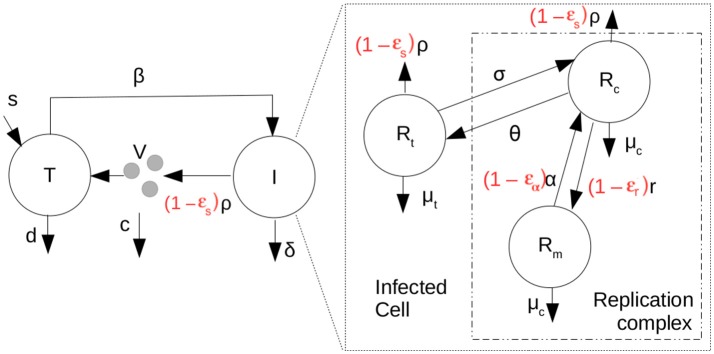
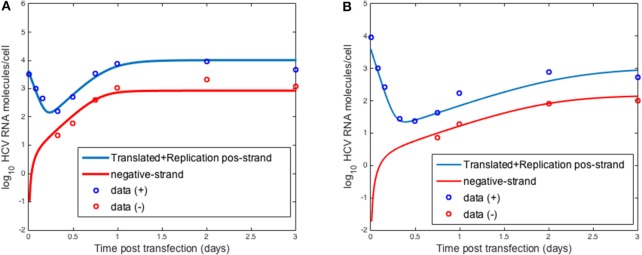
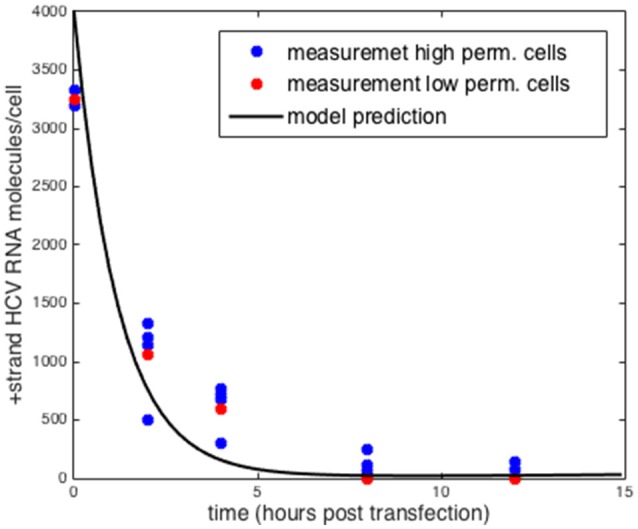
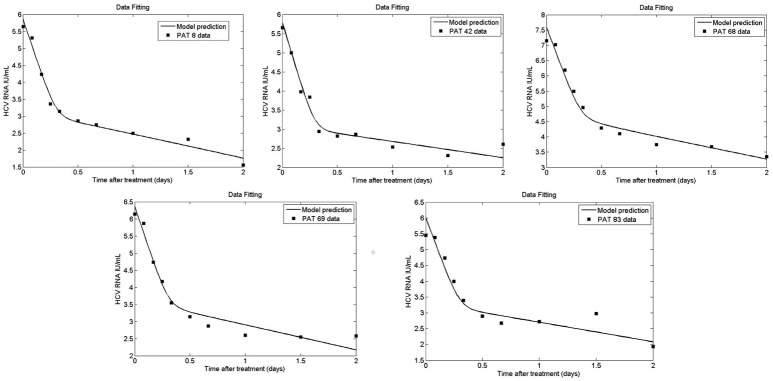
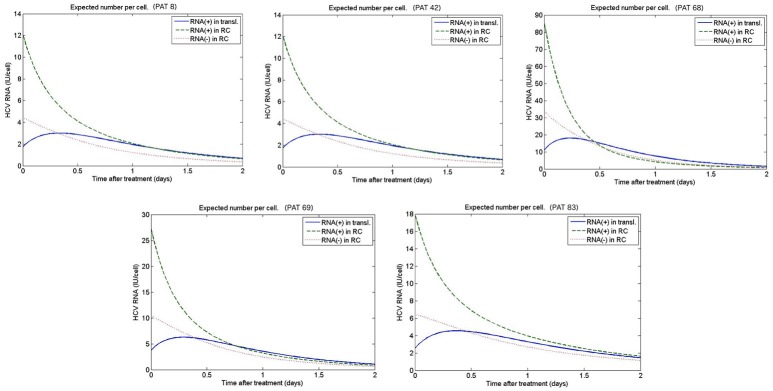
The dynamics of hepatitis C virus (HCV) RNA during translation and replication within infected cells were added to a previous age-structured multiscale mathematical model of HCV infection and treatment. The model allows the study of the dynamics of HCV RNA inside infected cells as well as the release of virus from infected cells and the dynamics of subsequent new cell infections. The model was used to fit in vitro data and estimate parameters characterizing HCV replication. This is the first model to our knowledge to consider both positive and negative strands of HCV RNA with an age-structured multiscale modeling approach. Using this model we also studied the effects of direct-acting antiviral agents (DAAs) in blocking HCV RNA intracellular replication and the release of new virions and fit the model to in vivo data obtained from HCV-infected subjects under therapy.

Keywords: DAAs; HCV; RNA; computational biology; differential equations.


Figures

Figure 1
Figure 1
Intracellular model scheme. After cell entry positive strand HCV RNA is available for translation, represented by Rt. It can be exported at rate ρ and decay at rate μt. Negative or minus strand HCV RNA (Rm) is produced at maximum rate r and forms the replication complexes that produce more positive strand RNA (Rc) at rate α. It is assumed that HCV RNA inside the replication complex in both orientations have the same decay rate μc. The positive strand HCV RNA available for translation is assumed to move into replication complexes at rate σ and from replication complexes at rate θ. The terms in red represent the action of therapy in blocking secretion and production of viral RNA.
Figure 2
Figure 2
Scheme representing the coupled multiscale model with therapy (parameters in red). T are target cells, I, infected cells and V, the HCV RNA concentration in plasma. Target cells become infected at rate β.
Figure 3
Figure 3
HCV RNA replication. Circles represent experimental data from Binder et al. (2013) and lines show the results obtained with the model described herein with distinct sets of parameters for (A) high and (B) low permissive cells.
Figure 4
Figure 4
Comparison to measurements of replication deficient HCV RNA in high and low permissive cells. Model prediction setting σ = 0 for both sets of parameters. Data taken from Binder et al. (2013).
Figure 5
Figure 5
Sensitivity analysis of the model at 72 h. The positive-strand RNA replication rate, α, the natural decay rates for positive-strand RNA used for translation and within replication complexes, μt and μc, repectively and the rate at which positive-strand RNA goes from replication complexes to the cytoplasm to be translated, θ, are the most sensitive parameters in the model.
Figure 6
Figure 6
Comparison of model results to in vitro infection data. Data points were extracted from Keum et al. (2012) and the lines were obtained by fitting the intracellular model to the data where we assumed the measured positive strands were the sum of the positive strands used for translation, Rt and in replication complexes, Rc. As before we fixed the export rate with ρ = 0.1 d−1, τ = 0.5 d−1, and k = 0.8 d−1. The initial time t0 = 0. Based on the data we set Rt0 = 12.8. Other parameters were estimated and were found to be α = 30 d−1, μt = 24 d−1, r = 3.18 d−1, μc = 1.05 d−1, Rmax = 100 molecules, σ = 0.1 d−1 and θ = 1.2 d−1.
Figure 7
Figure 7
Secreted HCV RNA. Data points from Keum et al. (2012) and lines are the model prediction based on Equation (1).
Figure 8
Figure 8
Sensitivity analysis of the model at 2 days. The figure shows how much a perturbation of the parameters influence the viral load (V).
Figure 9
Figure 9
Fit of coupled multiscale model (solid line) to patient viral load data (squares) from Guedj et al. (2013). All 5 patients were treated with one dose of 10 or 100 mg of daclatasvir. The best-fit parameters are shown in Table 2.
Figure 10
Figure 10
Predicted intracellular HCV RNA obtained from fitting the patient data from Guedj et al. (2013). The best-fit parameters are shown in Table 2.

References

    1. Adiwijaya B. S., Hare B., Caron P. R., Randle J. C., Neumann A. U., Reesink H. W., et al. (2009). Rapid decrease of wild-type hepatitis C virus on telaprevir treatment. Antivir. Ther. 14, 591–595. Available online at: https://www.intmedpress.com/journals/avt/abstract.cfm?id=23&pid=88 - PubMed
    1. Afzal M. S., Alsaleh K., Farhat R., Belouzard S., Danneels A., Descamps V., et al. (2015). Regulation of core expression during the hepatitis C virus life cycle. J. Gen. Virol. 96, 311–321. 10.1099/vir.0.070433-0 - DOI - PubMed
    1. Appel N., Schaller T., Penin F., Bartenschlager R. (2006). From structure to function: new insights into hepatitis C virus RNA replication. J. Biol. Chem. 281, 9833–9836. 10.1074/jbc.R500026200 - DOI - PubMed
    1. Beck A. (2014). Introduction to Nonlinear Optimization: Theory, Algorithms, and Applications with MATLAB, Vol. 19 (Siam). Natick, MA: The MathWorks, Inc.
    1. Benzine T., Brandt R., Lovell W. C., Yamane D., Neddermann P., de Francesco R., et al. (2017). NS5A inhibitors unmask differences in functional replicase complex half-life between different hepatitis C virus strains. PLoS Pathog. 13:e1006343. 10.1371/journal.ppat.1006343 - DOI - PMC - PubMed

LinkOut - more resources