. 2018 Feb 19:2018:7357162.
doi: 10.1155/2018/7357162. eCollection 2018.

Cathelicidin LL-37 Affects Surface and Intracellular Toll-Like Receptor Expression in Tissue Mast Cells

Affiliations

Cathelicidin LL-37 Affects Surface and Intracellular Toll-Like Receptor Expression in Tissue Mast Cells

Justyna Agier et al. J Immunol Res. .

Abstract

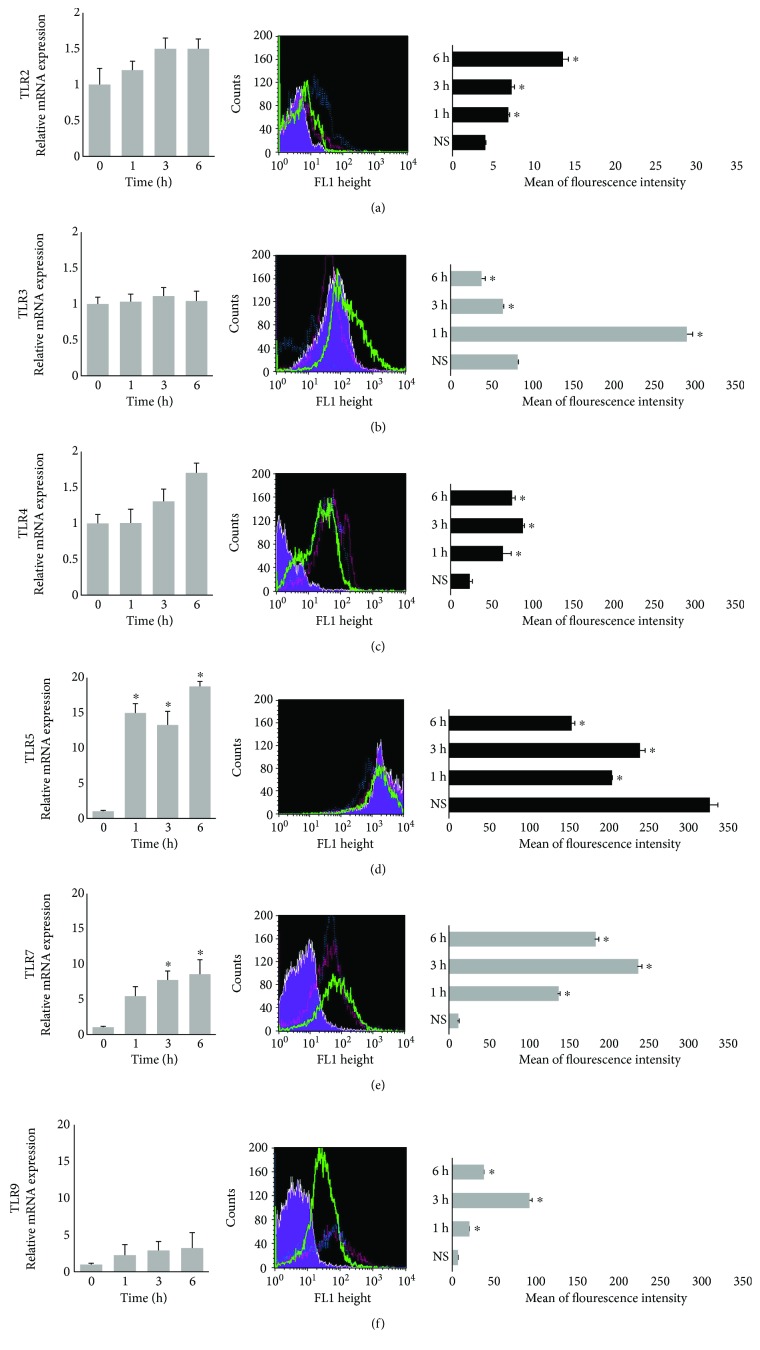
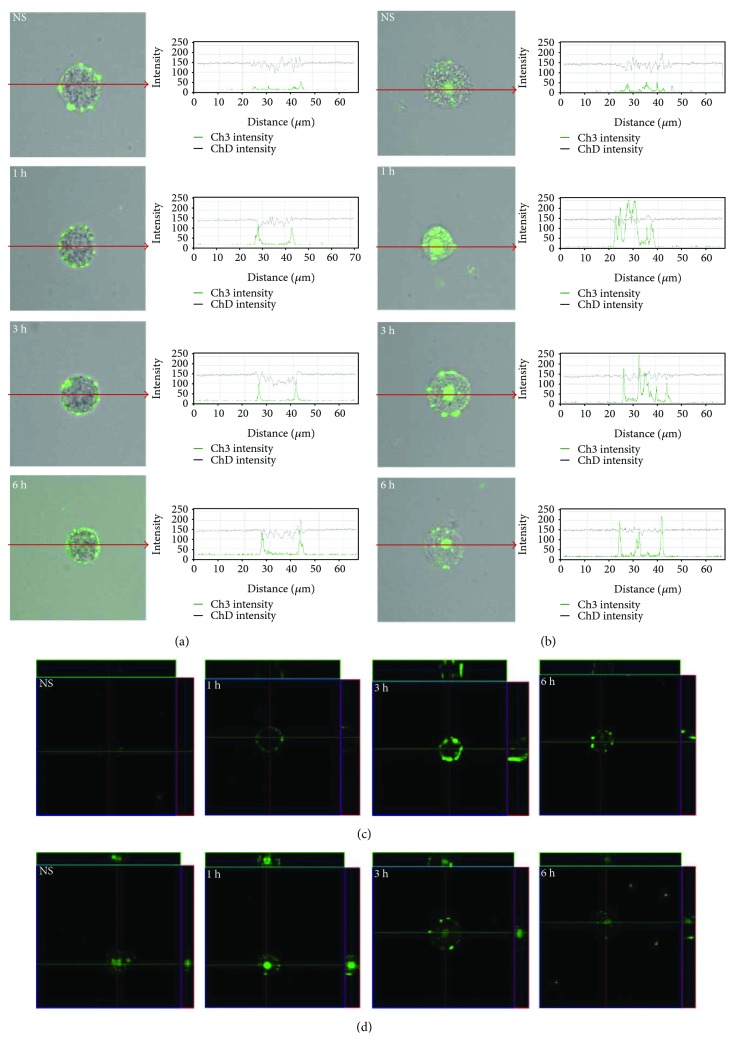
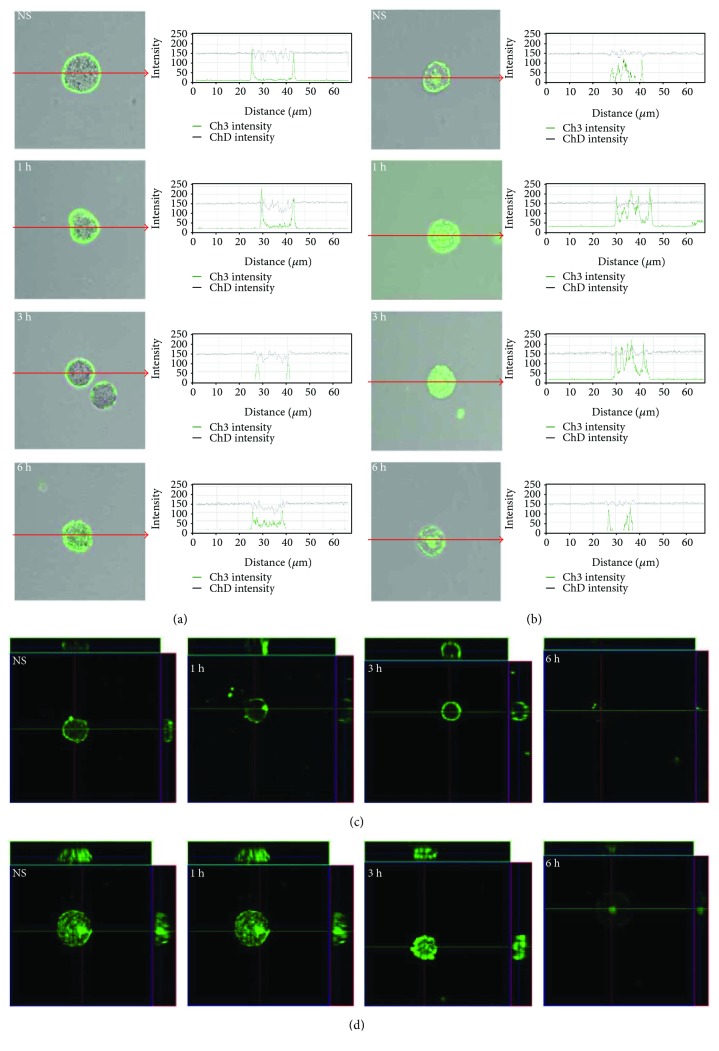
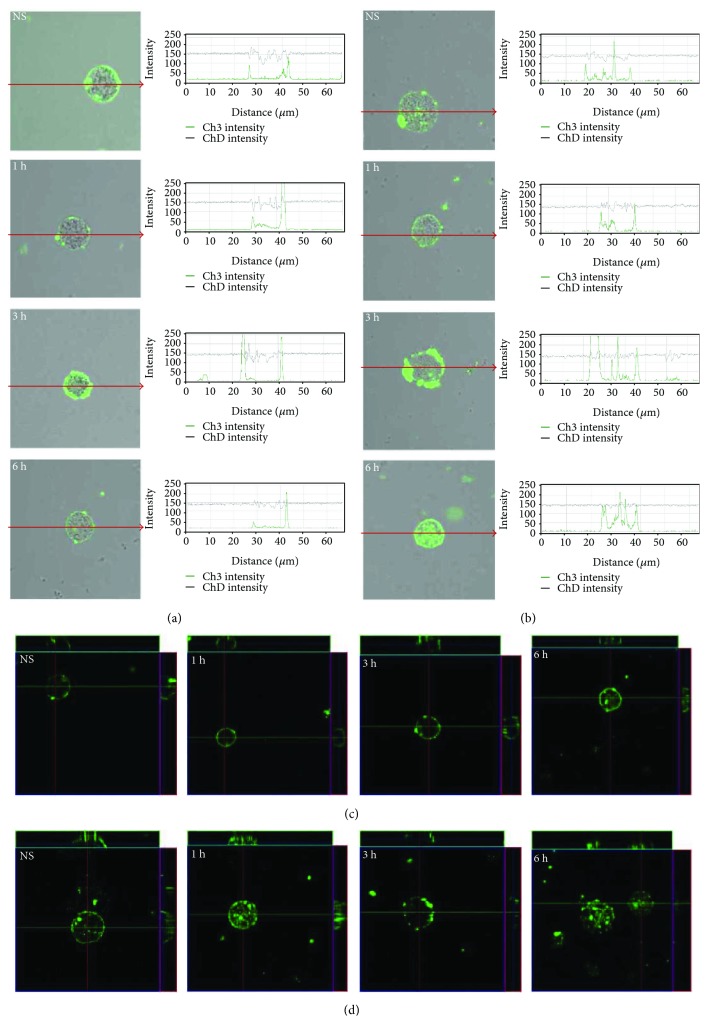
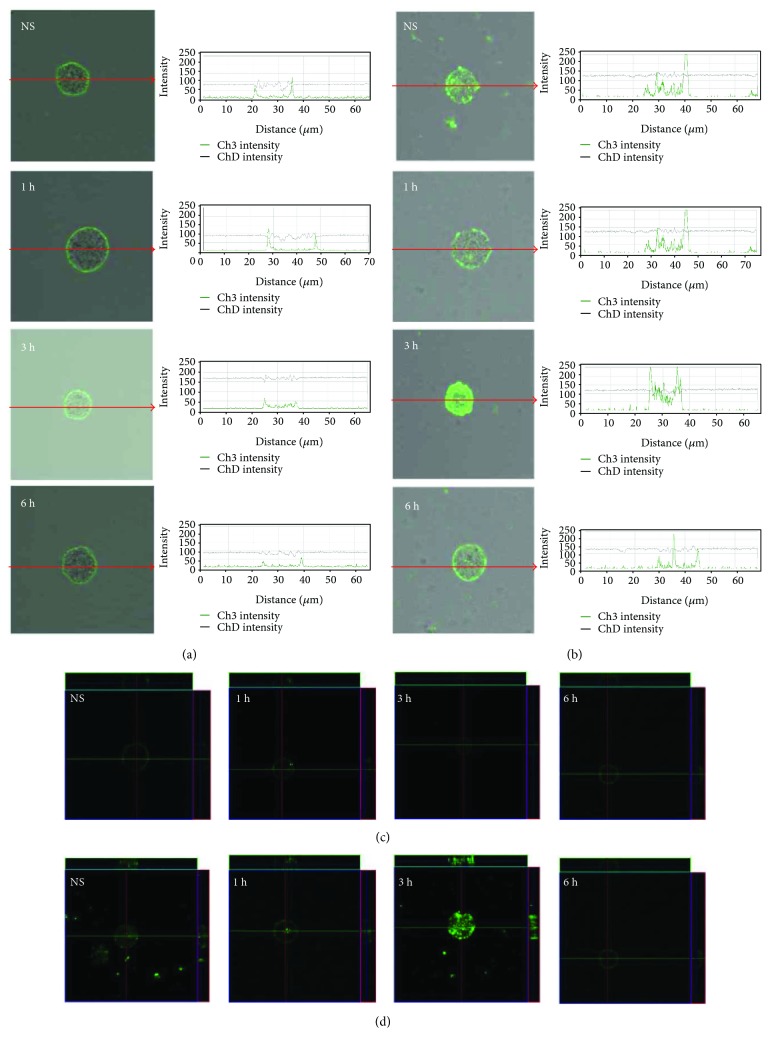
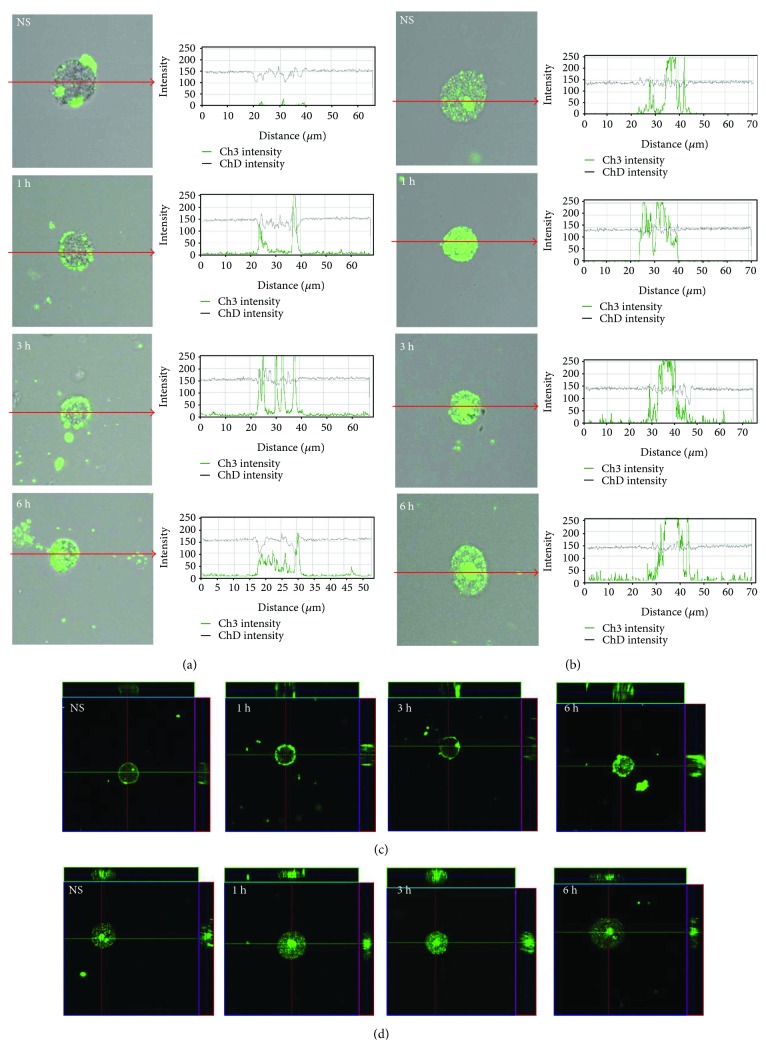
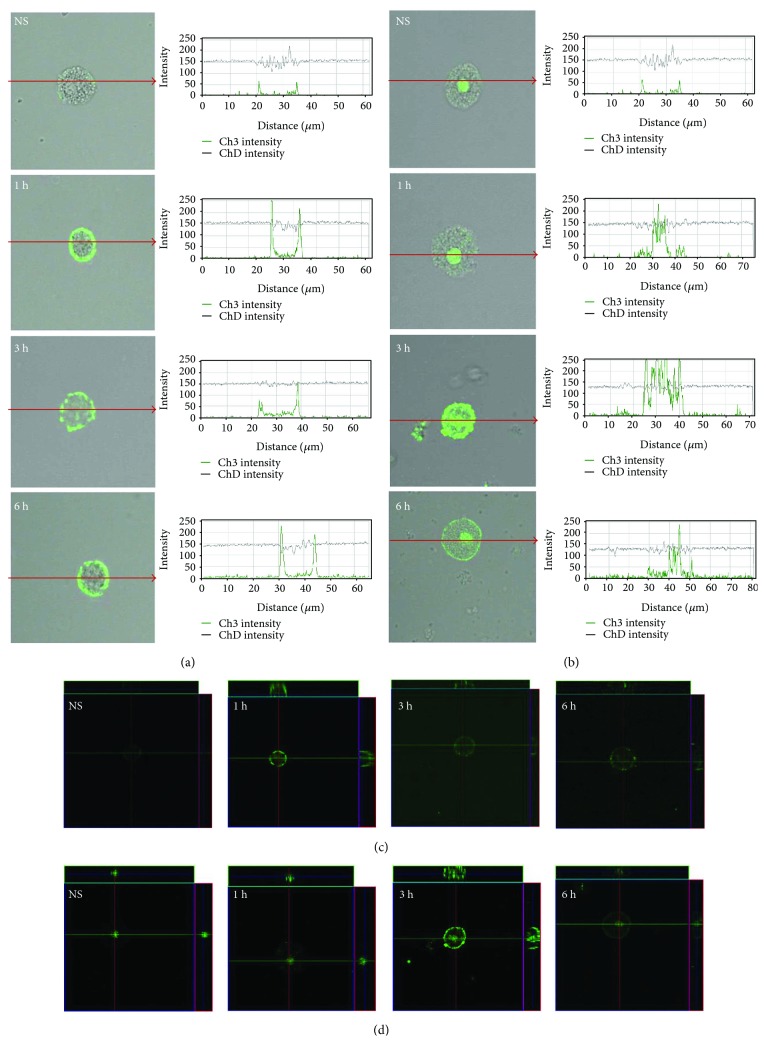
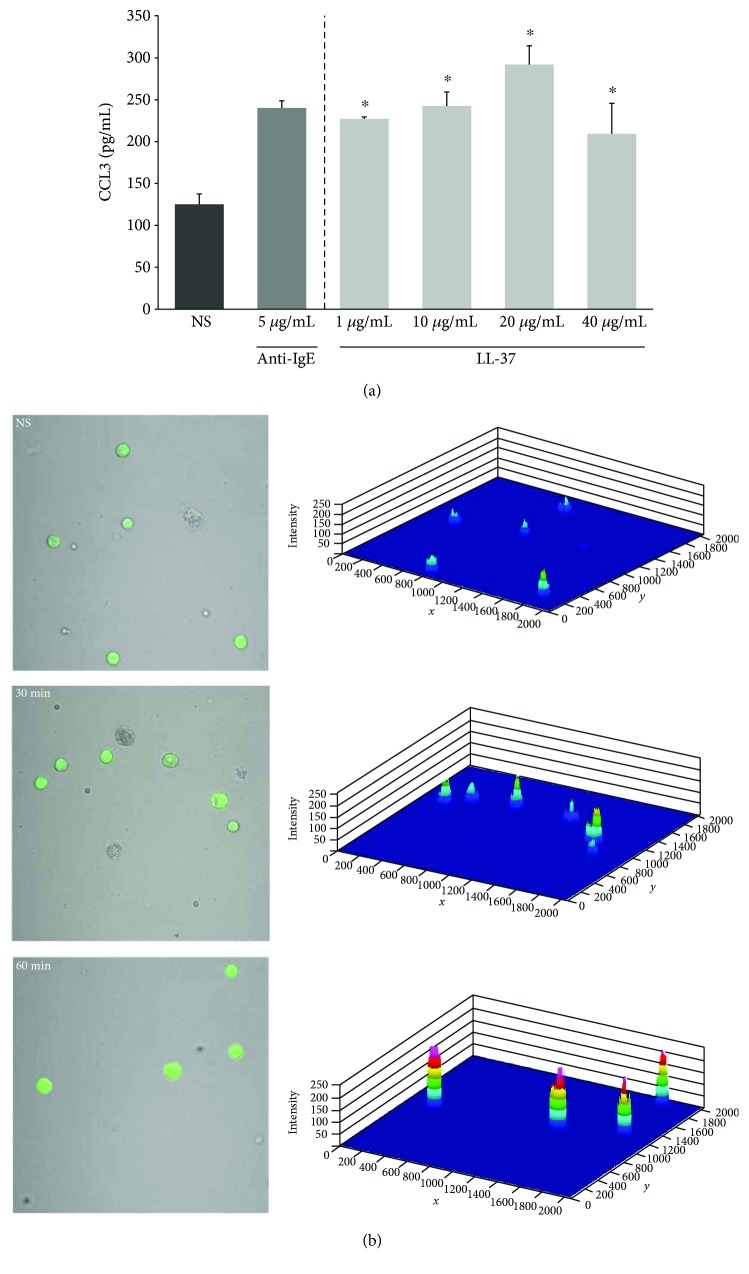
Undoubtedly, mast cells take part in host defense against microorganisms as they are numerous at the portal of infection, they release many proinflammatory and antimicrobial mediators, and they express pattern recognition receptors, such as TLRs. These receptors play a key role in recognition and binding molecules associated with microorganisms and molecules associated with damage. Cathelicidins exhibit direct antimicrobial activities against a broad spectrum of microbes by perturbing their cell membranes. Accumulating evidence suggests a role for these molecules in supporting cell activation. We examined the impact of human cathelicidin LL-37 on tissue mast cell TLR expression and distribution. Depending on context, we show that LL-37 stimulation resulted in minor to major effects on TLR2, TLR3, TLR4, TLR5, TLR7, and TLR9 expression. Confocal microscopy analysis showed that, upon stimulation, TLRs may translocate from the cell interior to the surface and conversely. FPR2 and EGFR inhibitors reduced the increase in expression of selected receptors. We also established that LL-37 acts as a powerful inducer of CCL3 and ROS generation. These results showed that in response to LL-37, mast cells enhance the capability to detect invading pathogens by modulation of TLR expression in what may be involved FPR2 or EGFR molecules.


Figures

Figure 1
Figure 1
mRNA and protein levels of (a) TLR2, (b) TLR3, (c) TLR4, (d) TLR5, (e) TLR7, and (f) TLR9 in resting and LL-37-stimulated mast cells. Mast cells were incubated with LL-37 at a final concentration of 1 μg/mL or medium alone (nonstimulated (NS)) for 1 h, 3 h, or 6 h. Left panel: TLR mRNAs expression was assessed using qRT-PCR. The expression of receptor mRNAs was corrected by normalization based on the transcript level of the housekeeping gene rat Actb. Results are the mean ± SD of three experiments performed in duplicate (n = 6). Middle panel: TLR protein expression assessed by flow cytometry. The results shown are representative of three independent experiments. Shaded tracings: TLRs expression in nonstimulated cells; open tracings: TLRs expression in cells after LL-37 stimulation for 1 h (green), 3 h (red), and 6 h (violet). Right panel: flow cytometry analysis of surface (s) TLR2, intracellular (i) TLR3, sTLR4, sTLR5, iTLR7, and iTLR9 expression. The data represent the mean of fluorescent intensity ± SD of three experiments performed in duplicate (n = 6). Comparisons between groups were carried out by using Student's t-test for small groups. Differences were considered significant at P < 0.05 and are labeled with an asterisk (∗) on each graph.
Figure 2
Figure 2
Effect of LL-37 stimulation on TLR2 expression in mast cells. Mast cells were incubated with LL-37 at a final concentration of 1 μg/mL or medium alone (NS) for 1 h, 3 h, or 6 h. Representative images showing TLR2 cellular localization analyzed by confocal microscopy in (a, c) non- and (b, d) permeabilized cells. Single confocal sections (midsection of cells) reveal the surface and intracellular presence of TLR2. The signal was visualized with green Alexa 488. Fluorescence intensity diagrams showing the distribution of fluorescence in cells were mounted.
Figure 3
Figure 3
Effect of LL-37 stimulation on TLR3 expression in mast cells. Mast cells were incubated with LL-37 at a final concentration of 1 μg/mL or medium alone (NS) for 1 h, 3 h, or 6 h. Representative images showing TLR3 cellular localization analyzed by confocal microscopy in (a, c) non- and (b, d) permeabilized cells. Single confocal sections (midsection of cells) reveal the surface and intracellular presence of TLR3. The signal was visualized with green Alexa 488. Fluorescence intensity diagrams showing the distribution of fluorescence in cells were mounted.
Figure 4
Figure 4
Effect of LL-37 stimulation on TLR4 expression in mast cells. Mast cells were incubated with LL-37 at a final concentration of 1 μg/mL or medium alone (NS) for 1 h, 3 h, or 6 h. Representative images showing TLR4 cellular localization analyzed by confocal microscopy in (a, c) non- and (b, d) permeabilized cells. Single confocal sections (midsection of cells) reveal the surface and intracellular presence of TLR4. The signal was visualized with green Alexa 488. Fluorescence intensity diagrams showing the distribution of fluorescence in cells were mounted.
Figure 5
Figure 5
Effect of LL-37 stimulation on TLR5 expression in mast cells. Mast cells were incubated with LL-37 at a final concentration of 1 μg/mL or medium alone (NS) for 1 h, 3 h, or 6 h. Representative images showing TLR5 cellular localization analyzed by confocal microscopy in (a, c) non- and (b, d) permeabilized cells. Single confocal sections (midsection of cells) reveal the surface and intracellular presence of TLR5. The signal was visualized with green Alexa 488. Fluorescence intensity diagrams showing the distribution of fluorescence in cells were mounted.
Figure 6
Figure 6
Effect of LL-37 stimulation on TLR7 expression in mast cells. Mast cells were incubated with LL-37 at a final concentration of 1 μg/mL or medium alone (NS) for 1 h, 3 h, or 6 h. Representative images showing TLR7 cellular localization analyzed by confocal microscopy in (a, c) non- and (b, d) permeabilized cells. Single confocal sections (midsection of cells) reveal the surface and intracellular presence of TLR7. The signal was visualized with green Alexa 488. Fluorescence intensity diagrams showing the distribution of fluorescence in cells were mounted.
Figure 7
Figure 7
Effect of LL-37 stimulation on TLR9 expression in mast cells. Mast cells were incubated with LL-37 at a final concentration of 1 μg/mL or medium alone (NS) for 1 h, 3 h, or 6 h. Representative images showing TLR9 cellular localization analyzed by confocal microscopy in (a, c) non- and (b, d) permeabilized cells. Single confocal sections (midsection of cells) reveal the surface and intracellular presence of TLR9. The signal was visualized with green Alexa 488. Fluorescence intensity diagrams showing the distribution of fluorescence in cells were mounted.
Figure 8
Figure 8
Effect of LL-37 on (a) CCL3 and (b) ROS production. For CCL3 measurement, mast cells were incubated with different concentrations of LL-37, anti-IgE at 5 μg/mL (positive control), or medium alone (NS) for 2 h. Results are the mean ± SD of four independent experiments (n = 8). Comparisons between groups were carried out by using Student's t-test for small groups. Differences were considered significant at P < 0.05 and are labeled with an asterisk (∗) on each graph. To evaluate ROS generation, mast cells were incubated with 1 μg/mL LL-37 for 30 or 60 min or medium alone (NS). Indicator for ROS, H2DCFDA, was used at a concentration of 2 μM for 10 min.
Figure 9
Figure 9
Effect of P2X7, FPR2, and EGFR inhibitors on LL-37-induced (a) TLR2 and (b) TLR4 expression. Mast cells were preincubated with P2X7 antagonist KN-62 at 1 μM, FPR2 antagonist PBP10 at 1 μM, or EGFR inhibitor AG1478 at 5 μM or medium alone for 15 min prior to stimulation with LL-37 at 1 μg/mL for 3 h. Representative images showing TLR cellular localization analyzed by confocal microscopy in nonpermeabilized cells. Single confocal sections (midsection of cells) reveal the presence of receptors. The signal was visualized with green Alexa 488. Fluorescence intensity diagrams showing the distribution of fluorescence in cells were mounted.

Similar articles

Cited by

References

    1. Choi K.-Y., Chow L. N. Y., Mookherjee N. Cationic host defence peptides: multifaceted role in immune modulation and inflammation. Journal of Innate Immunity. 2012;4(4):361–370. doi: 10.1159/000336630. - DOI - PMC - PubMed
    1. Mansour S. C., Pena O. M., Hancock R. E. W. Host defense peptides: front-line immunomodulators. Trends in Immunology. 2014;35(9):443–450. doi: 10.1016/j.it.2014.07.004. - DOI - PubMed
    1. Vandamme D., Landuyt B., Luyten W., Schoofs L. A comprehensive summary of LL-37, the factotum human cathelicidin peptide. Cellular Immunology. 2012;280(1):22–35. doi: 10.1016/j.cellimm.2012.11.009. - DOI - PubMed
    1. Bocchinfuso G., Palleschi A., Orioni B., et al. Different mechanisms of action of antimicrobial peptides: insights from fluorescence spectroscopy experiments and molecular dynamics simulations. Journal of Peptide Science. 2009;15(9):550–558. doi: 10.1002/psc.1144. - DOI - PubMed
    1. Scott A., Weldon S., Buchanan P. J., et al. Evaluation of the ability of LL-37 to neutralise LPS in vitro and ex vivo. PLoS One. 2011;6(10, article e26525) doi: 10.1371/journal.pone.0026525. - DOI - PMC - PubMed

LinkOut - more resources