. 2018 Aug;470(8):1243-1254.
doi: 10.1007/s00424-018-2143-y. Epub 2018 Apr 18.

Role of Ca2+ in changing active force during intermittent submaximal stimulation in intact, single mouse muscle fibers

Affiliations

Role of Ca2+ in changing active force during intermittent submaximal stimulation in intact, single mouse muscle fibers

Lisa D Glass et al. Pflugers Arch. 2018 Aug.

Abstract

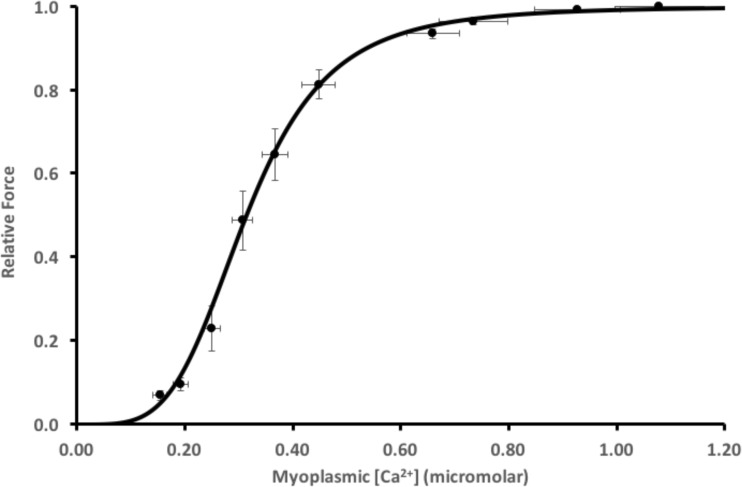
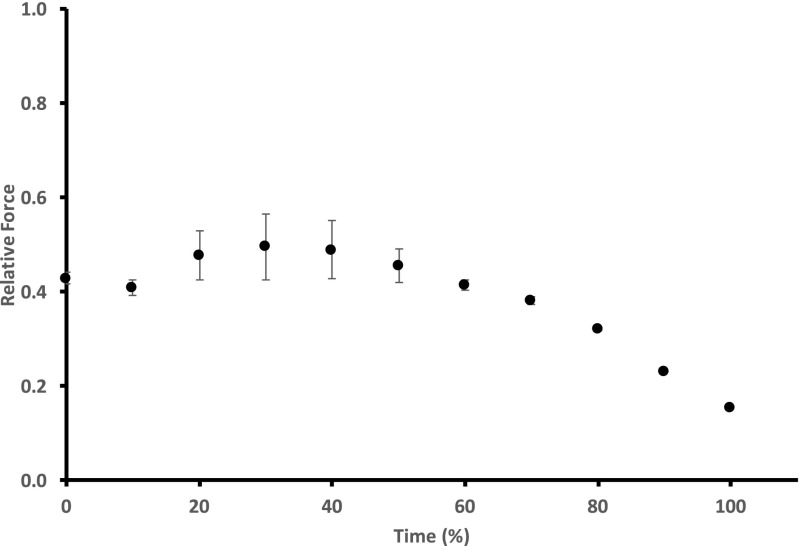
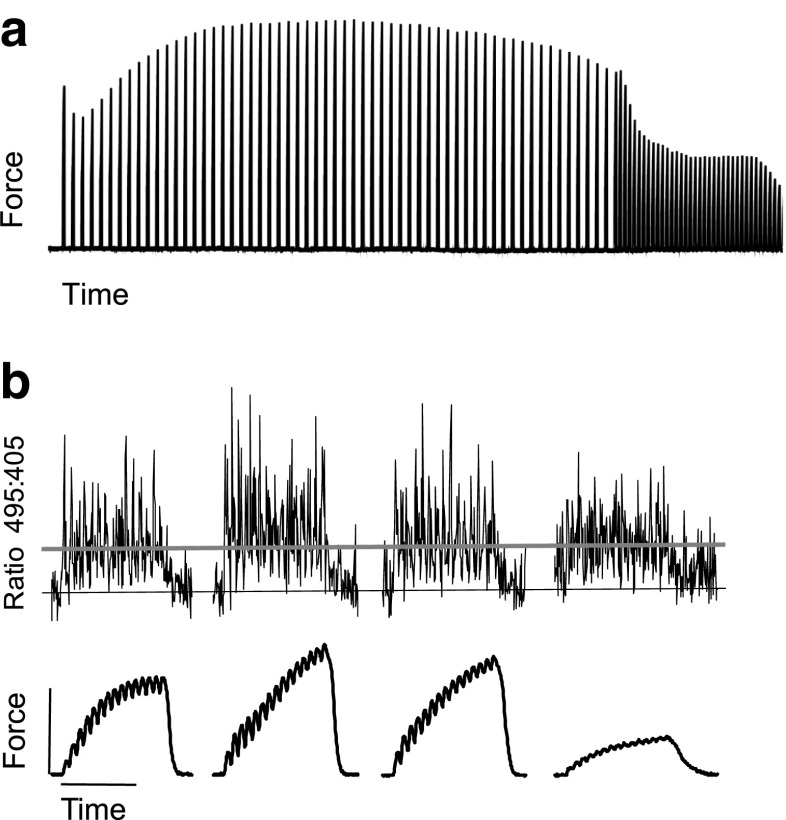
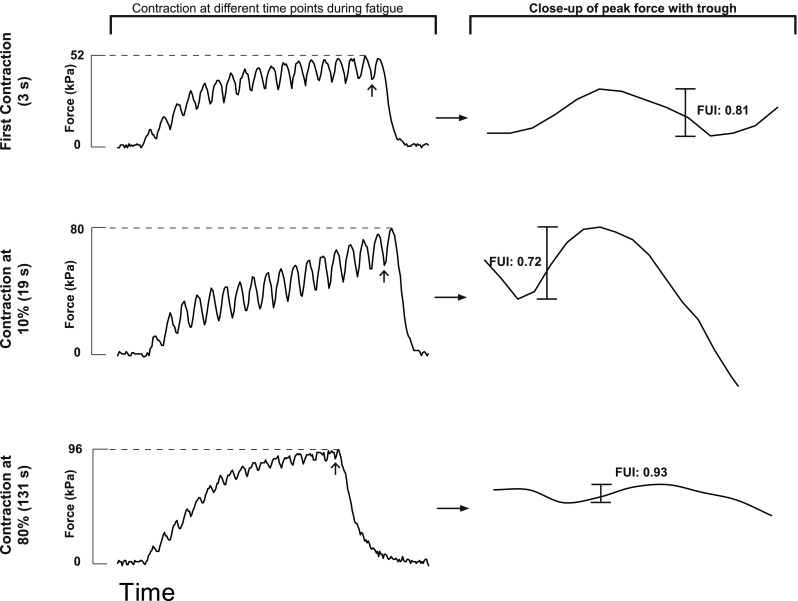
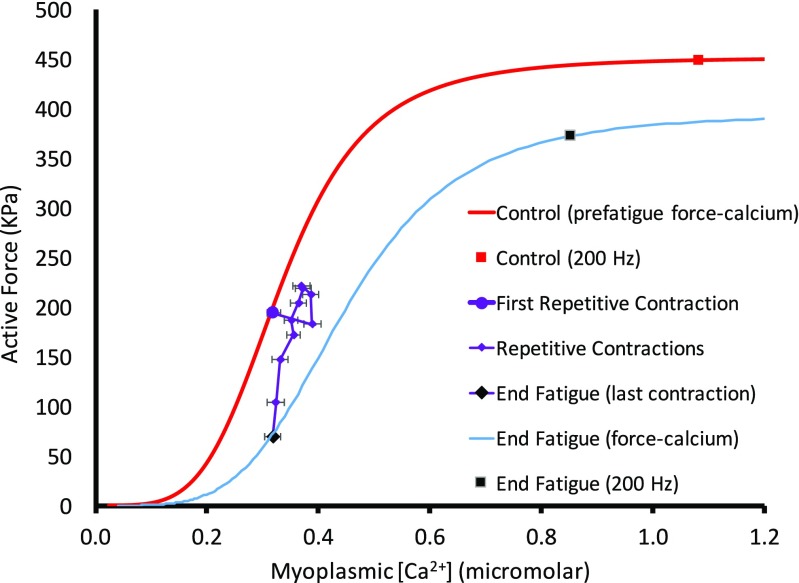
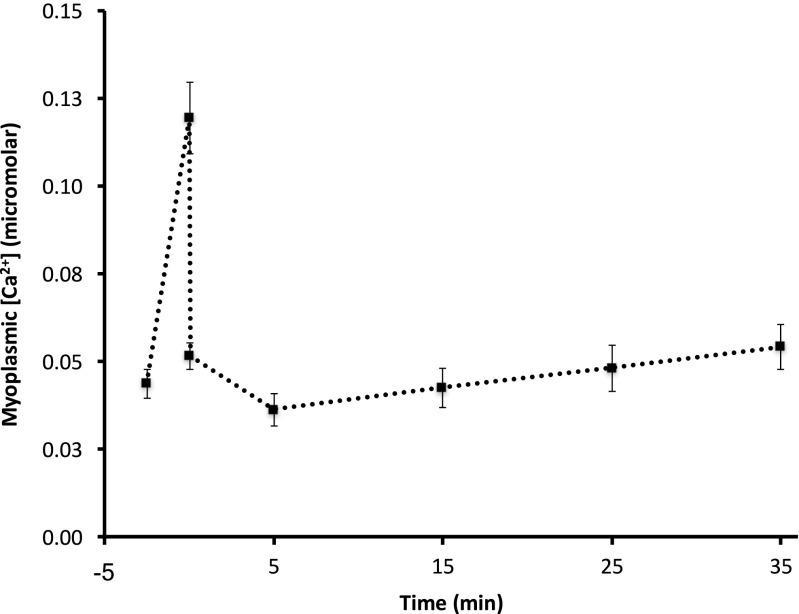
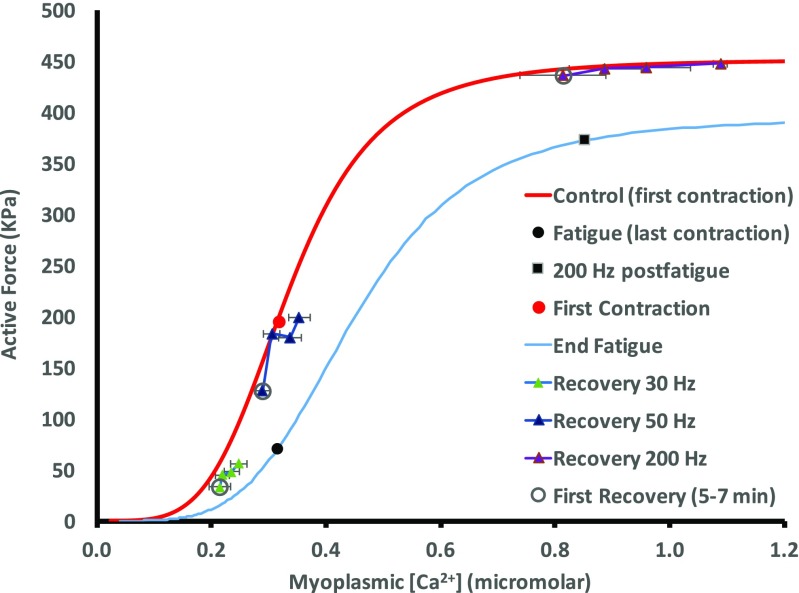
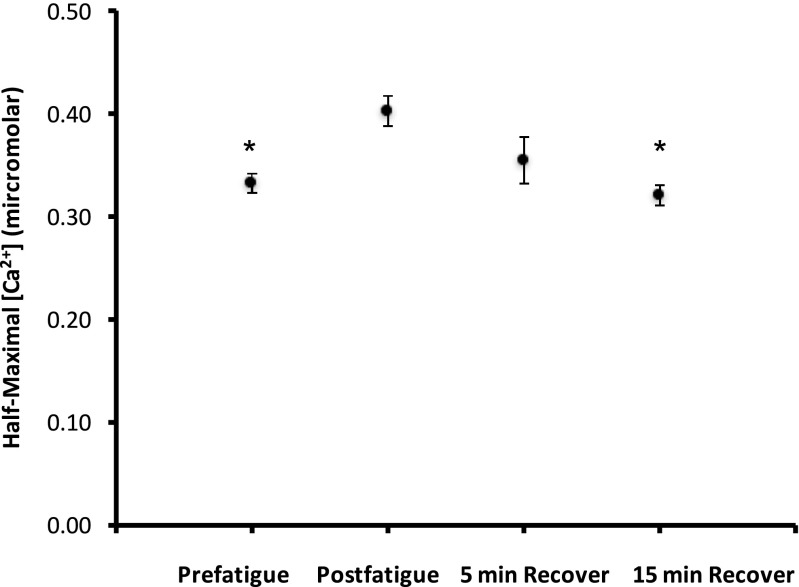
Fatigue of single mouse fibers during repeated high-frequency stimulation results initially from decreased Ca2+ sensitivity while free myoplasmic calcium concentration ([Ca2+]m) increases, followed by decreasing [Ca2+]m. Recovery of active force with low-frequency stimulation is slow and persistent fatigue results from low [Ca2+]m. However, the consequences of intermittent submaximal contractions are not known. The aim of the present study was to investigate the changes in [Ca2+]m and active force during intermittent submaximal contractions and subsequent recovery. Single fibers of mouse flexor digitorum brevis muscles at 32 °C were stimulated with 40 or 50 Hz, for 350 ms every 2 s for 2 min and then every 1 s until < 40% of initial force. Values obtained during the intermittent stimulation were compared with a control force-[Ca2+]m relationship. A "P"-shaped pattern in the force-[Ca2+]m relationship was observed during intermittent stimulation. Early in the intermittent stimulation, [Ca2+]m increased while active force decreased. Subsequent force potentiation was accompanied by increased Ca2+ sensitivity. Later, as active force declined, [Ca2+]m decreased significantly (p < 0.001). This was followed, in the final phase, by a significant decrease in Ca2+ sensitivity determined by [Ca2+]m at half-maximal force (Ca50) (p = 0.001). Low-frequency fatigue persisted during recovery while Ca50 was not significantly different from prefatigue (p > 0.5). In conclusion, the main mechanism of fatigue is due to decreases in both [Ca2+]m and Ca2+ sensitivity following the initial force potentiation. The intermittent submaximal contractions resulted in persistent low-frequency fatigue seen during recovery, which was explained by depressed [Ca2+]m with no change in Ca2+ sensitivity.

Keywords: Calcium sensitivity; Fatigue; Half-maximal calcium concentration; Potentiation; Staircase.


Conflict of interest statement

Ethical approval

All procedures were approved by the University of Calgary Animal Care Committee and by the Stockholm North Ethical Committee on Animal Experiments at Karolinska Institutet.

Competing interests

None.

Figures

Fig. 1
Fig. 1
Mean ± SEM force-[Ca2+]m relationship. Relative force with the myoplasmic free [Ca2+] for n = 12 fibers during increasing frequencies (15–200 Hz) stimulated every minute during the initial standard protocol. The line is best fit through the data with half-maximal [Ca2+]m 3.14E-7M. Hill coefficient was 4.1
Fig. 2
Fig. 2
Time course for relative force during standard intermittent stimulation protocol. Active force typically decreased from the initial value (phase 1), then increased until 30% of time (phase 2). This was followed by decreasing active force (phase 3 and 4). Values are mean ± SEM (n = 12). Missing error bars are within the size of the symbol
Fig. 3
Fig. 3
Time course of active force for one fiber. a Stimulated at 50 Hz every 2 s for 2 min, then every 1 s until force was < 40% of initial force. b Sample contractions on expanded time scale are shown illustrating [Ca2+]m (upper tracing) and force (lower tracing) at start of intermittent stimulation, 40% of duration, 70% of duration, and end of intermittent stimulation where < 40% of initial force is reached, respectively. Horizontal black line corresponds with average resting myoplasmic free [Ca2+] for the first contraction. Horizontal gray line corresponds with average myoplasmic free [Ca2+] during the first contraction (0.3 μM). Vertical calibration bar is 200 kPa. Horizontal calibration bar is 200 ms
Fig. 4
Fig. 4
Sample estimation of fusion index (FUI) during intermittent contractions. The left column shows the force for 350 ms contractions at specific times during repetitive stimulation. The dotted horizontal line indicates peak force and the arrow points at the trough (minimum value) that was used to calculate the fusion index. The right column demonstrates a close-up view of the trough and peak for each contraction and the magnitude of fusion index
Fig. 5
Fig. 5
Force-[Ca2+]m relationship during intermittent stimulation. Values during the intermittent stimulation (n = 12) are shown in purple, beginning with the large purple dot. The control force-[Ca2+]m curve was fit through the first contraction and the control 200 Hz contraction, using the same Hill coefficient as the control force-[Ca2+] shown in Fig. 1. The large purple diamond indicates the last contraction of the intermittent stimulation. The black square is the average force-[Ca2+]m value when stimulated at 200 Hz at the end of fatigue. The curve through these two values represents the force-[Ca2+]m relationship at the end of intermittent contractions (Ca50 = 4.65E-7M)
Fig. 6
Fig. 6
Resting myoplasmic free [Ca2+]m. Concentrations shown were measured prior to first and last of the intermittent contractions, the 200 Hz contraction at end of intermittent stimulation and contractions obtained throughout 35-min recovery. Clearly resting [Ca2+]m increased during the intermittent stimulation, but recovered between the end of this stimulation and the 200 Hz contraction (within seconds). Vertical bars represent SEM
Fig. 7
Fig. 7
Force-[Ca2+]m during recovery. Contractions at 30, 50, and 200 Hz were obtained during recovery at 5, 15, 25, and 35 min. First recovery values were measured at 5–7 min (open circles). The prefatigue force-[Ca2+]m curve (red line) passes through the first contraction of the intermittent stimulation (red circle) for reference. Force and [Ca2+]m tended to increase throughout recovery from 5 to 35 min. Data points represent the mean of n = 12. Horizontal bars represent SEM
Fig. 8
Fig. 8
Force-[Ca2+]m relationship during recovery without prior intermittent stimulation. Relative active force and [Ca2+]m at 5, 15, 25, and 35 min representing recovery (open circles) without prior intermittent stimulation. Values are compared to control force-[Ca2+]m relationship (red line) as in Figs. 5 and 7. Circles from small to large demonstrate values from 5 to 35 min. Data points presented as the mean of n = 3
Fig. 9
Fig. 9
Ca50 values before and after intermittent contractions. The average ± SEM Ca50 for prefatigue (through first contraction), end of fatigue (last contraction), 5 min recovery, and 15 min recovery. Asterisk shows significant difference when compared to postfatigue (p < 0.05). Value at 5 min recovery was not different from any other values (n = 12)

Similar articles

Cited by

References

    1. Stephenson DG, Williams DA. Calcium-activated force responses in fast-and slow-twitch skinned muscle fibres of the rat at different temperatures. J Physiol. 1981;317:281–302. doi: 10.1113/jphysiol.1981.sp013825. - DOI - PMC - PubMed
    1. Westerblad H, Duty S, Allen DG. Intracellular calcium concentration during low-frequency fatigue in isolated single fibers of mouse skeletal muscle. J Appl Physiol. 1993;75:382–388. doi: 10.1152/jappl.1993.75.1.382. - DOI - PubMed
    1. Cheng AJ, Westerblad H. Mechanical isolation, and measurement of force and myoplasmic free [Ca2+] in fully intact single skeletal muscle fibers. Nat Protoc. 2017;12:1763–1776. doi: 10.1038/nprot.2017.056. - DOI - PubMed
    1. Cheng AJ, Place N, Westerblad H (2018) Molecular basis for exercise-induced fatigue: the importance of strictly controlled cellular Ca2+ handling. Cold Spring Harb Perspect Med 8 - PMC - PubMed
    1. Westerblad H, Allen DG. Changes of myoplasmic calcium concentration during fatigue in single mouse muscle fibers. J Gen Physiol. 1991;98:615–635. doi: 10.1085/jgp.98.3.615. - DOI - PMC - PubMed

Publication types

LinkOut - more resources