

Estimation of diffusion constants from single molecular measurement without explicit tracking
- PMID: 29671388
- PMCID: PMC5907143
- DOI: 10.1186/s12918-018-0526-5
Estimation of diffusion constants from single molecular measurement without explicit tracking
Abstract
Background: Time course measurement of single molecules on a cell surface provides detailed information about the dynamics of the molecules that would otherwise be inaccessible. To extract the quantitative information, single particle tracking (SPT) is typically performed. However, trajectories extracted by SPT inevitably have linking errors when the diffusion speed of single molecules is high compared to the scale of the particle density.
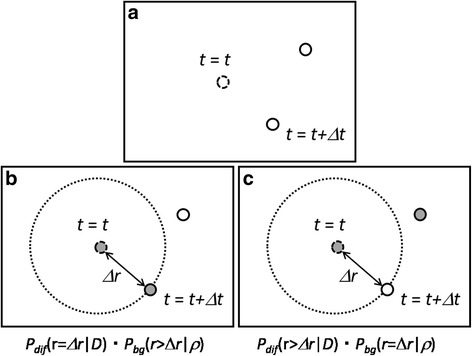
Methods: To circumvent this problem, we develop an algorithm to estimate diffusion constants without relying on SPT. The proposed algorithm is based on a probabilistic model of the distance to the nearest point in subsequent frames. This probabilistic model generalizes the model of single particle Brownian motion under an isolated environment into the one surrounded by indistinguishable multiple particles, with a mean field approximation.
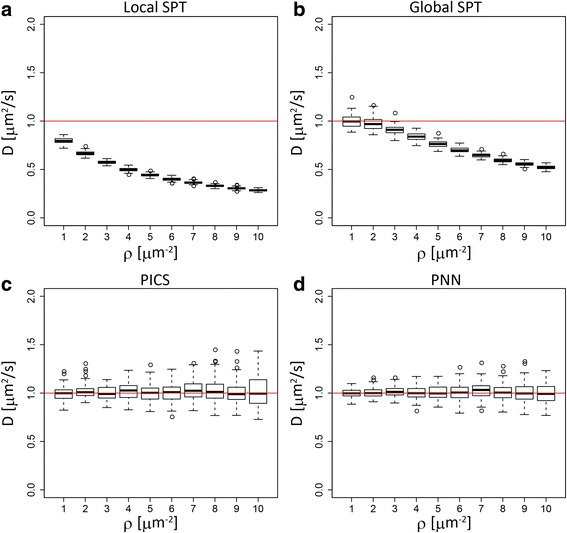
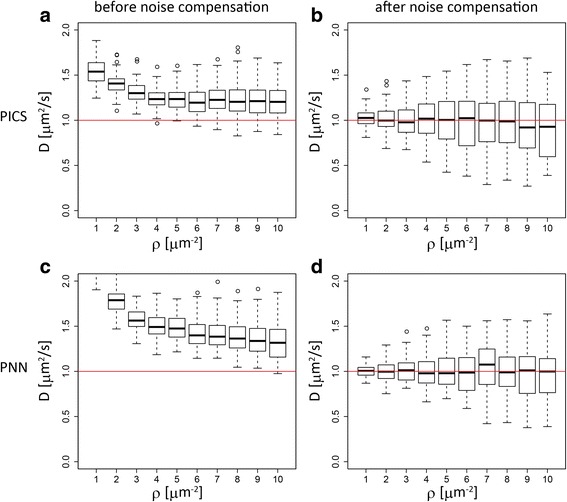
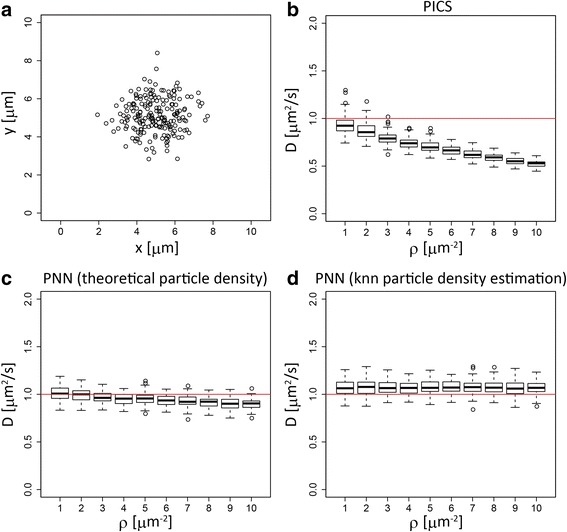
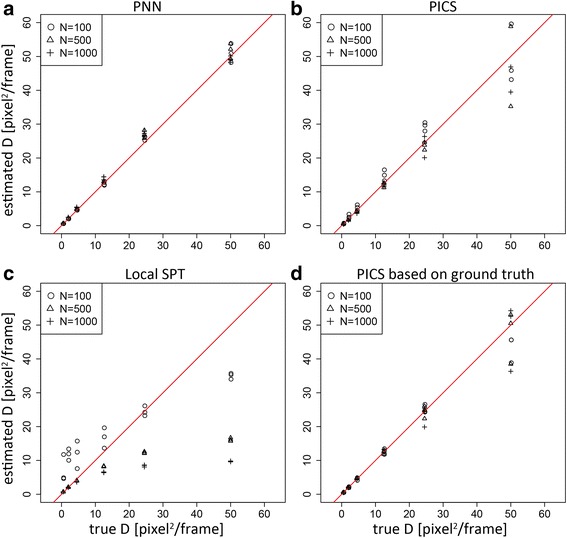
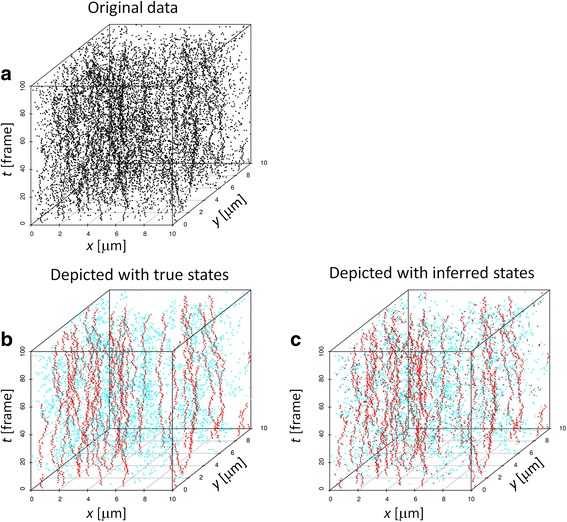
Results: We demonstrate that the proposed algorithm provides reasonable estimation of diffusion constants, even when other methods suffer due to high particle density or inhomogeneous particle distribution. In addition, our algorithm can be used for visualization of time course data from single molecular measurements.
Conclusions: The proposed algorithm based on the probabilistic model of indistinguishable Brownian particles provide accurate estimation of diffusion constants even in the regime where the traditional SPT methods underestimate them due to linking errors.
Keywords: Brownian motion; Diffusion constants; Expectation maximization algorithm; Probabilistic model; Single molecular measurement.
Conflict of interest statement
Ethics approval and consent to participate
Not applicable.
Consent for publication
Not applicable.
Competing interests
The authors declare that they have no competing interests.
Publisher’s Note
Springer Nature remains neutral with regard to jurisdictional claims in published maps and institutional affiliations.
Figures
Similar articles
-
Time series analysis of particle tracking data for molecular motion on the cell membrane.Bull Math Biol. 2009 Nov;71(8):1967-2024. doi: 10.1007/s11538-009-9434-6. Epub 2009 Aug 6. Bull Math Biol. 2009. PMID: 19657701 Free PMC article.
-
First-passage kinetic Monte Carlo method.Phys Rev E Stat Nonlin Soft Matter Phys. 2009 Dec;80(6 Pt 2):066701. doi: 10.1103/PhysRevE.80.066701. Epub 2009 Dec 1. Phys Rev E Stat Nonlin Soft Matter Phys. 2009. PMID: 20365296
-
Optimal fits of diffusion constants from single-time data points of Brownian trajectories.Phys Rev E Stat Nonlin Soft Matter Phys. 2012 Dec;86(6 Pt 1):060101. doi: 10.1103/PhysRevE.86.060101. Epub 2012 Dec 20. Phys Rev E Stat Nonlin Soft Matter Phys. 2012. PMID: 23367881
-
What can we learn from single molecule trajectories?Curr Protein Pept Sci. 2011 Dec;12(8):714-24. doi: 10.2174/138920311798841753. Curr Protein Pept Sci. 2011. PMID: 22044145 Review.
-
Real-Time Feedback-Driven Single-Particle Tracking: A Survey and Perspective.Small. 2022 Jul;18(29):e2107024. doi: 10.1002/smll.202107024. Epub 2022 Jun 27. Small. 2022. PMID: 35758534 Free PMC article. Review.
Cited by
-
Practical considerations for feature assignment in high-speed AFM of live cell membranes.Biophys Physicobiol. 2022 Apr 15;19:1-21. doi: 10.2142/biophysico.bppb-v19.0016. eCollection 2022. Biophys Physicobiol. 2022. PMID: 35797405 Free PMC article.
References
Publication types
MeSH terms
LinkOut - more resources
Full Text Sources
Other Literature Sources
