. 2018 May 7;20(17):11656-11672.
doi: 10.1039/c8cp01608a. Epub 2018 Apr 19.

Magnetization relaxation in the single-ion magnet DySc2N@C80: quantum tunneling, magnetic dilution, and unconventional temperature dependence

Affiliations

Magnetization relaxation in the single-ion magnet DySc2N@C80: quantum tunneling, magnetic dilution, and unconventional temperature dependence

D S Krylov et al. Phys Chem Chem Phys. .

Abstract

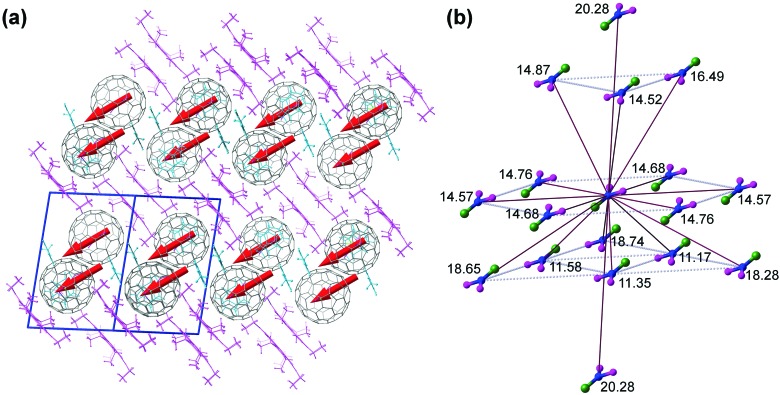
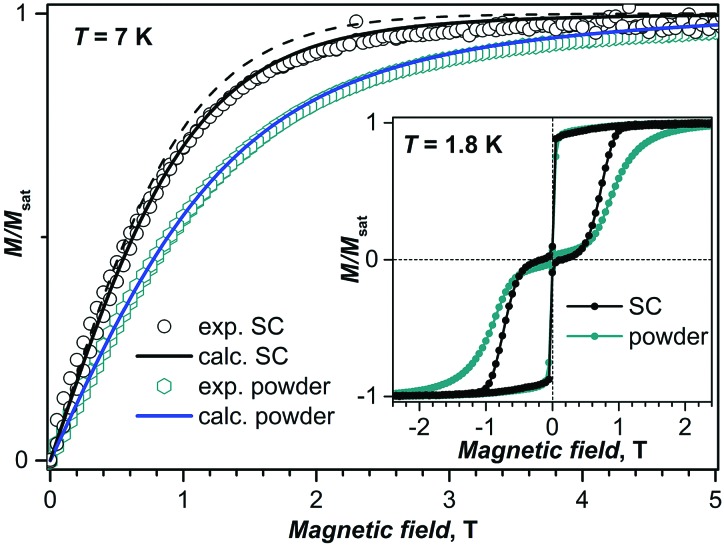
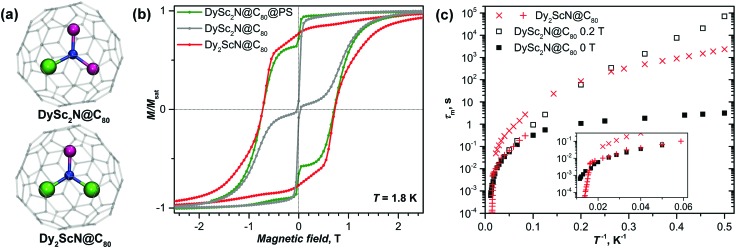
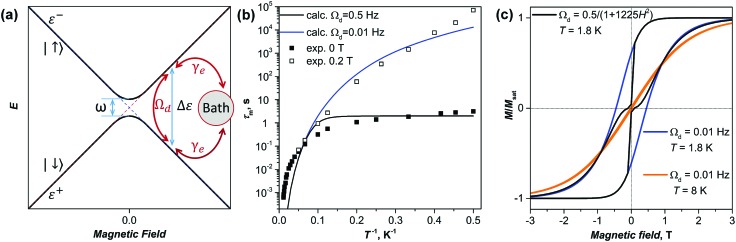
Relaxation of magnetization in endohedral metallofullerenes DySc2N@C80 is studied at different temperatures, in different magnetic fields, and in different molecular arrangements. Magnetization behavior and relaxation are analyzed for powder sample, and for DySc2N@C80 diluted in non-magnetic fullerene Lu3N@C80, adsorbed in voids of a metal-organic framework, and dispersed in a polymer. The magnetic field dependence and zero-field relaxation are also studied for single-crystals of DySc2N@C80 co-crystallized with Ni(ii) octaethylporphyrin, as well as for the single crystal diluted with Lu3N@C80. Landau-Zener theory is applied to analyze quantum tunneling of magnetization in the crystals. The field dependence of relaxation rates revealed a dramatic dependence of the zero-field tunneling resonance width on the dilution and is explained with the help of an analysis of dipolar field distributions. AC magnetometry is used then to get access to the relaxation of magnetization in a broader temperature range, from 2 to 87 K. Finally, a theoretical framework describing the spin dynamics with dissipation is proposed to study magnetization relaxation phenomena in single molecule magnets.


Figures

Fig. 1
Fig. 1. (a and b) Mutual orientations of the DySc2N@C80 and NiII(OEP) molecules in crystals I (a) and II (b), only the main site of the endohedral cluster is shown, the displacement parameters are shown at the 30% (a) and 50% (b) probability levels; (c and d) major and minor metal sites in the DySc2N cluster in crystals I (c) and II (d); (e and f) the main DySc2N sites in I (e) and II (f), coordinated cage carbons (metal–carbon distances less than 2.98 and 2.84 Å for Dy and Sc, respectively), and metal–nitrogen bond lengths (in Å). Bond angles in the DySc2N cluster are 113.2(3)° Sc1–N1–Sc2, 124.0(3)° Sc1–N1–Dy1A, 122.7(3)° Sc2–N1–Dy1A in I, and 108.9(6)° Sc1A–N1–Sc2, 123.7(5)° Sc1A–N1–Dy1A, 127.4(6)° Sc2–N1–Dy1A in II.
Fig. 2
Fig. 2. (a) Packing of molecules in the DySc2N@C80·NiII(OEP)·0.72(C6H6)·1.28(C7H8) crystal (II). Fullerenes are shown in grey, porphyrin molecules in magenta, and solvent molecules in cyan. Red arrows indicate positions of Dy atom and directions of the Dy–N bonds. Blue lines denote the unit cell. (b) The closest fullerene neighbors (inter-fullerene distance 20 Å or less) in the crystal II (only major sites of DySc2N clusters are shown: Dy is green, Sc is magenta, N is blue, the numbers are N···N distances to the “central” molecule in Å).
Fig. 3
Fig. 3. (a) Magnetization curves of DySc2N@C80 powder samples measured at different temperatures between 1.8 and 7 K, the inset shows the curves for T = 3–7 K near zero field. (b) Magnetization curves of DySc2N@C80 diluted with Lu3N@C80 in different ratios, T = 1.8 K. (c) Magnetization curves of DySc2N@C80 diluted in different diamagnetic matrices (Lu3N@C80, MOF DUT-51(Zr), and polystyrene (PS)), T = 1.8 K; the inset shows the peak in the temperature dependence of the magnetic susceptibility χ used of the determination of the blocking temperature TB (the black curve was measured during cooling the non-diluted sample in a field of 0.2 T (FC), the other curves were measured during increase of the temperature for the samples cooled in zero field (ZFC); the susceptibility curves for different dilution matrices are shown with a slight offset, temperature sweep rate is 5 K min–1). All magnetization curves were measured with a sweep rate of 2.9 mT s–1.
Fig. 4
Fig. 4. Experimental (dots) and calculated (lines) magnetization curves of the powder and aligned single-crystal II (SC) of DySc2N@C80 at T = 7 K. Calculations for the single crystal took into account the presence of two crystallographic DySc2N sites in the crystal II (solid line); the dashed line is the calculated magnetization curve for the main site only. The inset shows magnetic hysteresis curves measured at 1.8 K for the powder and for the single crystal.
Fig. 5
Fig. 5. (a) Magnetization curves of diluted (red) and non-diluted (black) single crystal DySc2N@C80·NiII(OEP) (II) at 1.8 K as compared to the simulated thermodynamic magnetization curve (blue). For the sake of better comparison, the magnetic field of the non-diluted crystal was scaled by cos(43°) to take into account misalignment of the anisotropy axis with respect to the direction of the external field. The right panels show changes of the normalized magnetization upon multiple scans in the range of [–0.3 T, +0.3 T]. (b) Sweep rate dependence of the relative magnetization drop upon crossing zero magnetic field in non-diluted (black dots) and diluted (red dots) crystals. Dashed lines represent the calculated PQTM dependences calculated using eqn (3) for the whole set of points (left) and for the data point obtained with the fastest sweep rate (right).
Fig. 6
Fig. 6. (a) Relaxation times of magnetization measured at 1.8 K for diluted (red) and non-diluted (black) single crystals (SCs) as a function of magnetic field. Solid lines are spline-interpolated and are only shown to guide the eye, dashed lines are fits with eqn (1). The inset shows the simulated distribution of Hdip‖ in non-diluted (100%) and diluted (10%) crystals at different magnetization states (Ms is the magnetization of the fully polarized sample); (b) relaxation times of magnetization measured at 1.8 K for non-diluted powder (gray) as well as for diluted samples in MOF (blue) and polystyrene (PS, green). The inset zooms into the small field range.
Fig. 7
Fig. 7. (a) Imaginary component of the magnetic susceptibility χ′′ of non-diluted DySc2N@C80 powder in zero field (blue dots and curves) and in the field of 0.2 T (red dots and curves) at temperatures of 8, 10, 15, and 20 K; the inset shows temperature dependence of the relaxation times. (b) Imaginary component of magnetic susceptibility χ′′ of DySc2N@C80 measured at 10 K in different constant field ranging from 0 T to 0.5 T; the inset shows the field dependence of relaxation times at 10 K. In both (a and b), dots are experimental χ′′ data points, lines are fits obtained with the generalized Debye model.
Fig. 8
Fig. 8. Imaginary component of the magnetic susceptibility χ′′ of non-diluted DySc2N@C80 powder measured in zero field at selected temperatures. The inset shows Cole–Cole plots. Dots are experimental data points, lines are fits obtained with the generalized Debye model.
Fig. 9
Fig. 9. Relaxation times of magnetization of DySc2N@C80 at temperatures of 2–87 K. Zero-field values are shown as full dots, in-field (0.2 T) values are denoted as open dots. Relaxation times for non-diluted DySc2N@C80 are shown in black, the values for diluted samples are blue (dilution with MOF) and green (diluted with polystyrene, PS). The times longer or shorter than 10 s are determined by DC and AC magnetometry, respectively. The dashed green line represents the calculated rate of relaxation following the direct mechanism in the field of 0.2 T with parameters estimated from the field dependence (Fig. 6); the blue line is the fit of the points in the 2–5 K range with the Orbach relaxation mechanism. The black line represents the fit of the QTM-like zero-field relaxation with the power function of temperature.
Fig. 10
Fig. 10. (a) Molecular structures of DySc2N@C80 and Dy2ScN@C80 (Dy is green, Sc is magenta, N is blue, carbon cage is transparent grey). (b) Magnetization curves of DySc2N@C80 (non-diluted and polystyrene-diluted powder) and Dy2ScN@C80; T = 1.8 K, sweep rate 2.9 mT s–1. (c) Relaxation times of DySc2N@C80 (zero-field and in-field non-diluted) and Dy2ScN@C80. The inset shows the enhancement of the high-temperature range.
Fig. 11
Fig. 11. (a) Schematic description of the two-level spin system: diabatic states |↑ and |↓ have the energies of ε± and the energy difference between the states of Δε. The avoided crossing in zero field gives the tunneling gap ω. Two types of dissipation pathways are denoted with red arrows: dissipation via the phonon bath with the temperature dependent rate γe, and temperature-independent dissipation with the rate Ωd. (b) Comparison of computed and experimental temperature dependences of relaxation times, computations are performed with two different values of Ωd and the empirical mean-field γe parameter defined as γeT6. (c) Magnetic hysteresis curves computed with at 1.8 and 8 K for a constant parameter Ωd = 0.01 Hz, and computed at 1.8 K for the field dependent parameter Ωd = 0.5/(1 + 1225H2).

References

    1. Popov A. A., Yang S., Dunsch L. Chem. Rev. 2013;113:5989–6113. - PubMed
    1. Shinohara H. and Tagmatarchis N., Endohedral Metallofullerenes: Fullerenes with Metal Inside, John Wiley & Sons, Ltd, 2015.
    1. Endohedral Metallofullerenes: Basics and Applications, ed. X. Lu, L. Echegoyen, A. L. Balch, S. Nagase and T. Akasaka, CRC Press, 2014.
    1. Endohedral Fullerenes: From Fundamentals to Applications, ed. S. Yang and C.-R. Wang, World Scientific, 2014.
    1. Yang S., Wei T., Jin F. Chem. Soc. Rev. 2017;46:5005–5058. - PubMed

LinkOut - more resources