

Integrated Social-Behavioral and Ecological Risk Maps to Prioritize Local Public Health Responses to Lyme Disease
- PMID: 29671475
- PMCID: PMC6071748
- DOI: 10.1289/EHP1943
Integrated Social-Behavioral and Ecological Risk Maps to Prioritize Local Public Health Responses to Lyme Disease
Abstract
Background: The risk of contracting Lyme disease (LD) can vary spatially because of spatial heterogeneity in risk factors such as social-behavior and exposure to ecological risk factors. Integrating these risk factors to inform decision-making should therefore increase the effectiveness of mitigation interventions.
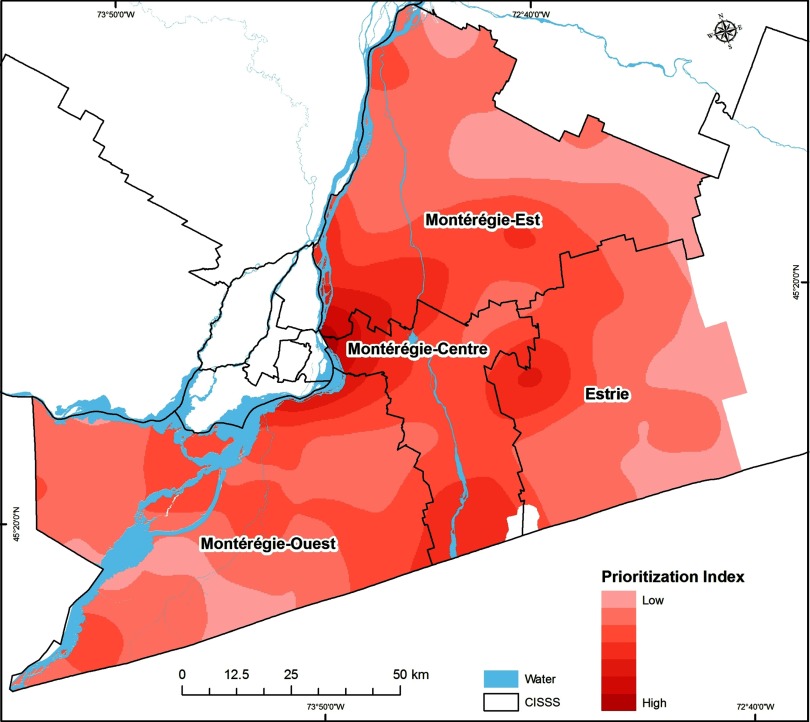
Objectives: The objective of this study was to develop an integrated social-behavioral and ecological risk-mapping approach to identify priority areas for LD interventions.
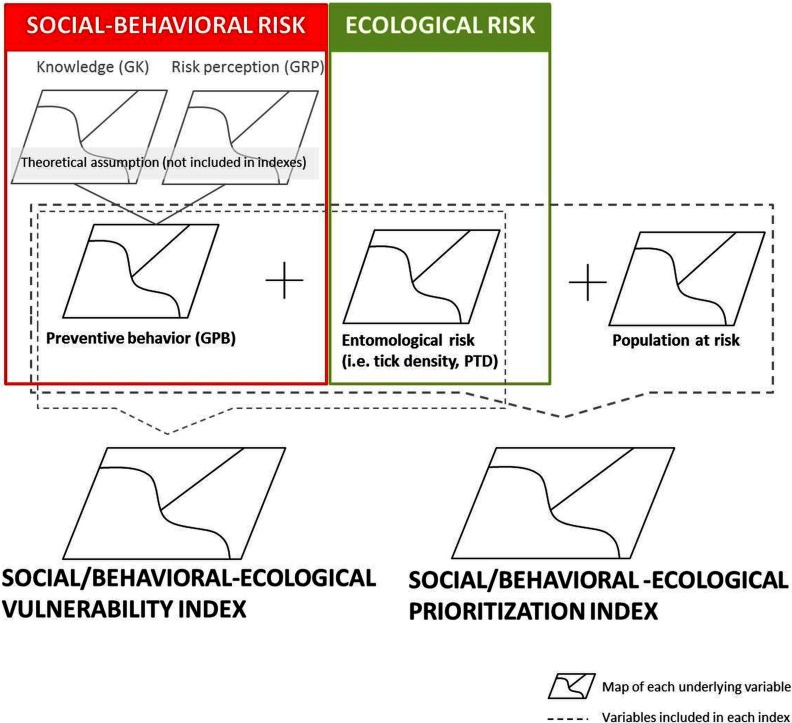
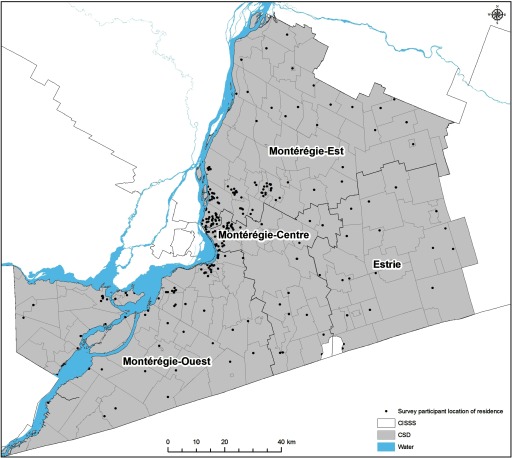
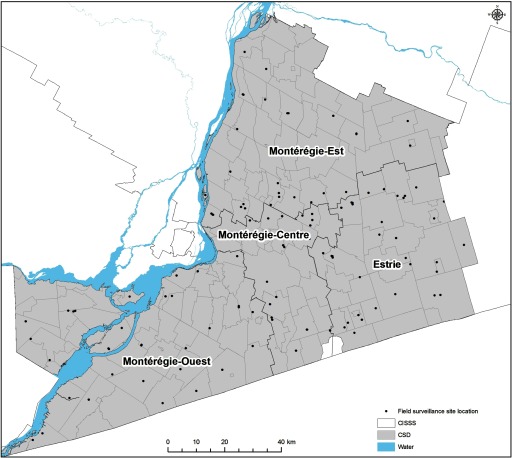
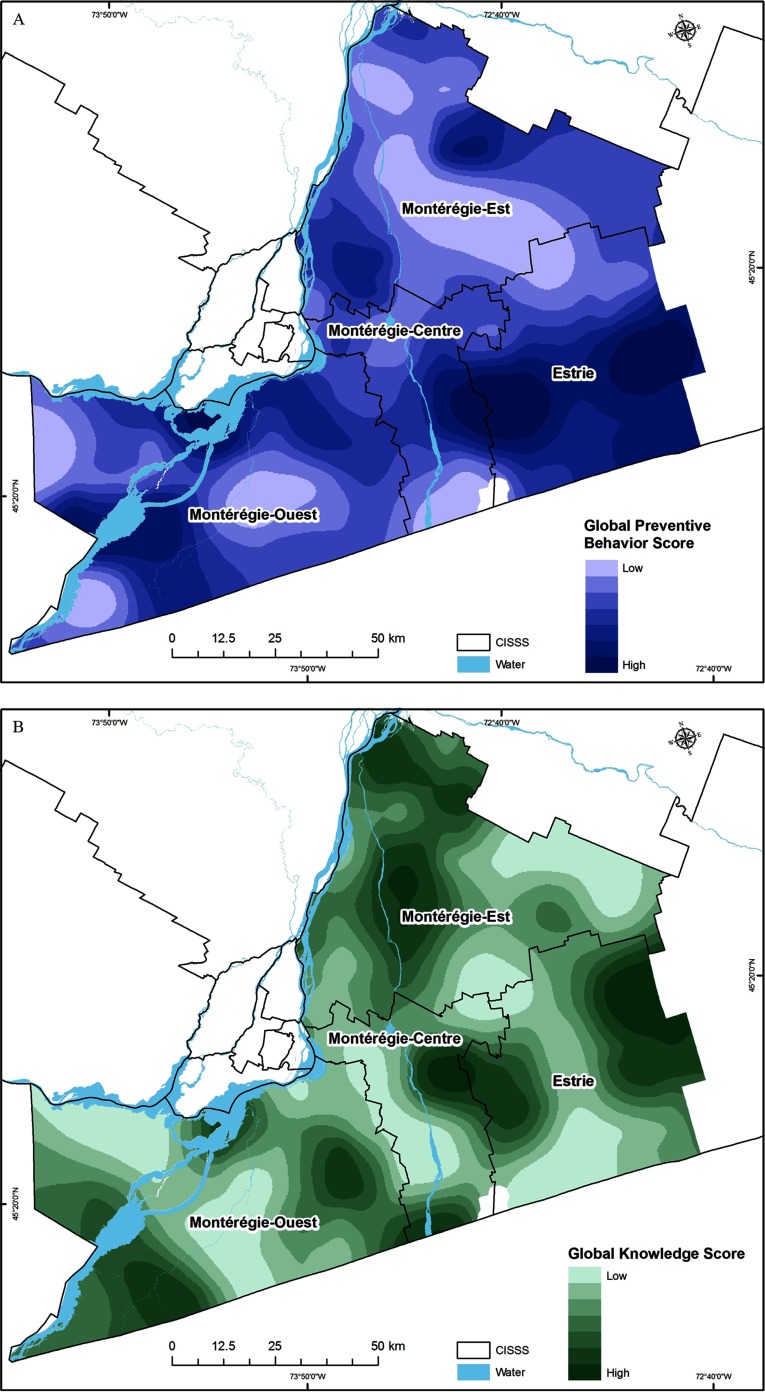
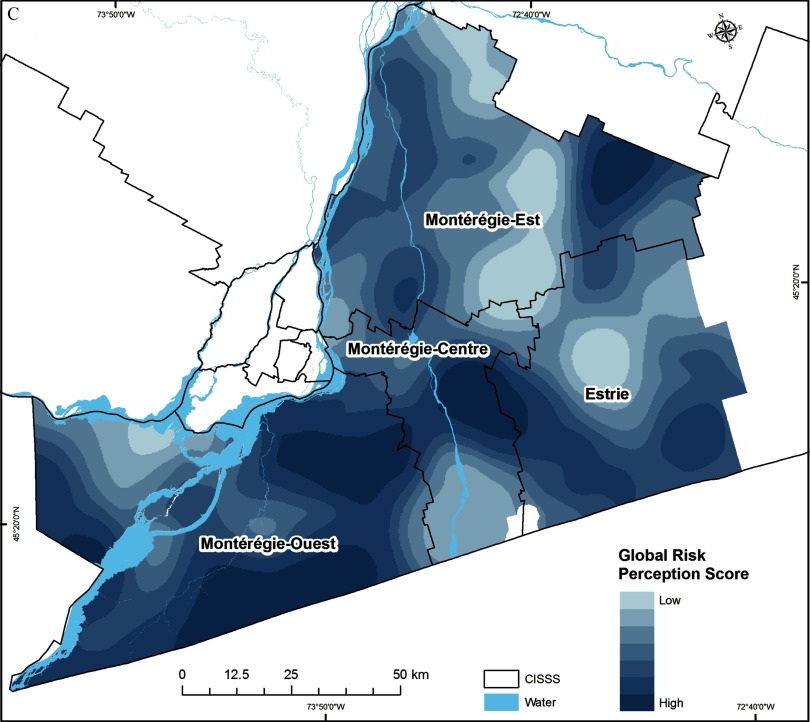
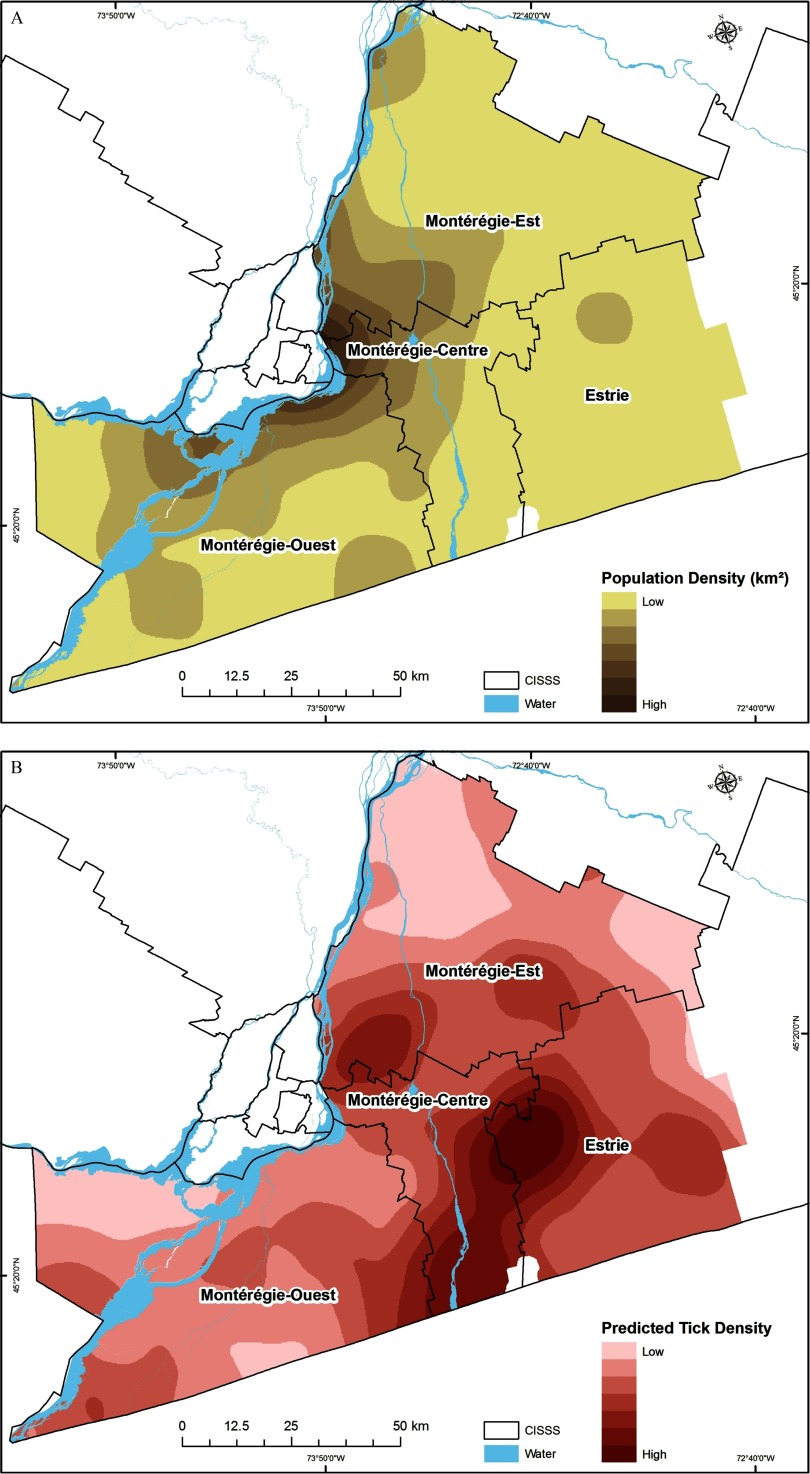
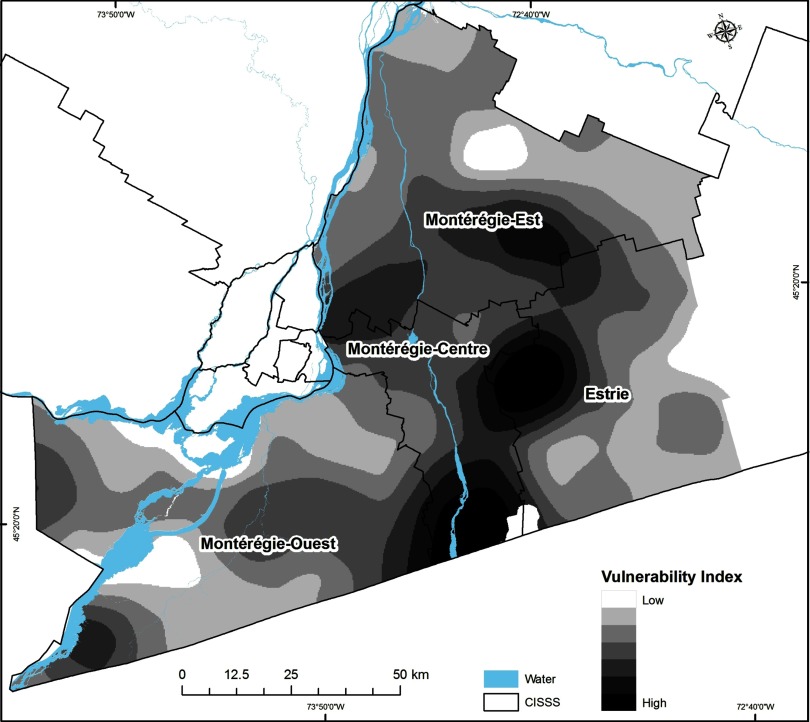
Methods: The study was conducted in the Montérégie region of Southern Quebec, Canada, where LD is a newly endemic disease. Spatial variation in LD knowledge, risk perceptions, and behaviors in the population were measured using web survey data collected in 2012. These data were used as a proxy for the social-behavioral component of risk. Tick vector population densities were measured in the environment during field surveillance from 2007 to 2012 to provide an index of the ecological component of risk. Social-behavioral and ecological components of risk were combined with human population density to create integrated risk maps. Map predictions were validated by testing the association between high-risk areas and the current spatial distribution of human LD cases.
Results: Social-behavioral and ecological components of LD risk had markedly different distributions within the study region, suggesting that both factors should be considered for locally adapted interventions. The occurrence of human LD cases in a municipality was positively associated with tick density (p<0.01) but was not significantly associated with social-behavioral risk.
Conclusion: This study is an applied demonstration of how integrated social-behavioral and ecological risk maps can be created to assist decision-making. Social survey data are a valuable but underutilized source of information for understanding regional variation in LD exposure, and integrating this information into risk maps provides a novel approach for prioritizing and adapting interventions to the local characteristics of target populations. https://doi.org/10.1289/EHP1943.
Figures
Similar articles
-
Integrated human behavior and tick risk maps to prioritize Lyme disease interventions using a 'One Health' approach.Ticks Tick Borne Dis. 2023 Mar;14(2):102083. doi: 10.1016/j.ttbdis.2022.102083. Epub 2022 Nov 19. Ticks Tick Borne Dis. 2023. PMID: 36435167
-
Self-reported tick exposure as an indicator of Lyme disease risk in an endemic region of Quebec, Canada.Ticks Tick Borne Dis. 2024 Jan;15(1):102271. doi: 10.1016/j.ttbdis.2023.102271. Epub 2023 Oct 21. Ticks Tick Borne Dis. 2024. PMID: 37866213
-
From Lyme disease emergence to endemicity: a cross sectional comparative study of risk perceptions in different populations.BMC Public Health. 2014 Dec 18;14:1298. doi: 10.1186/1471-2458-14-1298. BMC Public Health. 2014. PMID: 25523355 Free PMC article.
-
Lyme Disease: Emergency Department Considerations.J Emerg Med. 2017 Jun;52(6):815-824. doi: 10.1016/j.jemermed.2017.01.022. Epub 2017 Mar 11. J Emerg Med. 2017. PMID: 28291638 Review.
-
GIS and Remote Sensing Use in the Exploration of Lyme Disease Epidemiology.Int J Environ Res Public Health. 2015 Dec 1;12(12):15182-203. doi: 10.3390/ijerph121214971. Int J Environ Res Public Health. 2015. PMID: 26633445 Free PMC article. Review.
Cited by
-
Spatial multi-criteria decision analysis for the selection of sentinel regions in tick-borne disease surveillance.BMC Public Health. 2024 Jan 25;24(1):294. doi: 10.1186/s12889-024-17684-x. BMC Public Health. 2024. PMID: 38267914 Free PMC article.
-
THE EXPOSOME IN HUMAN EVOLUTION: FROM DUST TO DIESEL.Q Rev Biol. 2019 Dec;94(4):333-394. doi: 10.1086/706768. Q Rev Biol. 2019. PMID: 32269391 Free PMC article.
-
N Increased risk of tick-borne diseases with climate and environmental changes.Can Commun Dis Rep. 2019 Apr 4;45(4):83-89. doi: 10.14745/ccdr.v45i04a02. eCollection 2019 Apr 4. Can Commun Dis Rep. 2019. PMID: 31285697 Free PMC article.
-
Reconciling the Entomological Hazard and Disease Risk in the Lyme Disease System.Int J Environ Res Public Health. 2018 May 22;15(5):1048. doi: 10.3390/ijerph15051048. Int J Environ Res Public Health. 2018. PMID: 29789489 Free PMC article.
-
Development and validation of a behavioral index for adaptation to lyme disease.BMC Public Health. 2020 Sep 21;20(1):1435. doi: 10.1186/s12889-020-09535-2. BMC Public Health. 2020. PMID: 32958077 Free PMC article.
References
Publication types
MeSH terms
LinkOut - more resources
Full Text Sources
Other Literature Sources
Medical
Research Materials
