

Longitudinal Modeling of Lung Function Trajectories in Smokers with and without Chronic Obstructive Pulmonary Disease
- PMID: 29671603
- PMCID: PMC6221566
- DOI: 10.1164/rccm.201707-1405OC
Longitudinal Modeling of Lung Function Trajectories in Smokers with and without Chronic Obstructive Pulmonary Disease
Abstract
Rationale: The relationship between longitudinal lung function trajectories, chest computed tomography (CT) imaging, and genetic predisposition to chronic obstructive pulmonary disease (COPD) has not been explored.
Objectives: 1) To model trajectories using a data-driven approach applied to longitudinal data spanning adulthood in the Normative Aging Study (NAS), and 2) to apply these models to demographically similar subjects in the COPDGene (Genetic Epidemiology of COPD) Study with detailed phenotypic characterization including chest CT.
Methods: We modeled lung function trajectories in 1,060 subjects in NAS with a median follow-up time of 29 years. We assigned 3,546 non-Hispanic white males in COPDGene to these trajectories for further analysis. We assessed phenotypic and genetic differences between trajectories and across age strata.
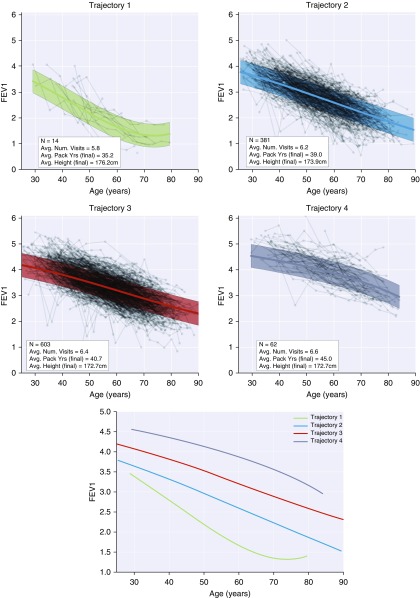
Measurements and main results: We identified four trajectories in NAS with differing levels of maximum lung function and rate of decline. In COPDGene, 617 subjects (17%) were assigned to the lowest trajectory and had the greatest radiologic burden of disease (P < 0.01); 1,283 subjects (36%) were assigned to a low trajectory with evidence of airway disease preceding emphysema on CT; 1,411 subjects (40%) and 237 subjects (7%) were assigned to the remaining two trajectories and tended to have preserved lung function and negligible emphysema. The genetic contribution to these trajectories was as high as 83% (P = 0.02), and membership in lower lung function trajectories was associated with greater parental histories of COPD, decreased exercise capacity, greater dyspnea, and more frequent COPD exacerbations.
Conclusions: Data-driven analysis identifies four lung function trajectories. Trajectory membership has a genetic basis and is associated with distinct lung structural abnormalities.
Keywords: chronic obstructive pulmonary disease; longitudinal analysis; lung function trajectories.
Figures


Comment in
-
The Changing Landscape of Chronic Obstructive Pulmonary Disease.Am J Respir Crit Care Med. 2018 Oct 15;198(8):978-981. doi: 10.1164/rccm.201804-0714ED. Am J Respir Crit Care Med. 2018. PMID: 29701997 No abstract available.
References
-
- World Health Organization. World health statistics 2008. Geneva, Switzerland: World Health Organization; 2008.
-
- Minino AM, Murphy SL. Death in the United States, 2010. NCHS Data Brief. 2012;99:1–8. - PubMed
-
- Speizer FE, Tager IB. Epidemiology of chronic mucus hypersecretion and obstructive airways disease. Epidemiol Rev. 1979;1:124–142. - PubMed
-
- Lange P, Celli B, Agustí A, Boje Jensen G, Divo M, Faner R, et al. Lung-function trajectories leading to chronic obstructive pulmonary disease. N Engl J Med. 2015;373:111–122. - PubMed
Publication types
MeSH terms
Grants and funding
LinkOut - more resources
Full Text Sources
Other Literature Sources
Medical
