

Full Mitogenomes in the Critically Endangered Kākāpō Reveal Major Post-Glacial and Anthropogenic Effects on Neutral Genetic Diversity
- PMID: 29671759
- PMCID: PMC5924562
- DOI: 10.3390/genes9040220
Full Mitogenomes in the Critically Endangered Kākāpō Reveal Major Post-Glacial and Anthropogenic Effects on Neutral Genetic Diversity
Abstract
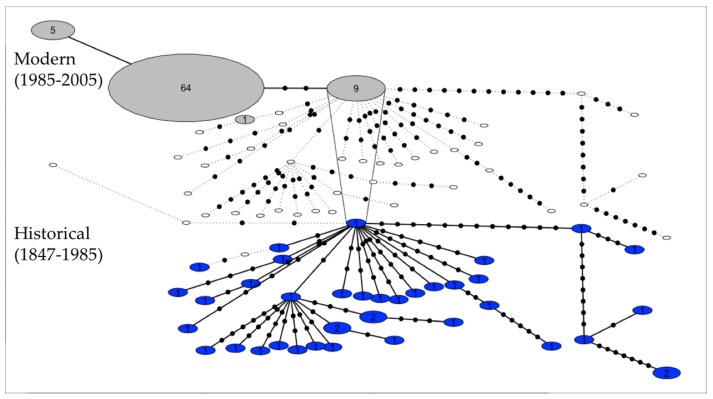
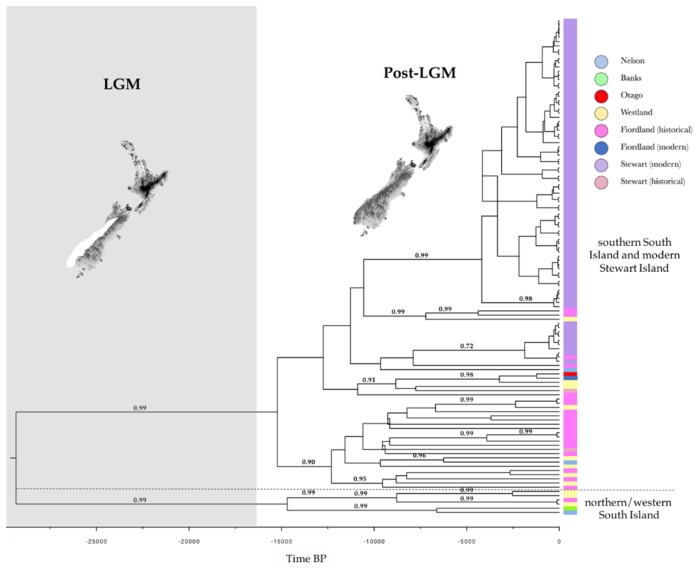
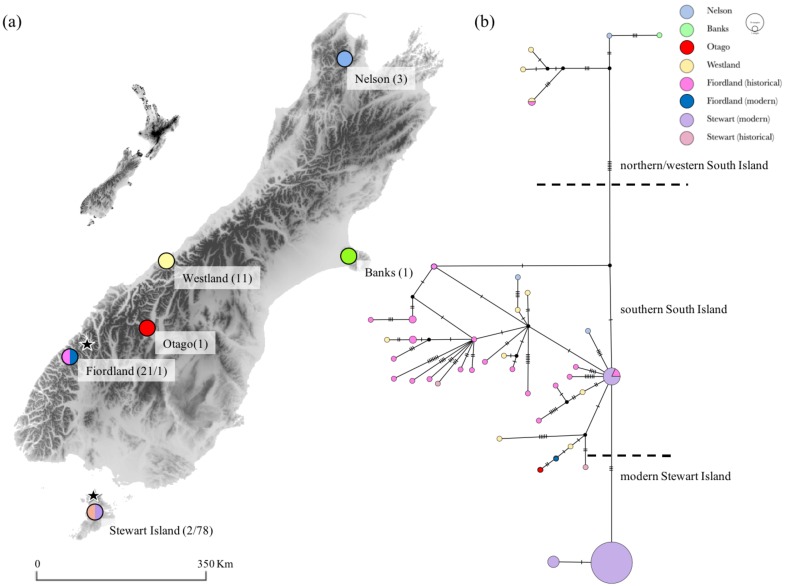
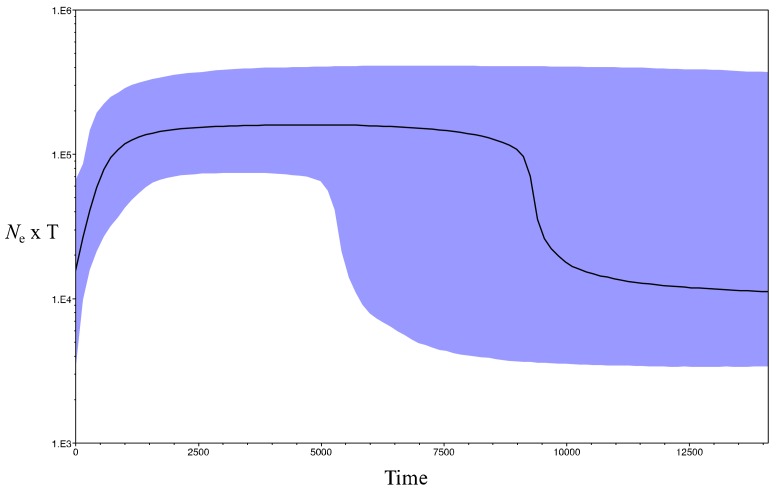
Understanding how species respond to population declines is a central question in conservation and evolutionary biology. Population declines are often associated with loss of genetic diversity, inbreeding and accumulation of deleterious mutations, which can lead to a reduction in fitness and subsequently contribute to extinction. Using temporal approaches can help us understand the effects of population declines on genetic diversity in real time. Sequencing pre-decline as well as post-decline mitogenomes representing all the remaining mitochondrial diversity, we estimated the loss of genetic diversity in the critically endangered kākāpō (Strigops habroptilus). We detected a signal of population expansion coinciding with the end of the Pleistocene last glacial maximum (LGM). Also, we found some evidence for northern and southern lineages, supporting the hypothesis that the species may have been restricted to isolated northern and southern refugia during the LGM. We observed an important loss of neutral genetic diversity associated with European settlement in New Zealand but we could not exclude a population decline associated with Polynesian settlement in New Zealand. However, we did not find evidence for fixation of deleterious mutations. We argue that despite high pre-decline genetic diversity, a rapid and range-wide decline combined with the lek mating system, and life-history traits of kākāpō contributed to a rapid loss of genetic diversity following severe population declines.
Keywords: bottleneck; endemic; expansion; genetic diversity; historical DNA; mitogenome.
Conflict of interest statement
The authors declare no conflict of interest.
Figures
References
-
- Jamieson I.G. Has the debate over genetics and extinction of island endemics truly been resolved? Anim. Conserv. 2007;10:139–144. doi: 10.1111/j.1469-1795.2006.00095.x. - DOI
-
- Palkopoulou E., Mallick S., Skoglund P., Enk J., Rohland N., Li H., Omrak A., Vartanyan S., Poinar H., Götherström A., et al. Complete genomes reveal signatures of demographic and genetic declines in the woolly mammoth. Curr. Biol. 2015;25:1395–1400. doi: 10.1016/j.cub.2015.04.007. - DOI - PMC - PubMed
LinkOut - more resources
Full Text Sources
Other Literature Sources
