. 2018 Aug;39(8):3428-3448.
doi: 10.1002/hbm.24186. Epub 2018 Apr 19.

Effects of SYN1Q555X mutation on cortical gray matter microstructure

Affiliations

Effects of SYN1Q555X mutation on cortical gray matter microstructure

Jean-François Cabana et al. Hum Brain Mapp. 2018 Aug.

Abstract

A new Q555X mutation on the SYN1 gene was recently found in several members of a family segregating dyslexia, epilepsy, and autism spectrum disorder. To describe the effects of this mutation on cortical gray matter microstructure, we performed a surface-based group study using novel diffusion and quantitative multiparametric imaging on 13 SYN1Q555X mutation carriers and 13 age- and sex-matched controls. Specifically, diffusion kurtosis imaging (DKI) and neurite orientation and dispersion and density imaging (NODDI) were used to analyze multi-shell diffusion data and obtain parametric maps sensitive to tissue structure, while quantitative metrics sensitive to tissue composition (T1, T2* and relative proton density [PD]) were obtained from a multi-echo variable flip angle FLASH acquisition. Results showed significant microstructural alterations in several regions usually involved in oral and written language as well as dyslexia. The most significant changes in these regions were lowered mean diffusivity and increased fractional anisotropy. This study is, to our knowledge, the first to successfully use diffusion imaging and multiparametric mapping to detect cortical anomalies in a group of subjects with a well-defined genotype linked to language impairments, epilepsy and autism spectrum disorder (ASD).

Keywords: MRI; adult; autism; cortex; dyslexia; epilepsy; genetics.


Conflict of interest statement

Guillaume Gilbert receives salary from Philips Healthcare for work outside of the scope of this study.

Figures

Figure 1
Figure 1
Family pedigree. Circles: female subjects, squares: male subjects. Filled symbols show SYN1Q555x carriers
Figure 2
Figure 2
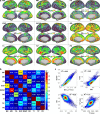
Group‐averaged parametric maps. (a) Mean parametric maps for all 26 subjects. (b) Across cortex vertex‐wise correlation coefficient between each metric pair. The matrix is color‐coded with respect to the R2 determination coefficient, and numbers on the figure are the Pearson r coefficients. (c) Vertex‐wise scatter plots of the four most correlated metric pairs, color‐coded by density [Color figure can be viewed at http://wileyonlinelibrary.com]
Figure 3
Figure 3
Non‐parametric combination statistics of all metrics, showing clusters of significant differences between SYN1Q555X and control groups. FDR‐corrected p values are shown as −log(p), from p = .05 (blue) to p = .01 (red). Clusters of FDR‐corrected p value ≤ .05 and area ≥50 mm2 are identified with a black border and a number used throughout this article. Grayscale background image represents the group‐averaged curvature map, that is sulcus in light gray and gyrus in dark gray. (a) Lateral‐medial view on inflated, group‐averaged surfaces; (b) antero‐posterior oblique view [Color figure can be viewed at http://wileyonlinelibrary.com]
Figure 4
Figure 4
FDR‐corrected NPC results, excluding the NODDI parametric maps from the analyses, presented on (a) lateral‐medial view on inflated, group‐averaged surfaces and (b) antero‐posterior oblique view. Note that the black borders shown on this figure are the same as Figure 3, that is they represent the clusters of significant cortical alterations, as found by the NPC analysis on all data, including NODDI [Color figure can be viewed at http://wileyonlinelibrary.com]
Figure 5
Figure 5
FDR‐corrected NPC results, excluding the NODDI parametric maps from the analyses, and excluding one more metric at a time. Color scale represents −log(p) [Color figure can be viewed at http://wileyonlinelibrary.com]
Figure 6
Figure 6
Detailed results on the clusters identified above. Numbers on x‐axis represent clusters number. One‐tailed statistics for all metrics, displayed as −log(p FDR). Blue: SYN1Q555X < control; Red: SYN1Q555X > control. Results for p FDR < .05 and p FDR < .005 are highlighted with dashed and solid lines respectively [Color figure can be viewed at http://wileyonlinelibrary.com]
Figure 7
Figure 7
Analysis of mean values over all the identified clusters taken as a single ROI. Data points represent mean values for each participant. On each box, the center mark indicates the median value, and the top and bottom edges indicate the 25th and 75th percentiles, respectively, while whiskers extend to extreme values not considered outliers. Stars and lines show significant results of the two‐tailed t test at *p < .05, **p < .01, ***p < .001
Figure 8
Figure 8
Microstructure characteristics of typical readers and dyslexic subjects. Data represents mean values across all identified clusters. HC: healthy control subjects; Q555X‐noD: subjects carriers of the SYN1Q555x mutation, but not affected by dyslexia; Q555X‐Dys: subjects carriers of the SYN1Q555x mutation and diagnosed with dyslexia
Figure 9
Figure 9
Gender‐based group differences. Data represents the mean value across all identified clusters for each subject, separated by gender and by group (control vs. SYN1Q555x). On each box, the center mark indicates the median value, and the top and bottom edges indicate the 25th and 75th percentiles, respectively. Whiskers extend to extreme values not considered outliers. Lines and stars above box pairs indicate a significant difference was found (*p < .05, **p < .01, ***p < .001) on a two‐tail t test
Figure 10
Figure 10
Results of the leave‐one‐out analysis on the ROI data. Stars indicate the p value for each iteration of the test. Dashed line indicates the p = .05 level. Note that results for MD and ISOVF were all equal to p = .0001, which is the limit achievable in the test performed with 10,000 permutations
Figure 11
Figure 11
Results of the one‐tailed t test for structural metrics, shown as –log(p uncorr). Regions in blue represent SYN1Q555X < control, whereas regions in red represent SYN1Q555X > control. The black borders represent clusters of microstructural alterations, as identified previously (see Figure 3) [Color figure can be viewed at http://wileyonlinelibrary.com]
Figure 12
Figure 12
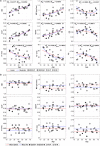
Whole cortex parametric maps mean values variation with age. Each data point represents the mean value over the whole cortex for an individual. (a) raw data, prior to regression of covariates. The linear (red) and quadratic (blue) relationship with age is displayed, and its R 2 value given in legend. (b) data after regression of covariates. Red and blue lines here represent the subjects and control group means [Color figure can be viewed at http://wileyonlinelibrary.com]
Figure 13
Figure 13
Results for the group comparison of subcortical gray matter structures. ac: accumbens, am.: amigdala, ca.: caudate nuclei, hi.: hippocampus, pa.: globus pallidus, th: thalamus, L: left hemisphere, R: right hemisphere. (a) One‐tailed statistics for all metrics, displayed as −log(p FDR). Blue: SYN1Q555X < control; Red: SYN1Q555X > control. Results for p FDR < .05 are highlighted with solid lines. (b) NPC statistics. Color scale is displayed as −log(p FDR), and numbers on the figure show the actual p FDR value [Color figure can be viewed at http://wileyonlinelibrary.com]
Figure 14
Figure 14
Microstructural interpretation of diffusion results. (a) On a microscopic (cellular) scale, diffusion in the cortex is complex. Water molecules movement is restricted by the presence of barriers, which are mainly cell membranes of myelinated or unmyelinated neurites. Given the dense and complex structure of cortical gray matter, the mean diffusivity is quite low and mostly isotropic. (b) On a mesoscopic scale, diffusion is found to be sensitive to the layered cortical structure of radial (perpendicular to the cortex surface) and tangential (parallel to the surface) fibers. (c) On a macroscopic scale, that is at the resolution of the MRI experiment, diffusion metrics represent an average over the full cortex thickness. Increased density of radial and/or tangential fiber populations in variable proportions could explain the increase in FA and decrease in MD observed in the SYN1Q555X group. (d) A three‐compartment model demonstrates how a structure of thinner and more densely packed neurites can change various metrics, as observed in our data. In this model, ISOVF (in blue) is lowered, while ICVF (in red) is unchanged. The third compartment (=1 – (ISOVF + ICVF), in yellow) thus needs to increase. The increase in overall membrane surface area (black circles) increases the macromolecular protons fraction, which would lower the measurement of PD and T2*. (e) The increased population of neurites could also be explained by a model where the neurites morphology is unchanged, but occupy a larger volume fraction overall. In this model, the neuropil space is increased, which could be for example a result of increased space between minicolumn core, that is columns of dense cells soma. Assuming the NODDI intra‐cellular volume fraction correctly estimates the space occupied by neurites, this model would lead to increased ICVF, which is not observed in our data. However, the NODDI model still needs validation in the cortex and in pathology, and assuming that ICVF truly represents neurites is risky [Color figure can be viewed at http://wileyonlinelibrary.com]

References

    1. Andersson, J. L. R. , Skare, S. , & Ashburner, J. (2003). How to correct susceptibility distortions in spin‐echo echo‐planar images: Application to diffusion tensor imaging. NeuroImage, 20(2), 870–888. 10.1016/S1053-8119(03)00336‐7 - DOI - PubMed
    1. Andersson, J. L. R. , & Sotiropoulos, S. N. (2015). An integrated approach to correction for off‐resonance effects and subject movement in diffusion MR imaging. NeuroImage, 125, 1063–1078. 10.1016/j.neuroimage.2015.10.019 - DOI - PMC - PubMed
    1. Bailey, S. , Hoeft, F. , Aboud, K. , & Cutting, L. (2016). Anomalous gray matter patterns in specific reading comprehension deficit are independent of dyslexia. Annals of Dyslexia, 66(3), 256–274. 10.1007/s11881-015-0114-y - DOI - PMC - PubMed
    1. Baillieux, H. , Vandervliet, E. J. M. , Manto, M. , Parizel, P. M. , Deyn, P. P. D. , & Mariën, P. (2009). Developmental dyslexia and widespread activation across the cerebellar hemispheres. Brain and Language, 108(2), 122–132. 10.1016/j.bandl.2008.10.001 - DOI - PubMed
    1. Barquero, L. A. , Davis, N. , Cutting, L. E. , Tolvanen, A. , & Lyytinen, H. (2014). Neuroimaging of reading intervention: A systematic review and activation likelihood estimate meta‐analysis. PLoS ONE, 9(1), e83668 10.1371/journal.pone.0083668 - DOI - PMC - PubMed

Publication types

LinkOut - more resources