

Metabolism and Biodegradation of Spacecraft Cleaning Reagents by Strains of Spacecraft-Associated Acinetobacter
- PMID: 29672134
- PMCID: PMC6276816
- DOI: 10.1089/ast.2017.1814
Metabolism and Biodegradation of Spacecraft Cleaning Reagents by Strains of Spacecraft-Associated Acinetobacter
Abstract
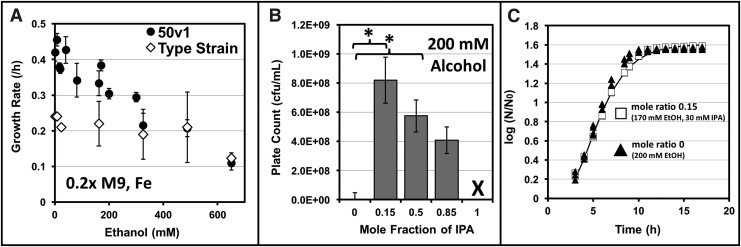
Spacecraft assembly facilities are oligotrophic and low-humidity environments, which are routinely cleaned using alcohol wipes for benchtops and spacecraft materials, and alkaline detergents for floors. Despite these cleaning protocols, spacecraft assembly facilities possess a persistent, diverse, dynamic, and low abundant core microbiome, where the Acinetobacter are among the dominant members of the community. In this report, we show that several spacecraft-associated Acinetobacter metabolize or biodegrade the spacecraft cleaning reagents of ethanol (ethyl alcohol), 2-propanol (isopropyl alcohol), and Kleenol 30 (floor detergent) under ultraminimal conditions. Using cultivation and stable isotope labeling studies, we show that ethanol is a sole carbon source when cultivating in 0.2 × M9 minimal medium containing 26 μM Fe(NH4)2(SO4)2. Although cultures expectedly did not grow solely on 2-propanol, cultivations on mixtures of ethanol and 2-propanol exhibited enhanced plate counts at mole ratios of ≤0.50. In support, enzymology experiments on cellular extracts were consistent with oxidation of ethanol and 2-propanol by a membrane-bound alcohol dehydrogenase. In the presence of Kleenol 30, untargeted metabolite profiling on ultraminimal cultures of Acinetobacter radioresistens 50v1 indicated (1) biodegradation of Kleenol 30 into products including ethylene glycols, (2) the potential metabolism of decanoate (formed during incubation of Kleenol 30 in 0.2 × M9), and (3) decreases in the abundances of several hydroxy- and ketoacids in the extracellular metabolome. In ultraminimal medium (when using ethanol as a sole carbon source), A. radioresistens 50v1 also exhibits a remarkable survival against hydrogen peroxide (∼1.5-log loss, ∼108 colony forming units (cfu)/mL, 10 mM H2O2), indicating a considerable tolerance toward oxidative stress under nutrient-restricted conditions. Together, these results suggest that the spacecraft cleaning reagents may (1) serve as nutrient sources under oligotrophic conditions and (2) sustain extremotolerances against the oxidative stresses associated with low-humidity environments. In perspective, this study provides a plausible biochemical rationale to the observed microbial ecology dynamics of spacecraft-associated environments.
Keywords: Acinetobacter; Bioburden; Cleaning; Extreme survival; Metabolism; Planetary protection; Spacecraft.
Conflict of interest statement
No competing financial interests exist.
Figures


Similar articles
-
Metabolomic and cultivation insights into the tolerance of the spacecraft-associated Acinetobacter toward Kleenol 30, a cleanroom floor detergent.Front Microbiol. 2023 Mar 6;14:1090740. doi: 10.3389/fmicb.2023.1090740. eCollection 2023. Front Microbiol. 2023. PMID: 36950167 Free PMC article.
-
Characterization of hydrogen peroxide-resistant Acinetobacter species isolated during the Mars Phoenix spacecraft assembly.Astrobiology. 2014 Oct;14(10):837-47. doi: 10.1089/ast.2014.1193. Epub 2014 Sep 22. Astrobiology. 2014. PMID: 25243569
-
Insights into the extremotolerance of Acinetobacter radioresistens 50v1, a gram-negative bacterium isolated from the Mars Odyssey spacecraft.Astrobiology. 2012 Sep;12(9):854-62. doi: 10.1089/ast.2012.0835. Epub 2012 Aug 23. Astrobiology. 2012. PMID: 22917036
-
Purification, biochemical characterization, and implications of an alkali-tolerant catalase from the spacecraft-associated and oxidation-resistant Acinetobacter gyllenbergii 2P01AA.Astrobiology. 2015 Apr;15(4):291-300. doi: 10.1089/ast.2014.1242. Epub 2015 Mar 31. Astrobiology. 2015. PMID: 25826195
-
Genomic insights into novel extremotolerant bacteria isolated from the NASA Phoenix mission spacecraft assembly cleanrooms.Microbiome. 2025 May 12;13(1):117. doi: 10.1186/s40168-025-02082-1. Microbiome. 2025. PMID: 40350519 Free PMC article.
Cited by
-
Impact of a bacterial consortium on the soil bacterial community structure and maize (Zea mays L.) cultivation.Sci Rep. 2021 Jun 22;11(1):13092. doi: 10.1038/s41598-021-92517-0. Sci Rep. 2021. PMID: 34158574 Free PMC article.
-
Bacterial and fungal bioburden reduction on material surfaces using various sterilization techniques suitable for spacecraft decontamination.Front Microbiol. 2023 Dec 13;14:1253436. doi: 10.3389/fmicb.2023.1253436. eCollection 2023. Front Microbiol. 2023. PMID: 38152378 Free PMC article.
-
Metabolomic and cultivation insights into the tolerance of the spacecraft-associated Acinetobacter toward Kleenol 30, a cleanroom floor detergent.Front Microbiol. 2023 Mar 6;14:1090740. doi: 10.3389/fmicb.2023.1090740. eCollection 2023. Front Microbiol. 2023. PMID: 36950167 Free PMC article.
-
Microbiome dynamics during the HI-SEAS IV mission, and implications for future crewed missions beyond Earth.Microbiome. 2021 Jan 24;9(1):27. doi: 10.1186/s40168-020-00959-x. Microbiome. 2021. PMID: 33487169 Free PMC article.
-
Prokaryotic and Fungal Characterization of the Facilities Used to Assemble, Test, and Launch the OSIRIS-REx Spacecraft.Front Microbiol. 2020 Nov 5;11:530661. doi: 10.3389/fmicb.2020.530661. eCollection 2020. Front Microbiol. 2020. PMID: 33250861 Free PMC article.
References
-
- Barding G.A., Jr, Béni S., Fukao T., Bailey-Serres J., and Larive C.K. (2013) Comparison of GC-MS and NMR for metabolite profiling of rice subjected to submergence stress. J Proteome Res 12:898–909 - PubMed
-
- Barengoltz J.B. (1997) Microbiological cleanliness of the Mars Pathfinder spacecraft, Los Angeles, California, USA. Available online at http://hdl.handle.net/2014/21747
-
- Begot C., Desnier I., Daudin J.D., Labadie J.C., and Lebert A. (1996) Recommendations for calculating growth parameters by optical density measurements. J Microbiol Methods 25:225–232
Publication types
MeSH terms
Substances
LinkOut - more resources
Full Text Sources
Other Literature Sources
Molecular Biology Databases