Meta-Analysis
. 2018 Apr 19;16(4):e2004956.
doi: 10.1371/journal.pbio.2004956. eCollection 2018 Apr.

The gender gap in science: How long until women are equally represented?

Affiliations
Meta-Analysis

The gender gap in science: How long until women are equally represented?

Luke Holman et al. PLoS Biol. .

Abstract

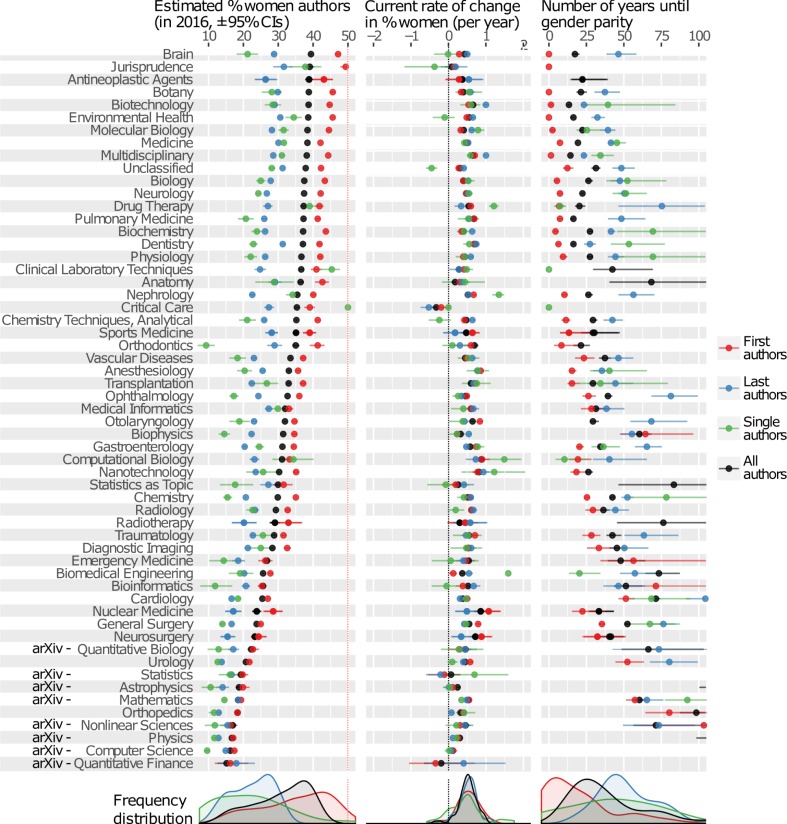
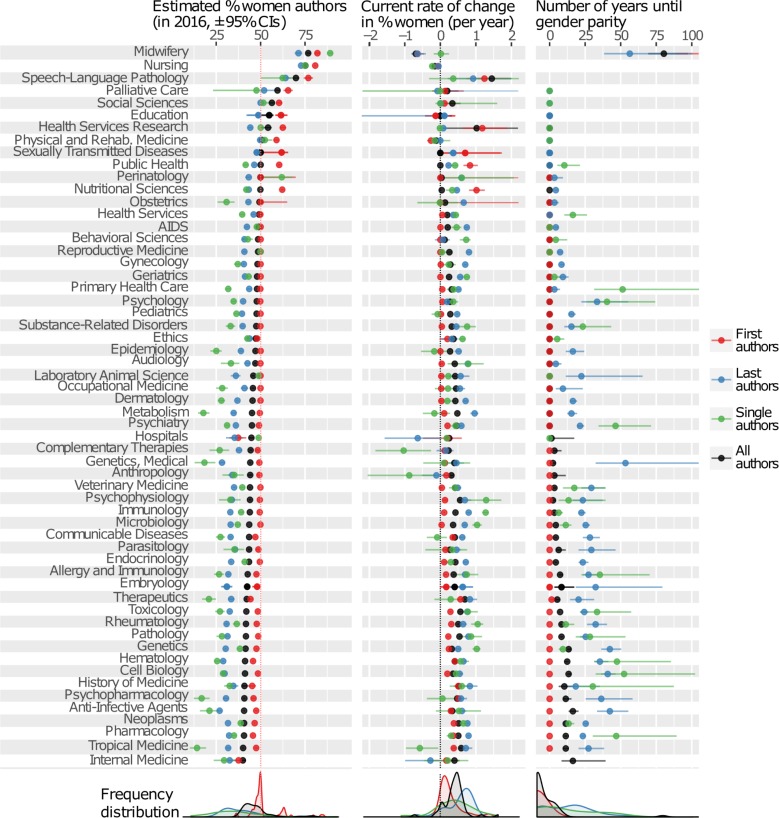
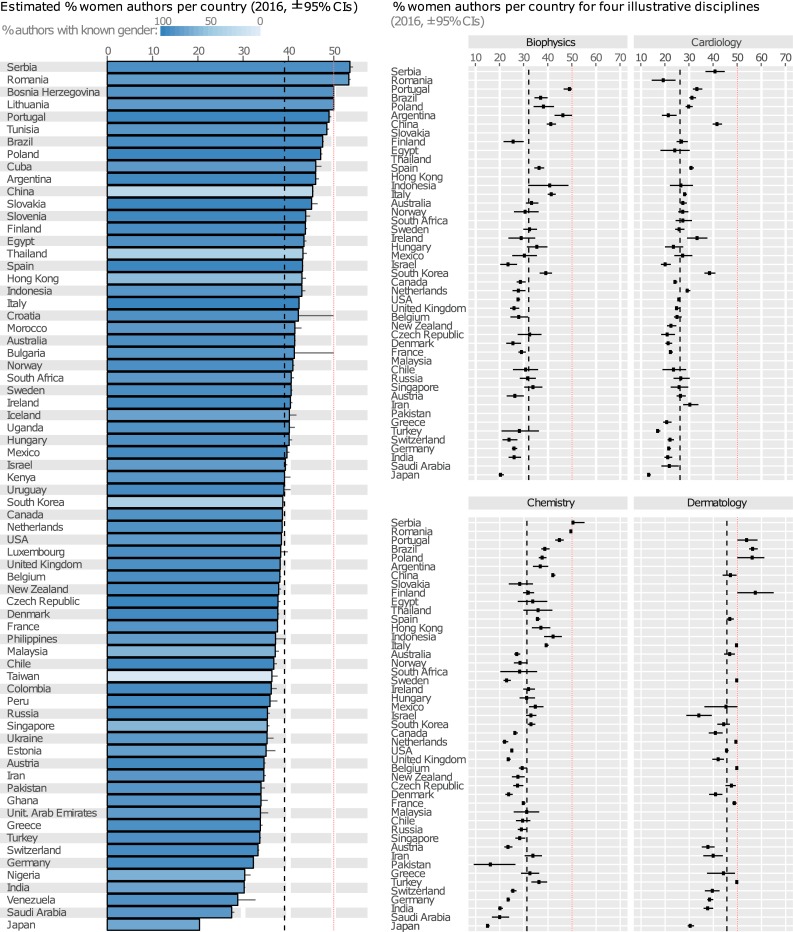
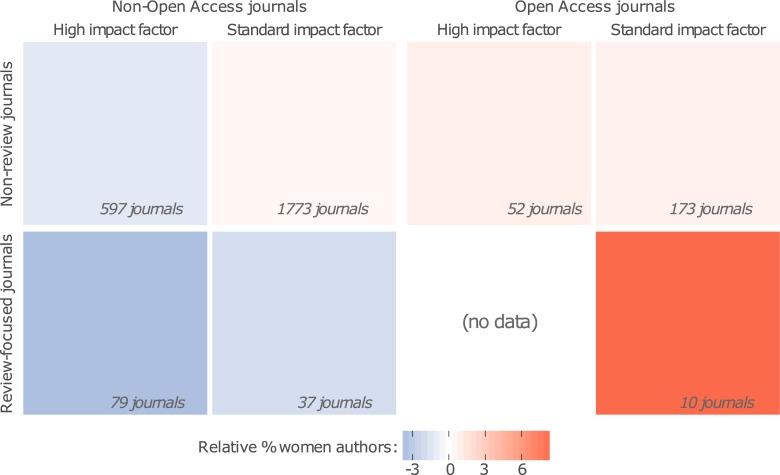
Women comprise a minority of the Science, Technology, Engineering, Mathematics, and Medicine (STEMM) workforce. Quantifying the gender gap may identify fields that will not reach parity without intervention, reveal underappreciated biases, and inform benchmarks for gender balance among conference speakers, editors, and hiring committees. Using the PubMed and arXiv databases, we estimated the gender of 36 million authors from >100 countries publishing in >6000 journals, covering most STEMM disciplines over the last 15 years, and made a web app allowing easy access to the data (https://lukeholman.github.io/genderGap/). Despite recent progress, the gender gap appears likely to persist for generations, particularly in surgery, computer science, physics, and maths. The gap is especially large in authorship positions associated with seniority, and prestigious journals have fewer women authors. Additionally, we estimate that men are invited by journals to submit papers at approximately double the rate of women. Wealthy countries, notably Japan, Germany, and Switzerland, had fewer women authors than poorer ones. We conclude that the STEMM gender gap will not close without further reforms in education, mentoring, and academic publishing.


Conflict of interest statement

The authors have declared that no competing interests exist.

Figures

Fig 1
Fig 1. The panels show the current author gender ratio, its rate of change per year, and the estimated number of years until the gender ratio comes within 5% of parity (all parameters estimated by fitting Eq 1 to the data using maximum likelihood).
The colours correspond to different authorship positions, and the error bars show 95% confidence intervals estimated by bootstrapping. For clarity, the x-axis of the third panel is truncated at 100 years. Missing data in the third panel indicate either: A) the field is never projected to reach parity, B) parity is projected to be reached in >100 years, or C) the data do not allow us to ascertain whether the percentage of women authors is presently rising or falling (full details in S1 Data). The eight disciplines using data from arXiv are marked, and the remaining disciplines are from PubMed. The data underlying this figure can be found in S1 Data.
Fig 2
Fig 2. The same information as in Fig 1, for the remaining research disciplines.
The data underlying this figure can be found in S1 Data.
Fig 3
Fig 3. Estimated percentage of woman authors in 2016, across all authorship positions, classified by country/territory of affiliation.
The dashed line shows the overall percentage of women authors across all countries, while the red line marks gender parity. Light-coloured bars indicate countries where a high proportion of authors’ genders could not be inferred from their names; gender ratios for these countries could conceivably be inaccurate (see S20 Fig). The right-hand panels show the gender ratio within four illustrative research disciplines (S10–S15 Figs show the remainder) for the 50 countries with the largest sample size, illustrating that the ordering of countries remains broadly similar within most research disciplines. The data underlying this figure can be found in S2 Data.
Fig 4
Fig 4. Average effects of journal impact factor, and of being a review-focused journal or OA journal, on the frequency of women authors.
The colour shows the relative frequency of women authors (i.e., percentage of women authors in the journal, minus the percentage of women authors for the discipline to which that journal belongs), averaged across journals of each type. Thus, bluer (redder) squares denote journal types with an excess of men (women) authors after controlling for differences in gender ratio across disciplines. For illustrative purposes, ‘High impact’ journals are defined here as those with an impact factor in the top 25% for their discipline (although impact factor was treated as a continuous variable during statistical analysis; S5 Table). Inset numbers give the number of journals used to calculate the average relative gender ratios. The data underlying this figure can be found in S1 Data. OA, Open-Access.

Comment in

References

    1. National Academy of Science. Beyond Bias and Barriers: Fulfilling and Potential of Women in Academic Science and Engineering. Washington DC: National Academies Press; 2006. - PubMed
    1. Shaw AK, Stanton DE. Leaks in the pipeline: separating demographic inertia from ongoing gender differences in academia. Proc Roy Soc B. 2012;279: 3736–3741. - PMC - PubMed
    1. Sheltzer JM, Smith JC. Elite male faculty in the life sciences employ fewer women. PNAS. 2014;111: 10107–10112. doi: 10.1073/pnas.1403334111 - DOI - PMC - PubMed
    1. Ioannidis JPA. How to make more published research true. PLoS Med. 2014;11: e1001747 doi: 10.1371/journal.pmed.1001747 - DOI - PMC - PubMed
    1. West JD, Jacquet J, King MM, Correll SJ, Bergstrom CT. The role of gender in scholarly authorship. PLoS ONE. Public Library of Science; 2013;8: e66212 doi: 10.1371/journal.pone.0066212 - DOI - PMC - PubMed

Publication types

LinkOut - more resources