

Effects of fatiguing, submaximal high- versus low-torque isometric exercise on motor unit recruitment and firing behavior
- PMID: 29673119
- PMCID: PMC5907942
- DOI: 10.14814/phy2.13675
Effects of fatiguing, submaximal high- versus low-torque isometric exercise on motor unit recruitment and firing behavior
Abstract
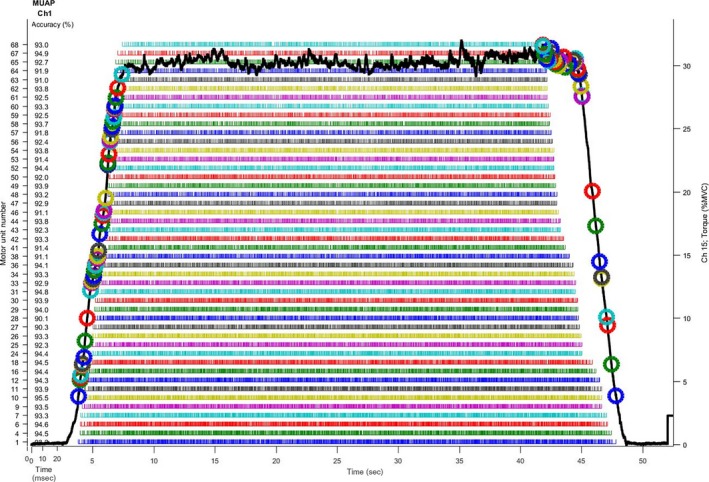
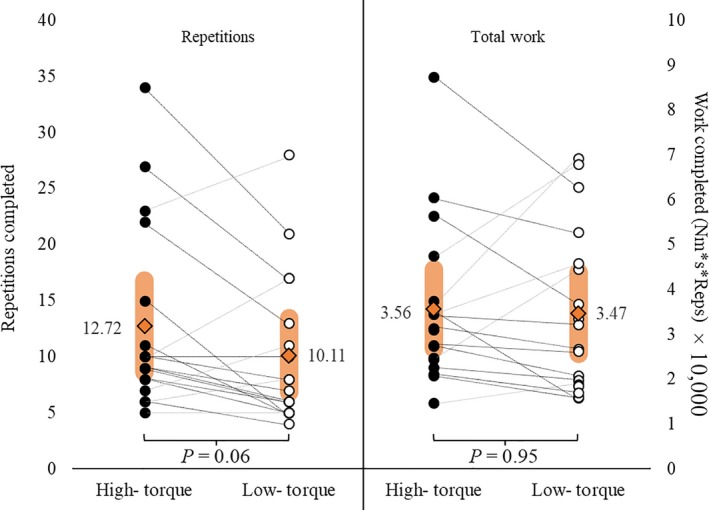
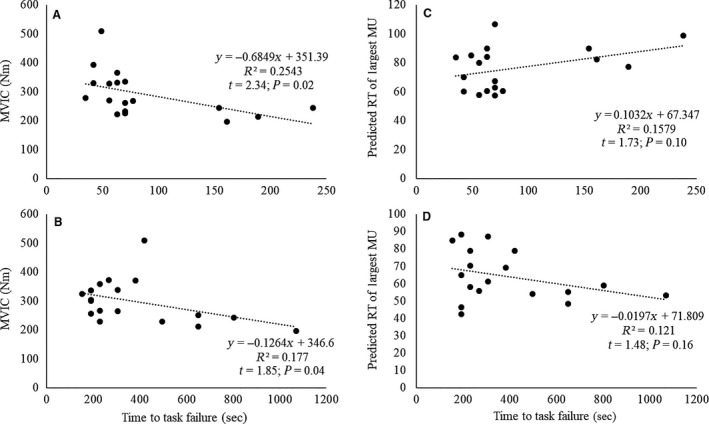
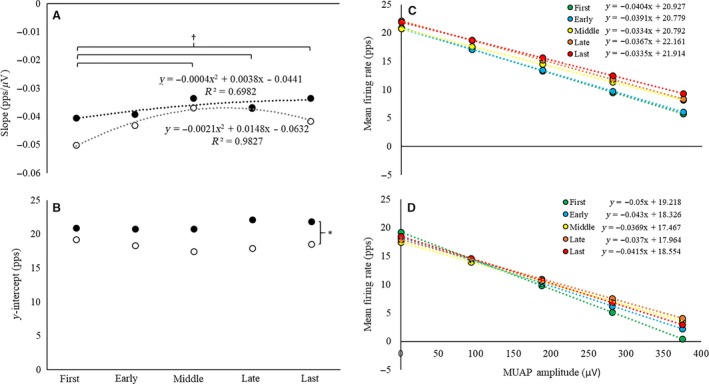
The purpose of this investigation was to evaluate the effects of repeated, high- (HT: 70% MVIC) versus low-torque (LT: 30% MVIC) isometric exercise performed to failure on motor unit (MU) recruitment and firing behavior of the vastus lateralis. Eighteen resistance-trained males (23.1 ± 3.8 years) completed familiarization, followed by separate experimental sessions in which they completed either HT or LT exercise to failure in random order. LT exercise resulted in a greater time to task failure and a more dramatic decline in the muscle's force capacity, but the total work completed was similar for HT and LT exercise. An examination of the firing trains from 4670 MUs recorded during exercise revealed that firing rates generally increased during HT and LT exercise, but were higher during HT than LT exercise. Furthermore, recruitment thresholds (RT) did not significantly change during HT exercise, whereas the RT of the smallest MUs increased and the RT for the moderate to large MUs decreased during LT exercise. Both HT and LT exercise resulted in the recruitment of additional higher threshold MUs in order to maintain torque production. However, throughout exercise, HT required the recruitment of larger MUs than did LT exercise. In a few cases, however, MUs were recruited by individuals during LT exercise that were similar in size and original (pre) RT to those detected during HT exercise. Thus, the ability to achieve full MU recruitment during LT exercise may be dependent on the subject. Consequently, our data emphasize the task and subject dependency of muscle fatigue.
Keywords: Firing Rate; Motor Unit Action Potential Amplitude; Muscle Fatigue; Recruitment Threshold; sEMG Decomposition.
© 2018 The Authors. Physiological Reports published by Wiley Periodicals, Inc. on behalf of The Physiological Society and the American Physiological Society.
Figures
Similar articles
-
The effect of rate of torque development on motor unit recruitment and firing rates during isometric voluntary trapezoidal contractions.Exp Brain Res. 2019 Oct;237(10):2653-2664. doi: 10.1007/s00221-019-05612-0. Epub 2019 Aug 8. Exp Brain Res. 2019. PMID: 31396644
-
Impact of Fatiguing, Submaximal High- vs. Low-Torque Isometric Exercise on Acute Muscle Swelling, and Echo Intensity in Resistance-Trained Men.J Strength Cond Res. 2019 Apr;33(4):1007-1019. doi: 10.1519/JSC.0000000000003033. J Strength Cond Res. 2019. PMID: 30789573
-
Motor unit action potential amplitudes and firing rates during repetitive muscle actions of the first dorsal interosseous in children and adults.Eur J Appl Physiol. 2019 Apr;119(4):1007-1018. doi: 10.1007/s00421-019-04090-0. Epub 2019 Feb 15. Eur J Appl Physiol. 2019. PMID: 30771058
-
An examination of a potential organized motor unit firing rate and recruitment scheme of an antagonist muscle during isometric contractions.J Neurophysiol. 2021 Jun 1;125(6):2094-2106. doi: 10.1152/jn.00034.2021. Epub 2021 Apr 28. J Neurophysiol. 2021. PMID: 33909509
-
Skeletal muscle fatigue and decreased efficiency: two sides of the same coin?Exerc Sport Sci Rev. 2015 Apr;43(2):75-83. doi: 10.1249/JES.0000000000000043. Exerc Sport Sci Rev. 2015. PMID: 25688762 Review.
Cited by
-
Loading Recommendations for Muscle Strength, Hypertrophy, and Local Endurance: A Re-Examination of the Repetition Continuum.Sports (Basel). 2021 Feb 22;9(2):32. doi: 10.3390/sports9020032. Sports (Basel). 2021. PMID: 33671664 Free PMC article. Review.
-
Differential training benefits and motor unit remodeling in wrist force precision tasks following high and low load blood flow restriction exercises under volume-matched conditions.J Neuroeng Rehabil. 2024 Jul 19;21(1):123. doi: 10.1186/s12984-024-01419-5. J Neuroeng Rehabil. 2024. PMID: 39030574 Free PMC article. Clinical Trial.
-
Fiber-Type-Specific Hypertrophy with the Use of Low-Load Blood Flow Restriction Resistance Training: A Systematic Review.J Funct Morphol Kinesiol. 2023 Apr 27;8(2):51. doi: 10.3390/jfmk8020051. J Funct Morphol Kinesiol. 2023. PMID: 37218848 Free PMC article. Review.
-
The influence of high-load and combined high- and low-load resistance training on electromyographic behavior during an absolute muscular endurance task.Eur J Appl Physiol. 2025 Jun 24. doi: 10.1007/s00421-025-05849-4. Online ahead of print. Eur J Appl Physiol. 2025. PMID: 40553125
-
Increases in motor unit action potential amplitudes are related to muscle hypertrophy following eight weeks of high-intensity exercise training in females.Eur J Sport Sci. 2021 Oct;21(10):1403-1413. doi: 10.1080/17461391.2020.1836262. Epub 2020 Nov 10. Eur J Sport Sci. 2021. PMID: 33043836 Free PMC article.
References
-
- Adam, A. , and De Luca C. J.. 2003. Recruitment order of motor units in human vastus lateralis muscle is maintained during fatiguing contractions. J. Neurophysiol. 90:2919–2927. - PubMed
-
- Adam, A. , and De Luca C. J.. 2005. Firing rates of motor units in human vastus lateralis muscle during fatiguing isometric contractions. J. Appl. Physiol. 99:268–280. - PubMed
-
- Alkner, B. A. , Tesch P. A., and Berg H. E.. 2000. Quadriceps EMG/force relationship in knee extension and leg press. Med. Sci. Sports Exerc. 32:459–463. - PubMed
Publication types
MeSH terms
LinkOut - more resources
Full Text Sources
Other Literature Sources
Medical
Research Materials
