. 2018 Jun;7(6):2472-2484.
doi: 10.1002/cam4.1496. Epub 2018 Apr 19.

Overexpression of HACE1 in gastric cancer inhibits tumor aggressiveness by impeding cell proliferation and migration

Affiliations

Overexpression of HACE1 in gastric cancer inhibits tumor aggressiveness by impeding cell proliferation and migration

Ying-Ling Chen et al. Cancer Med. 2018 Jun.

Abstract

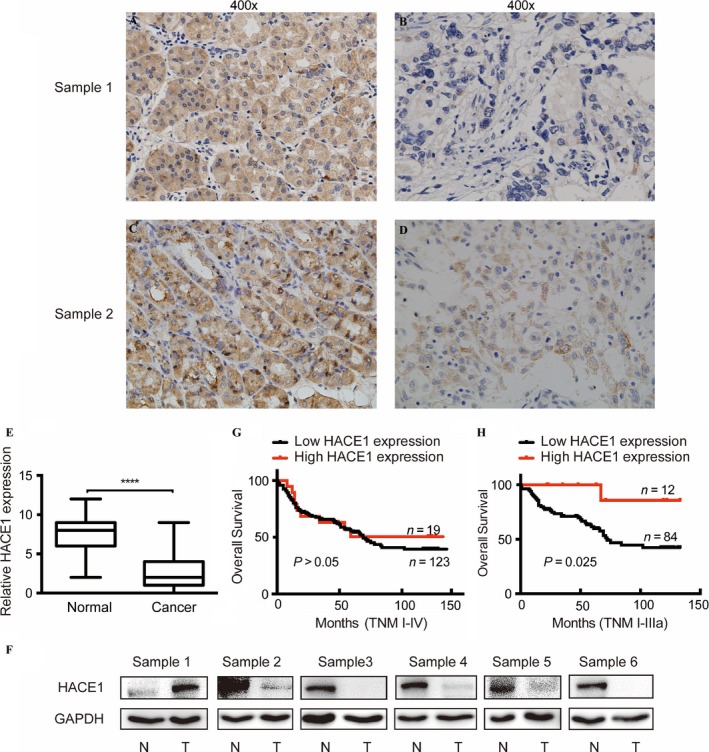
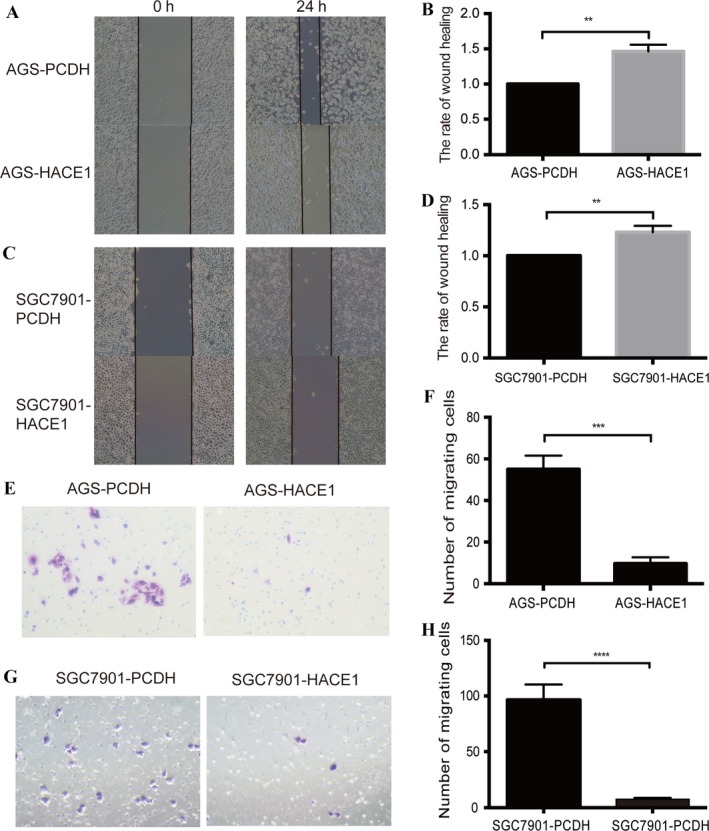
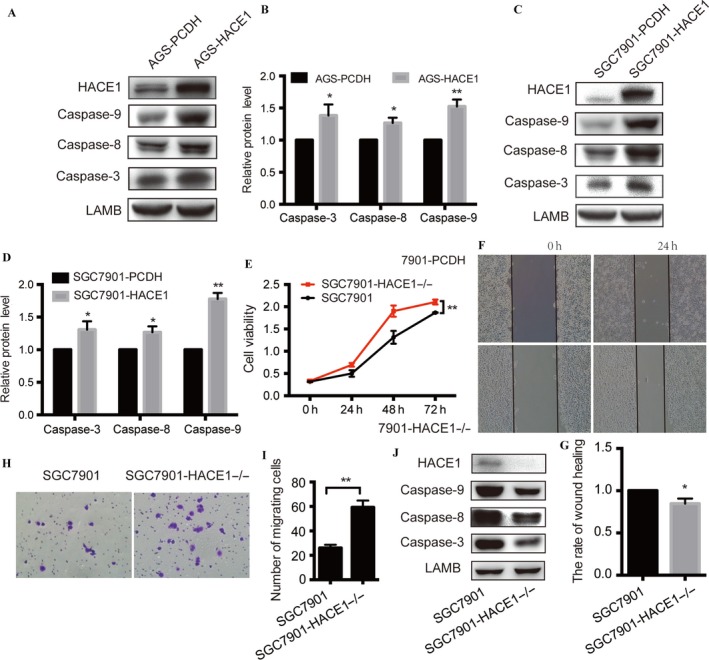
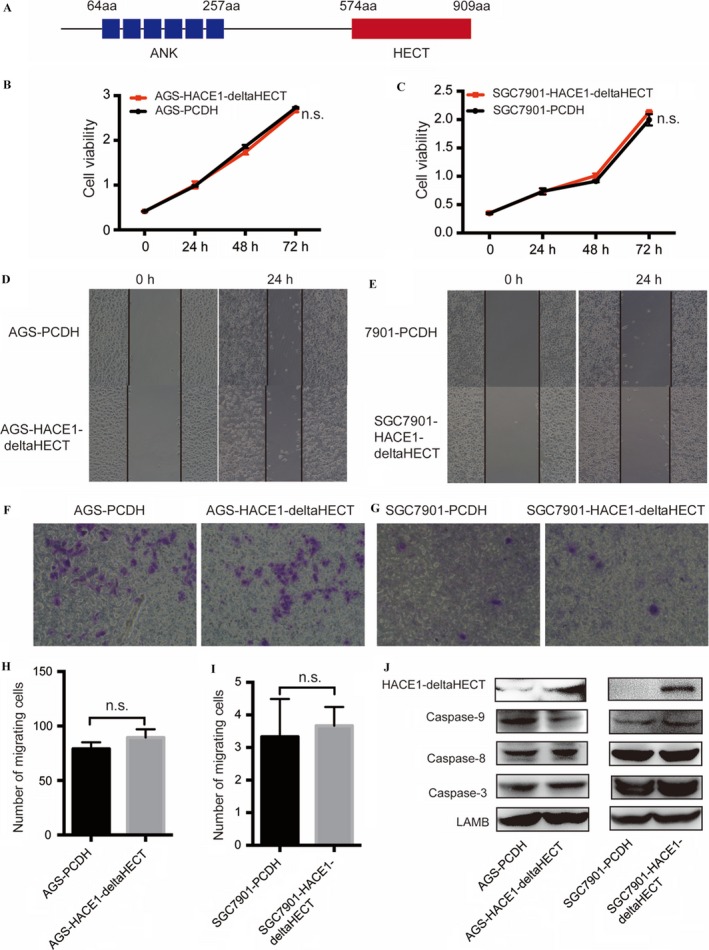
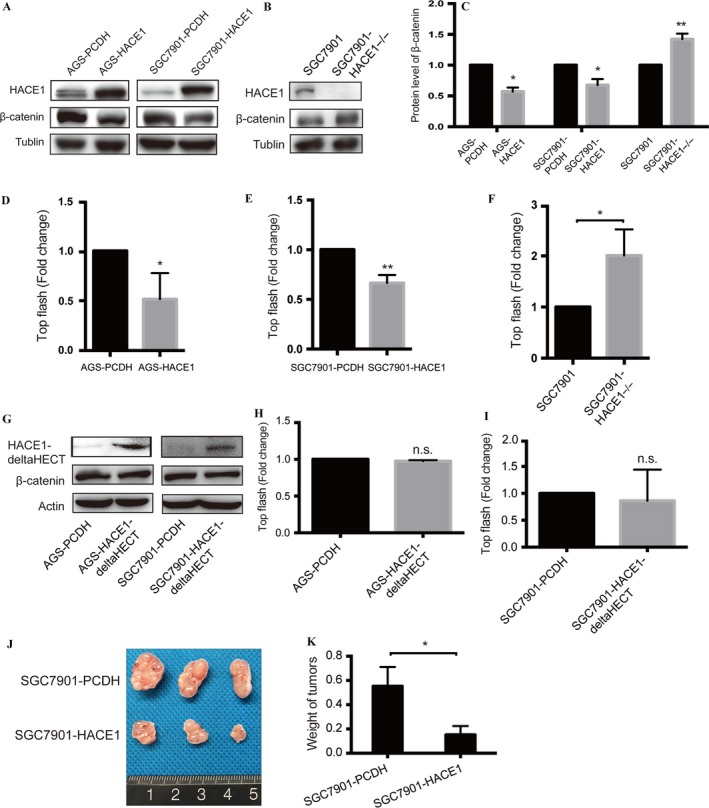
HACE1 E3 ligase was discovered to be down-regulated in several cancers while its role in regulating tumors was merely understood. This study aimed to explore the specific effect of HACE1 played in gastric tumorigenesis and its potential mechanism. HACE1's expression was found significantly lower in gastric cancer tissues compared with the adjacent normal tissues (P < 0.001). Its protein level in gastric cancer negatively correlated to tumor pathological differentiation (P = 0.019). And in gastric cancer patients with TNM I-IIIa, those with lower HACE1 protein level had poorer overall survival (P = 0.025). Studies, in vivo and in vitro, showed that overexpressing HACE1 inhibited tumor proliferation and migration, and enhanced cell apoptosis. Besides, ectopic expression of HACE1 down-regulated the protein level of β-catenin and inhibited the activity of the Wnt/β-catenin signaling pathway. All the cellular functions were abolished when we overexpressed inactive HACE1-deltaHECT. Above all, we demonstrated that HACE1 E3 ligase played a suppressive role in gastric tumorigenesis and inhibited the activity of the Wnt/β-catenin signaling pathway. Circumventing the decline of HACE1 in early stage of carcinoma may impede the tumorigenesis and malignant process of gastric cancer.

Keywords: Gastric cancer; HACE1; Wnt/β-catenin pathway; migration; proliferation.


Figures

Figure 1
Figure 1
HACE1 expression levels in clinical gastric cancer tissues and adjacent normal tissues, and its correlation to survival of patients with gastric cancer. (A, B) Images of immunohistochemical (IHC) detection of HACE1 expression in sample 1. (A) Adjacent normal tissues: strong staining (400×). (B) Cancer tissues: light staining (400×). (C, D) Immunohistochemical detection of HACE1 expression in sample 2. (C) Adjacent normal tissues: strong staining (400×). (D) Cancer tissues: medium staining (400×). (E) Protein levels of HACE1 measured by IHC. IHC scores of HACE1 were calculated as the staining intensity (0, 1, 2, or 3) multiplied by the staining extent (0–100%). (F) The Western blot of HACE1 protein level in different pair of clinical gastric tissues. N: normal; T: tumor. (G) Kaplan–Meier curve analysis of HACE1 expression levels with overall survival time of 142 patients with gastric cancer by the log‐rank test. (H) Kaplan–Meier curve analysis of HACE1 expression levels with overall survival time of gastric cancer patients with TNM ranging from I to IIIa stages (****< 0.0001).
Figure 2
Figure 2
The expression level of HACE1 in gastric cancer cell lines. (A) Detection of HACE1 protein in six gastric cancer cell lines compared with human normal gastric tissues by means of Western blot. (B) The mRNA levels of HACE1 in gastric cancer cell lines and human normal gastric tissues were calculated by qRTPCR. (C) The HACE1 protein levels in gastric cancer cell lines with or without infection of lentivirus carrying HACE1. (D) The mRNA levels of HACE1 in gastric cancer cell lines with or without infection of lentivirus carrying HACE1. All experiments were conducted in triplicates. Error bars, SD of the mean and statistical comparisons were performed using unpaired t‐tests (*< 0.05; **< 0.01; ***< 0.001).
Figure 3
Figure 3
The influence of HACE1 expression on cell proliferation of gastric cancer cell lines. (A, B) Effect of overexpression of HACE1 in AGS and SGC7901 on cell growth. The number of cells was measured in samples at 0, 24, 48, and 72 h separately by means of CCK‐8 which was detected under 450 nm. (C, E) The pictures of colonies of AGS and SGC7901 with or without overexpression of HACE1. Cells were stained with 0.2% crystal violet. The OD values (D, F) were detected at 589 nm after dissolved by 3% ethylic acid. All experiments were replicated by three times. Error bars, SD of the mean and statistical comparisons were performed using Student's t‐tests (**< 0.01; ***< 0.001; ****< 0.0001).
Figure 4
Figure 4
Impact of HACE1 expression on cell migration of gastric cancer cell lines in vitro. (A, C) Impact of HACE1 overexpression on cell migration by means of wound‐healing assay in AGS and SGC7901. The pictures were taken at 0 and 24 h, respectively (200×). (B, D) The rates of the width of each scratch. The rate of wound healing = (the wound width of 24 h/ wound width of 0 h) × 100%. (E, G) The images of migrating cells of AGS and SGC7901 were taken after infecting the samples with lentivirus carrying HACE1 (400×). After 24 h in Transwell assay, the number of cells migrating to the lower chamber was calculated and analyzed separately (F, H). All experiments were performed in triplicates. Error bars, SD of the mean and statistical comparisons were performed using Student's t‐tests (**< 0.01; ***< 0.001; ****< 0.0001).
Figure 5
Figure 5
HACE1 induces cell apoptosis and the effect of HACE1 deletion in gastric cancer cell lines. (A–D) Overexpression of HACE1 in AGS and SGC7901 elevated caspase‐9, caspase‐8, and caspase‐3 protein levels. (E) Effect of HACE1 deletion in SGC7901 on cell growth. The number of cells was measured in samples at 0, 24, 48, and 72 h separately by means of CCK‐8 which was detected under 450 nm. (F) Pictures of HACE1 knockout on cell migration by means of wound‐healing assay in SGC7901. The pictures were taken at 0 and 24 h, respectively (200×). (G) The rate of the width of each scratch. The rate of wound healing = (the wound width of 24 h/ wound width of 0 h) × 100%. (H) The images of migrating cells of SGC7901 with HACE1 knocked out were taken after 24 h in Transwell assay. (I) The number of SGC7901 cells migrating to the lower chamber. (J) Protein levels of caspase‐9, caspase‐8, and caspase‐3 in SGC7901 cells with or without HACE1 deletion. (*< 0.05; **< 0.01).
Figure 6
Figure 6
Effect of inactive HACE1 on gastric cell lines. (A) Picture of HACE1's structure. “aa”: amino acid. (B, C) Effect of HACE1 HECT domain deletion on cell growth in AGS and SGC7901. The number of cells was measured in samples at 0, 24, 48, and 72 h separately by means of CCK‐ 8 which was detected under 450 nm. (D, E) Pictures of HACE1‐deltaHECT on cell migration by means of wound‐healing assay in AGS and SGC7901. The pictures were taken at 0 and 24 h, respectively (200×). (F, G) The images of migrating cells with or without HACE1‐deltaHECT were taken after 24 h in Transwell assay. (H, I) The number of cells migrating to the lower chamber. (J) Protein levels of caspase‐9, caspase‐8, and caspase‐3 in SGC7901 cells with or without HACE1 deletion (n.s.: not significant for the indicated comparison).
Figure 7
Figure 7
HACE1 down‐regulates the Wnt/β‐catenin signaling pathway. (A, C) The protein level of β‐catenin in AGS and SGC7901 with or without HACE1 overexpression. (B, C) The protein level of β‐catenin in SGC7901 with HACE1 knockout. (D, E) The activity of the Wnt/β‐catenin signaling pathway by TopFlash assay in AGS and SGC7901 with or without HACE1 overexpression. (F) The activity of the Wnt/β‐catenin signaling pathway by TopFlash assay in SGC7901 with HACE1 knockout. (G) Influence on β‐catenin protein level by HACE1 HECT domain deletion. (H, I) The activity of the Wnt/β‐catenin signaling pathway by TopFlash assay in AGS and SGC7901 with or without HACE1‐deltaHECT. (J) The picture of xenograft tumors of nude mice (21 days). (K) Overexpression of HACE1 reduced the weight of xenograft tumors of nude mice (21 days) (*< 0.05; **< 0.01; n.s.: not significant for the indicated comparison).

References

    1. Torre, L. A. , Bray F., Siegel R. L., Ferlay J., Lortet‐Tieulent J., and Jemal A.. 2015. Global cancer statistics, 2012. CA Cancer J. Clin. 65:87–108. - PubMed
    1. Anglesio, M. S. , Evdokimova V., Melnyk N., Zhang L., Fernandez C. V., Grundy P. E., et al. 2004. Differential expression of a novel ankyrin containing E3 ubiquitin‐protein ligase, Hace1, in sporadic Wilms’ tumor versus normal kidney. Hum. Mol. Genet. 13:2061–2074. - PubMed
    1. Goka, E. T. , and Lippman M. E.. 2015. Loss of the E3 ubiquitin ligase HACE1 results in enhanced Rac1 signaling contributing to breast cancer progression. Oncogene 34:5395–5405. - PMC - PubMed
    1. Bouzelfen, A. , Alcantara M., Kora H., Picquenot J. M., Bertrand P., Cornic M., et al. 2016. HACE1 is a putative tumor suppressor gene in B‐cell lymphomagenesis and is down‐regulated by both deletion and epigenetic alterations. Leuk. Res. 45:90–100. - PubMed
    1. Hibi, K. , Sakata M., Sakuraba K., Shirahata A., Goto T., Mizukami H., et al. 2008. Aberrant methylation of the HACE1 gene is frequently detected in advanced colorectal cancer. Anticancer Res. 28:1581–1584. - PubMed

Publication types

MeSH terms

Substances