. 2018 Apr 19;19(1):146.
doi: 10.1186/s12859-018-2150-1.

Identification of residue pairing in interacting β-strands from a predicted residue contact map

Affiliations

Identification of residue pairing in interacting β-strands from a predicted residue contact map

Wenzhi Mao et al. BMC Bioinformatics. .

Abstract

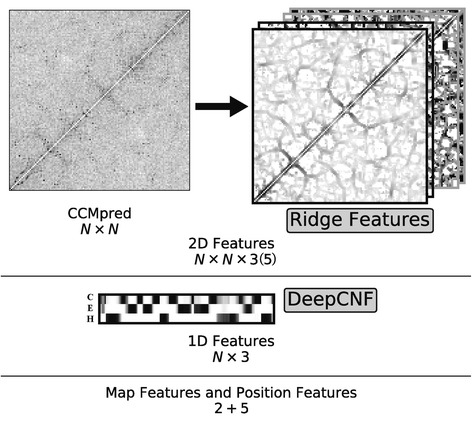
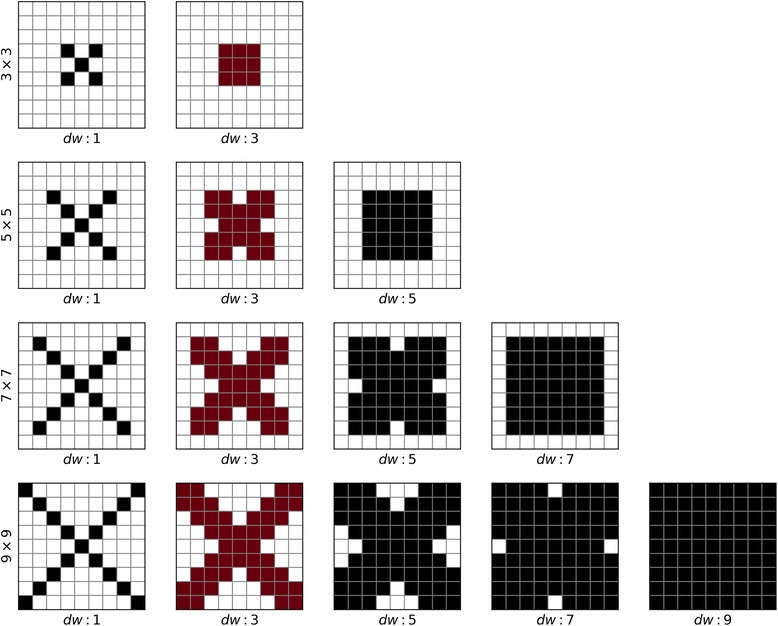
Background: Despite the rapid progress of protein residue contact prediction, predicted residue contact maps frequently contain many errors. However, information of residue pairing in β strands could be extracted from a noisy contact map, due to the presence of characteristic contact patterns in β-β interactions. This information may benefit the tertiary structure prediction of mainly β proteins. In this work, we propose a novel ridge-detection-based β-β contact predictor to identify residue pairing in β strands from any predicted residue contact map.

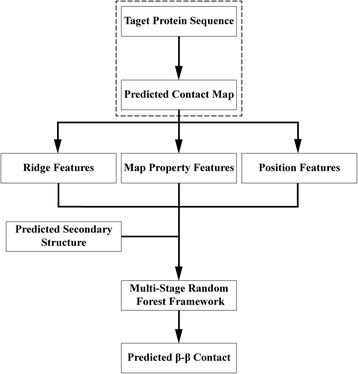
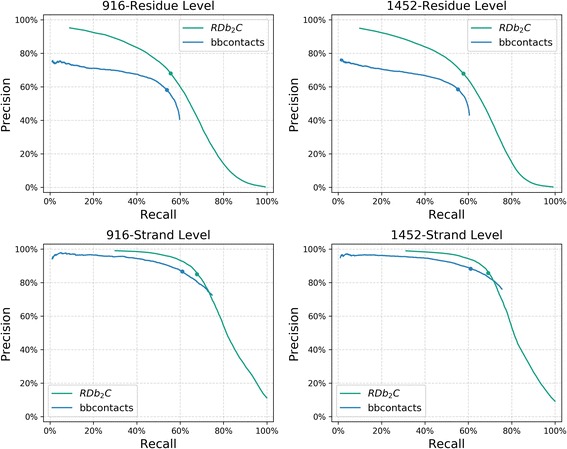
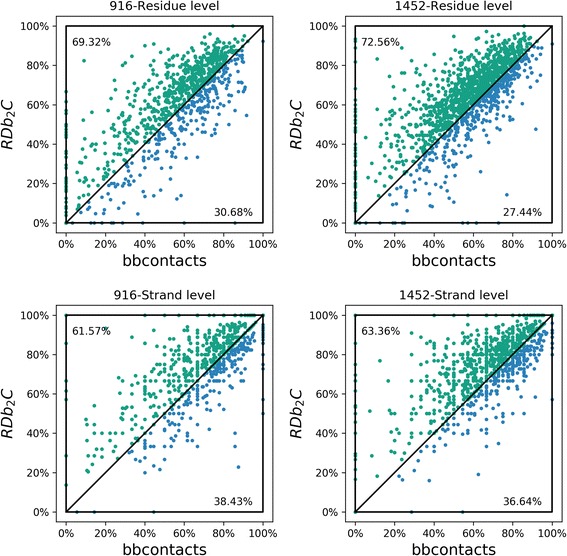
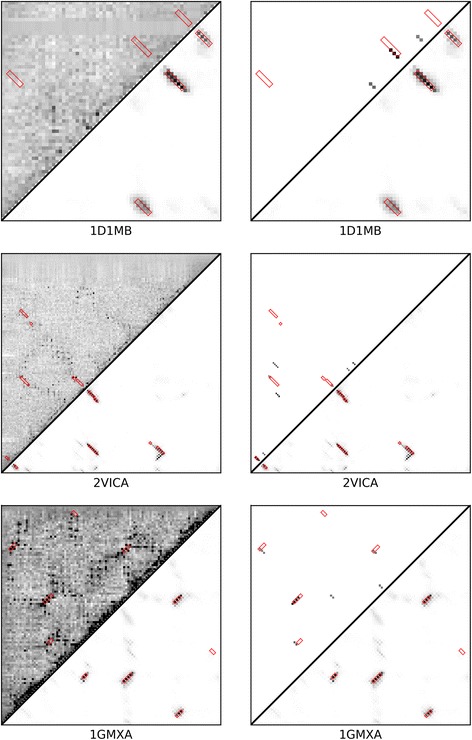
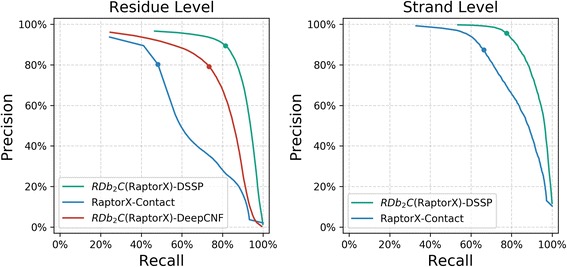
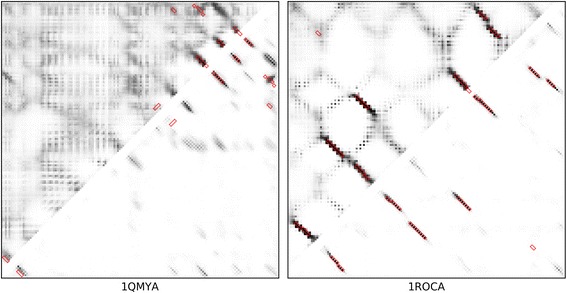
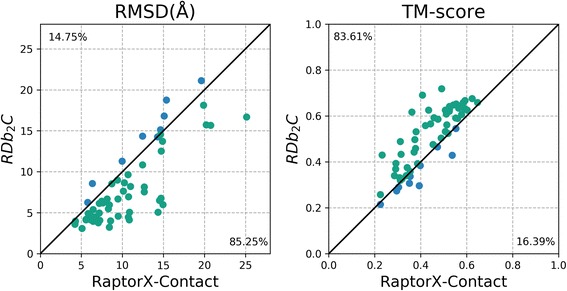
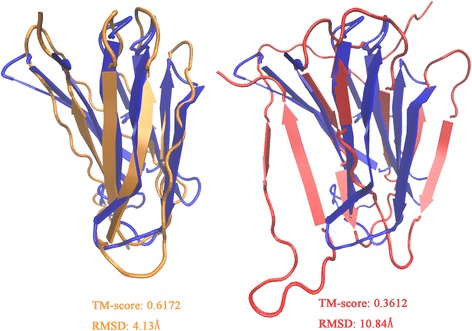
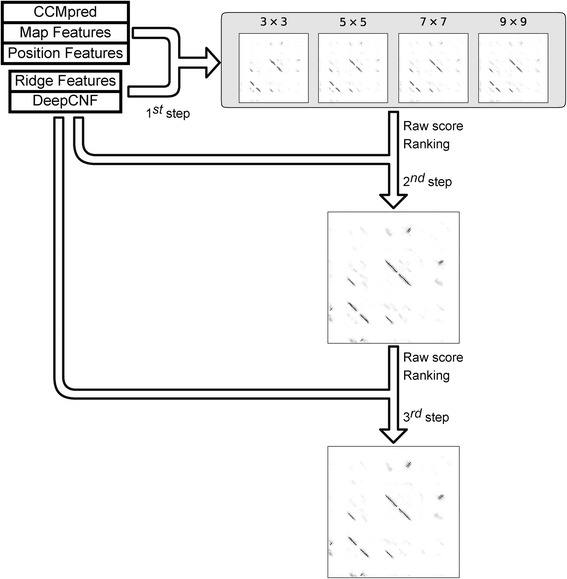
Results: Our algorithm RDb2C adopts ridge detection, a well-developed technique in computer image processing, to capture consecutive residue contacts, and then utilizes a novel multi-stage random forest framework to integrate the ridge information and additional features for prediction. Starting from the predicted contact map of CCMpred, RDb2C remarkably outperforms all state-of-the-art methods on two conventional test sets of β proteins (BetaSheet916 and BetaSheet1452), and achieves F1-scores of ~ 62% and ~ 76% at the residue level and strand level, respectively. Taking the prediction of the more advanced RaptorX-Contact as input, RDb2C achieves impressively higher performance, with F1-scores reaching ~ 76% and ~ 86% at the residue level and strand level, respectively. In a test of structural modeling using the top 1 L predicted contacts as constraints, for 61 mainly β proteins, the average TM-score achieves 0.442 when using the raw RaptorX-Contact prediction, but increases to 0.506 when using the improved prediction by RDb2C.

Conclusion: Our method can significantly improve the prediction of β-β contacts from any predicted residue contact maps. Prediction results of our algorithm could be directly applied to effectively facilitate the practical structure prediction of mainly β proteins.

Availability: All source data and codes are available at http://166.111.152.91/Downloads.html or the GitHub address of https://github.com/wzmao/RDb2C .

Keywords: Contact map; Protein structure prediction; Random forest; Residue contact prediction; Ridge detection; β-β pairing.


Conflict of interest statement

Ethics approval and consent to participate

Not applicable.

Competing interests

The authors declare that they have no competing interests.

Figures

Fig. 1
Fig. 1
The general flow chart of RDb2C
Fig. 2
Fig. 2
The cumulative distributions for training and test sets with the respect of N/L. N is the number of sequences in the MSA and L is the protein length. There are more proteins in the training set with limited numbers of homologous sequences (N/L < 1) than in the BetaSheet916 and BetaSheet1452 sets
Fig. 3
Fig. 3
The PR curves in the BetaSheet916 and BetaSheet1452 sets. The comparison is shown for RDb2C (green) and bbcontacts (blue), at the residue level (top row) and strand level (bottom row) as well as in the BetaSheet916 (left column) and BetaSheet1452 (right column) sets, respectively. Performances at the suggested cutoffs are marked as dots on the PR curves
Fig. 4
Fig. 4
Comparison of RDb2C and bbcontacts for individual proteins of the BetaSheet916 and BetaSheet1452 sets. Each individual protein is represented as a dot. The green dots and blue dots represent targets that are better predicted by RDb2C and by bbcontacts, respectively, in terms of F1-scores. Tie cases are bisected to two methods. In both test sets and at both residue and strand levels, RDb2C outperforms bbcontacts significantly (p-value < 10− 10)
Fig. 5
Fig. 5
Case studies for CCMpred-based predictions. We illustrate three CCMpred-based case studies. In the left-handed panel, the upper left triangle is the raw CCMpred map, while the lower right triangle is the prediction by RDb2C. In the right-handed panel, the upper left triangle is replaced by results of bbcontacts to facilitate direct comparison with RDb2C (i.e. the lower right triangle). The native β-β contact regions are highlighted by red boxes
Fig. 6
Fig. 6
The PR curves in the shrunk BetaSheet916 set. RDb2C (green for DSSP-based model and red for DeepCNF-based model) exhibits significant improvement over the raw RaptorX-Contact prediction (blue). The dots on the PR curve illustrate model performance at the suggested RDb2C cutoffs and the optimized RaptorX-Contact cutoffs
Fig. 7
Fig. 7
Case studies for RaptorX-Contact-based predictions. We illustrate two RaptorX-Contact-based case studies: 1QMYA (left) and 1ROCA (right). In each plot, the upper left triangle is the raw RaptorX-Contact map, while the lower right triangle is the prediction by RDb2C. The native β-β contact regions are highlighted by red boxes
Fig. 8
Fig. 8
Comparison of the best of the top 5 models generated using the RaptorX-Contact prediction and the RDb2C refinement for individual targets of the 61 mainly β proteins. The green dots and blue dots represent targets that are better predicted by RDb2C and by RaptorX-Contact respectively. Detailed results are listed in (Additional file 1: Table S2). For both RMSD and TM-score, RDb2C outperforms RaptorX-Contact significantly (p-value < 10− 8)
Fig. 9
Fig. 9
Case study for structure prediction. We illustrate the predicted structures of 1OUSB based on the refined predictions by RDb2C (left) and the raw RaptorX-Contact predictions (right), respectively. Comparing to the native structure (blue), the predicted structure based on RDb2C (orange) has a higher TM-score (0.6172 vs. 0.3612) and smaller RMSD (4.13 Å vs. 10.84 Å) than the predicted structure based on the raw RaptorX-Contact prediction (red)
Fig. 10
Fig. 10
The relationship between runtime and the number of residues. The time consumed increases steadily with the rise of the number of residues (the I/O time is not included)
Fig. 11
Fig. 11
Ridge features from the original map. (a) The orange line indicates the ridge on the 2D function surface. All ridge points on the ridge line are the maxima in the directions perpendicular to the line (red arrows). The local maximum point (dark blue) is also a ridge point based on the definition. (b) For each given point on the contact map, we select local region (i.e. the grid points) to approximate a quadratic function. (c) On the quadratic function surface, we could identify the linear ridge and project it to the XY plane. (d) Direction of the ridge ϕ and distance from the original given point to the ridge d could be obtained from the projection. (e) We could also identify the principal curvature direction on the ridge and approximate the cross section curve with a Gaussian ridge. The height h and width w are defined as the height and the standard deviation of the Gaussian function. Details are given in the (Additional file 1: Text S1)
Fig. 12
Fig. 12
Summary of features adopted in our model. For each target protein with N residues, we have the original CCMpred map with the size of N × N. We calculate the ridge features for each point on the map to get 4 N × N matrices (2 N × N matrices after feature selection). In total, we have N × N × 5 (N × N × 3 after feature selection) 2D features. The secondary structure prediction from DeepCNF provides an N × 3 1D feature matrix. In addition, we have 2 map features (the sequence/residue ratio and CCMpred standard deviation) and 5 position features (1 residue index difference and 4 distances to protein ends). The data in this figure were generated from the protein 1AHQA
Fig. 13
Fig. 13
An illustration of the window mask. The selected features are labeled in dark colors. The final window masks that were selected are marked in red
Fig. 14
Fig. 14
An illustration of the multi-stage framework. In our 3-stage framework, we firstly construct models with different window sizes. We then integrate four models to get the second-stage results. The final result is obtained from the third-stage model. The data in this figure were generated from the protein 1AHQA

Similar articles

Cited by

References

    1. Anfinsen CB. Principles that govern the folding of protein chains. Science. 1973;181(4096):223–230. doi: 10.1126/science.181.4096.223. - DOI - PubMed
    1. Li W, Zhang Y, Skolnick J. Application of sparse NMR restraints to large-scale protein structure prediction. Biophys J. 2004;87(2):1241–1248. doi: 10.1529/biophysj.104.044750. - DOI - PMC - PubMed
    1. Zhang Y, Kolinski A, Skolnick J. TOUCHSTONE II: a new approach to ab initio protein structure prediction. Biophys J. 2003;85(2):1145–1164. doi: 10.1016/S0006-3495(03)74551-2. - DOI - PMC - PubMed
    1. Kinch LN, Li W, Monastyrskyy B, Kryshtafovych A, Grishin NV. Assessment of CASP11 contact-assisted predictions. Proteins: Structure, Function, and Bioinformatics. 2016;84(S1):164–180. doi: 10.1002/prot.25020. - DOI - PMC - PubMed
    1. Monastyrskyy B, D'Andrea D, Fidelis K, Tramontano A, Kryshtafovych A. New encouraging developments in contact prediction: assessment of the CASP11 results. Proteins: Structure, Function, and Bioinformatics. 2016;84(S1):131–144. doi: 10.1002/prot.24943. - DOI - PMC - PubMed

Publication types

LinkOut - more resources