. 2018 Apr 19;19(1):147.
doi: 10.1186/s12859-018-2141-2.

A site specific model and analysis of the neutral somatic mutation rate in whole-genome cancer data

Affiliations

A site specific model and analysis of the neutral somatic mutation rate in whole-genome cancer data

Johanna Bertl et al. BMC Bioinformatics. .

Abstract

Background: Detailed modelling of the neutral mutational process in cancer cells is crucial for identifying driver mutations and understanding the mutational mechanisms that act during cancer development. The neutral mutational process is very complex: whole-genome analyses have revealed that the mutation rate differs between cancer types, between patients and along the genome depending on the genetic and epigenetic context. Therefore, methods that predict the number of different types of mutations in regions or specific genomic elements must consider local genomic explanatory variables. A major drawback of most methods is the need to average the explanatory variables across the entire region or genomic element. This procedure is particularly problematic if the explanatory variable varies dramatically in the element under consideration.

Results: To take into account the fine scale of the explanatory variables, we model the probabilities of different types of mutations for each position in the genome by multinomial logistic regression. We analyse 505 cancer genomes from 14 different cancer types and compare the performance in predicting mutation rate for both regional based models and site-specific models. We show that for 1000 randomly selected genomic positions, the site-specific model predicts the mutation rate much better than regional based models. We use a forward selection procedure to identify the most important explanatory variables. The procedure identifies site-specific conservation (phyloP), replication timing, and expression level as the best predictors for the mutation rate. Finally, our model confirms and quantifies certain well-known mutational signatures.

Conclusion: We find that our site-specific multinomial regression model outperforms the regional based models. The possibility of including genomic variables on different scales and patient specific variables makes it a versatile framework for studying different mutational mechanisms. Our model can serve as the neutral null model for the mutational process; regions that deviate from the null model are candidates for elements that drive cancer development.

Keywords: Multinomial logistic regression; Site-specific model; Somatic cancer mutations.


Conflict of interest statement

Competing interests

The authors declare that they have no competing interests.

Publisher’s Note

Springer Nature remains neutral with regard to jurisdictional claims in published maps and institutional affiliations.

Figures
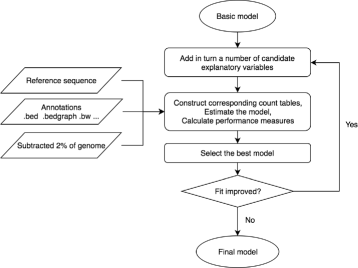
Fig. 1
Fig. 1
Workflow of the forward model selection procedure. The forward model selection is implemented on 2% of the data to determine the explanatory variables included in the final model. In each iteration of the model selection procedure, data tables are generated to summarize the site-specific annotations. The performance of the models is measured with the deviance loss obtained by cross-validation. The explanatory variable with the best performance is included in the set of variables for the next iteration. Parameter estimation for the final model is based on the remaining 98% of the data
Fig. 2
Fig. 2
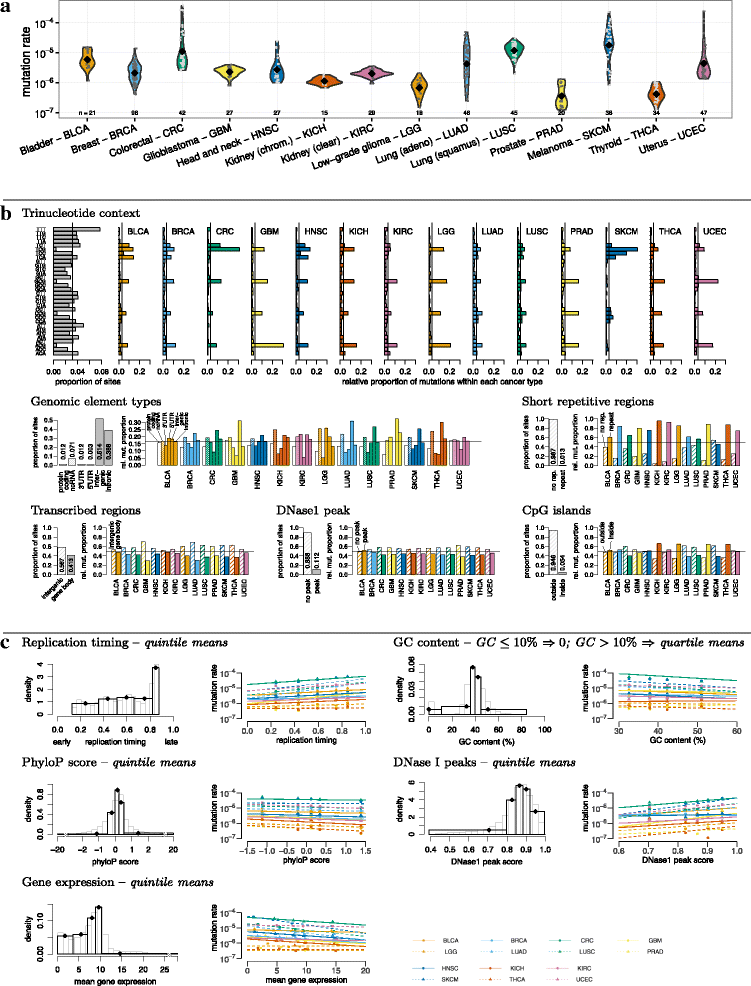
Heterogeneity of the mutation rate and explanatory variables. a Heterogeneity among cancer types and samples. Violin plot for the mutation probability for 14 cancer types. b Heterogeneity along the genome and the correlation with categorical explanatory variables. Relative proportion of mutations from nucleotide C or T in the neighboring context A,G,C,T (2·4·4=32 possibilities), relative proportion of mutations of six different genomic elements, and relative proportion of mutations within and outside repeat regions or CpG islands. c Heterogeneity correlated with continuous variables. Left column: continuous variables. Middle column: The continuous annotations are discretized into bins according to quantiles for site-specific regression models. Each bin is represented by the mean value within the bin. Grey transparent histograms: distribution of the continuous values of the annotation along the genome. Black transparent histograms: distribution of the discrete bins of the annotation (binning scheme in italics in the column “Annotation”). Black diamonds: Discrete value used for the binning. Right column: Predicted (lines) and observed (points) mutation rate for each cancer type and explanatory variables. The regression lines are generated under a multinomial logistic regression model using only the corresponding explanatory variable. Details about the different data types can be found in “Somatic mutation dataset” section
Fig. 3
Fig. 3
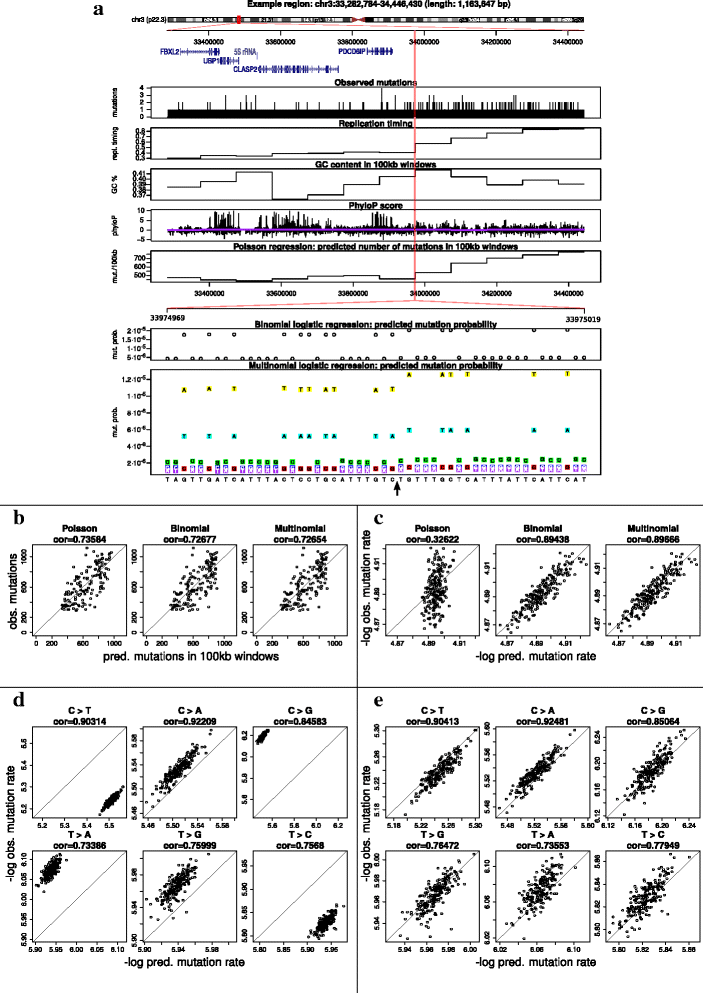
Comparison of Poisson regression model, site-specific binomial logistic regression model and site-specific multinomial logistic regression model. a Motivation (site-specificity) and conceptual explanation of the different models. Consider a 1.2 Mb region on Chromosome 3. We observe a number of mutations and the value of the explanatory variables replication timing, GC content and phyloP score. Given the values of the explanatory variables we use Poisson, site-specific binomial logistic regression or site-specific multinomial logistic regression to predict the number of mutations in a region (Poisson), the probability of a mutation in a single site (binomial) or even the probability of the three types of mutation in a single site (multinomial). b Predicted versus observed number of mutations for the three models for 100 kb regions. c Site-specific models perform substantially better in 1000 randomly selected sites. d The prediction for different mutation types with binomial logistic regression model in 1000 randomly selected sites. e The prediction for different mutation types with multinomial logistic regression model in 1000 randomly selected sites
Fig. 4
Fig. 4
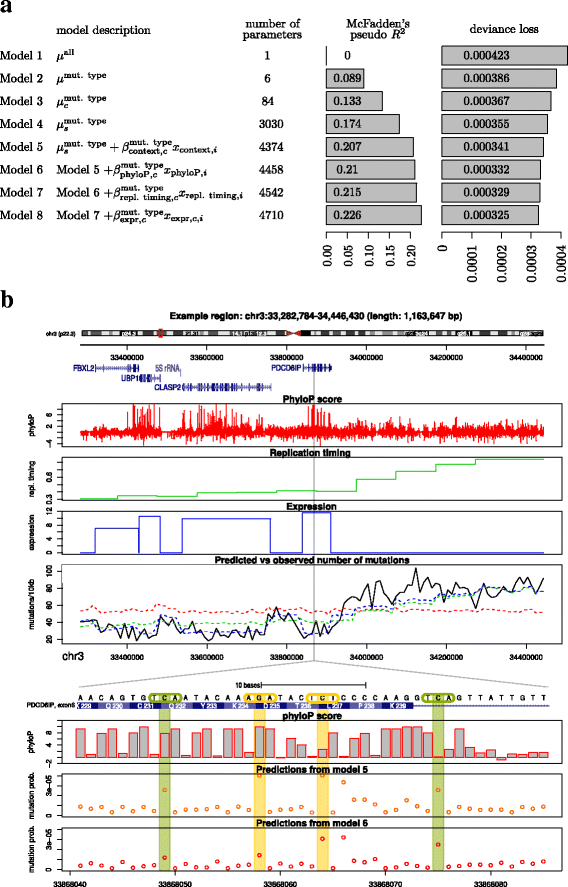
Model selection results. a Improvement of the fit during forward model selection. In each iteration, we estimate the deviance loss by cross validation to determine which explanatory variable to include in the next model. b Explanatory variables and predicted vs observed number of mutations along the genome in an example region on chromosome 3 for models 6–8. Zoom: DNA sequence, phyloP score and predicted mutation probabilities from models 5 and 6
Fig. 5
Fig. 5
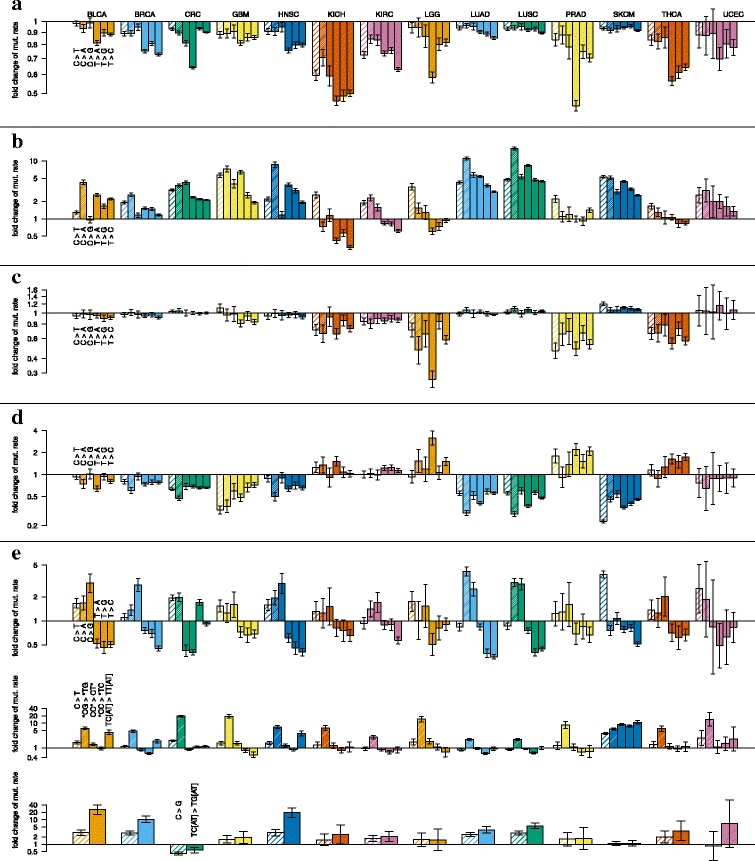
Parameter estimation results. a Neutral vs. conserved regions. The height of the bars give the fold change in mutation rate in conserved regions (phyloP score =1.3838, mean of the highest quintile, see Fig. 2c compared to neutral regions (phyloP score = 0). b Early vs. late replicating regions. The height of the bars give the fold increase/decrease in mutation rate in late replicating regions (replication timing = 1) compared to early replicating regions (replication timing = 0). c Intergenic vs. gene body. The height of the bars give the fold increase/decrease in mutation rate in gene bodies compared to intergenic regions. d Low vs. high expression. The height of the bars give the fold increase/decrease in mutation rate in highly expression regions (expression value =15, approx. the mean of the highest quintile, see Fig. 2c compared to lowly expressed regions (expression value = 0). Here, only gene bodies are considered. e Mutation type are considered as the combination of substitutions and neighboring sites. The horizontal line indicates the average mutation rate for each cancer type. The height of the bars give the fold increase/decrease in mutation rate for a specific mutation type. Panel 1: Different substitution types. Panel 2: C >T mutations in different contexts. Panel 3: C >G mutations in all contexts and in TpCp[AT] contexts

Similar articles

Cited by

References

    1. Stratton MR, Campbell PJ, Futreal PA. The cancer genome. Nature. 2009;458(7239):719–24. doi: 10.1038/nature07943. - DOI - PMC - PubMed
    1. Bacolla A, Cooper DN, Vasquez KM. Mechanisms of base substitution mutagenesis in cancer genomes. Genes. 2014;5(1):108–46. doi: 10.3390/genes5010108. - DOI - PMC - PubMed
    1. Alexandrov LB, Nik-Zainal S, Wedge DC, Aparicio SA, Behjati S, Biankin AV, Bignell GR, Bolli N, Borg A, Børresen-Dale A-L, et al. Signatures of mutational processes in human cancer. Nature. 2013;500(7463):415–21. doi: 10.1038/nature12477. - DOI - PMC - PubMed
    1. Polak P, Karlic R, Koren A, Thurman R, Sandstrom R, Lawrence MS, Reynolds A, Rynes E, Vlahovicek K, Stamatoyannopoulos JA, Sunyaev SR. Cell-of-origin chromatin organization shapes the mutational landscape of cancer. Nature. 2015;518(7539):360–4. doi: 10.1038/nature14221. - DOI - PMC - PubMed
    1. Lawrence MS, Stojanov P, Polak P, Kryukov GV, Cibulskis K, Sivachenko A, Carter SL, Stewart C, Mermel CH, Roberts SA, et al. Mutational heterogeneity in cancer and the search for new cancer-associated genes. Nature. 2013;499(7457):214–8. doi: 10.1038/nature12213. - DOI - PMC - PubMed

Publication types

LinkOut - more resources