. 2018 Apr 19;19(1):25.
doi: 10.1186/s12868-018-0422-3.

The spatio-temporal dynamics of deviance and target detection in the passive and active auditory oddball paradigm: a sLORETA study

Affiliations

The spatio-temporal dynamics of deviance and target detection in the passive and active auditory oddball paradigm: a sLORETA study

Christoph Justen et al. BMC Neurosci. .

Abstract

Background: Numerous studies have investigated the neural underpinnings of passive and active deviance and target detection in the well-known auditory oddball paradigm by means of event-related potentials (ERPs) or functional magnetic resonance imaging (fMRI). The present auditory oddball study investigates the spatio-temporal dynamics of passive versus active deviance and target detection by analyzing amplitude modulations of early and late ERPs while at the same time exploring the neural sources underling this modulation with standardized low-resolution brain electromagnetic tomography (sLORETA) .

Methods: A 64-channel EEG was recorded from twelve healthy right-handed participants while listening to 'standards' and 'deviants' (500 vs. 1000 Hz pure tones) during a passive (block 1) and an active (block 2) listening condition. During passive listening, participants had to simply listen to the tones. During active listening they had to attend and press a key in response to the deviant tones.

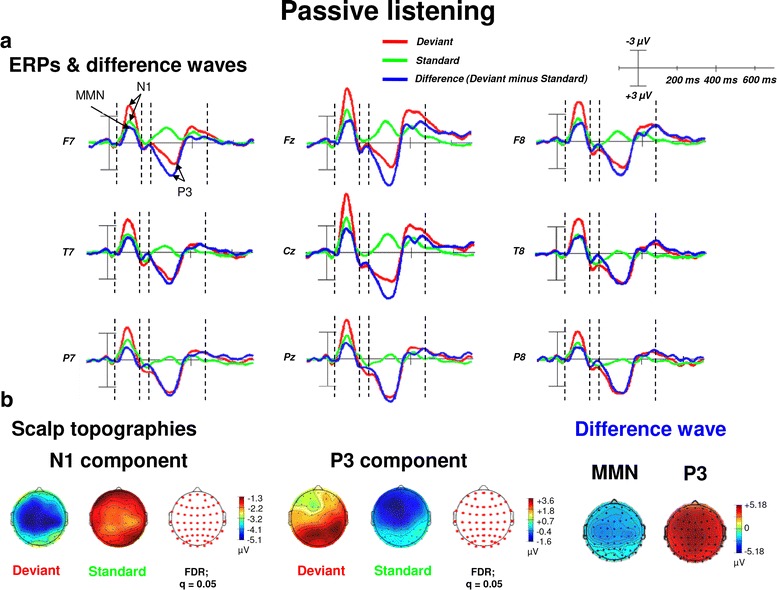
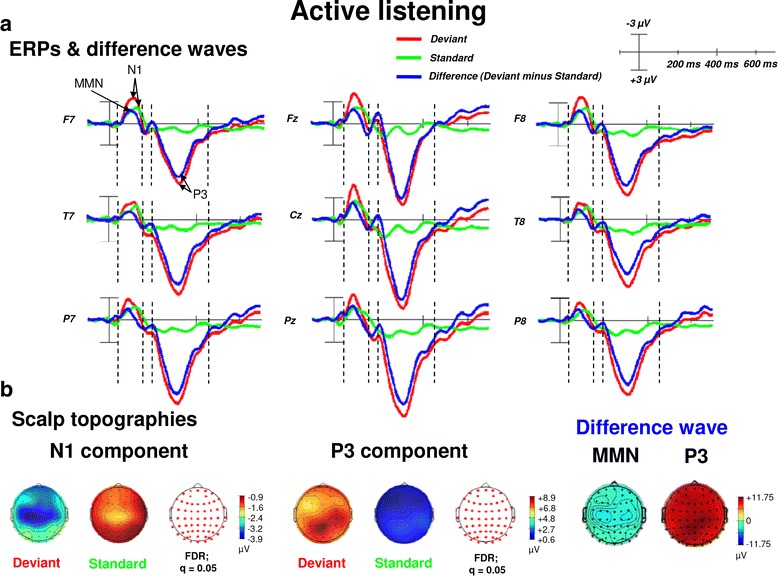
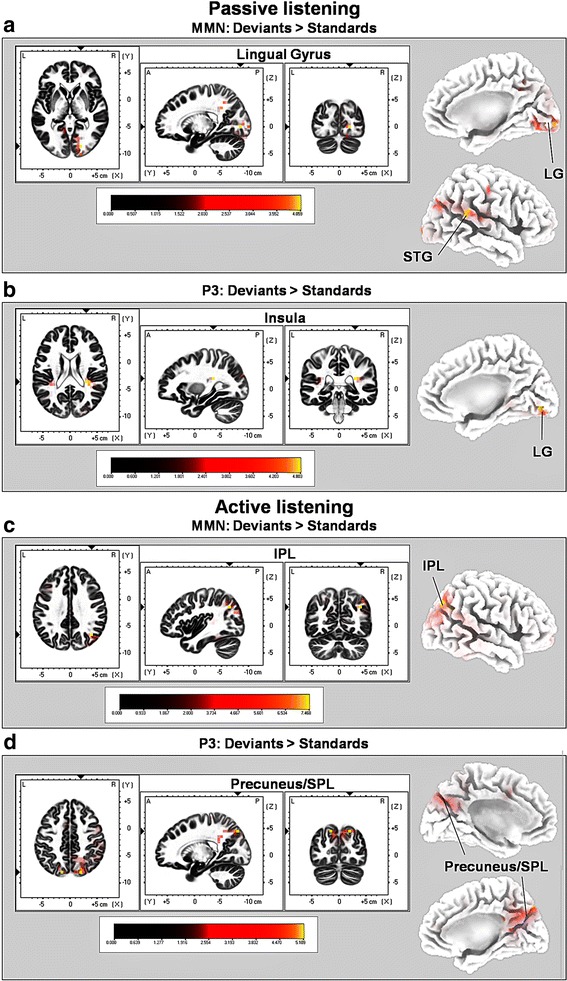
Results: Passive and active listening elicited an N1 component, a mismatch negativity (MMN) as difference potential (whose amplitudes were temporally overlapping with the N1) and a P3 component. N1/MMN and P3 amplitudes were significantly more pronounced for deviants as compared to standards during both listening conditions. Active listening augmented P3 modulation to deviants significantly compared to passive listening, whereas deviance detection as indexed by N1/MMN modulation was unaffected by the task. During passive listening, sLORETA contrasts (deviants > standards) revealed significant activations in the right superior temporal gyrus (STG) and the lingual gyri bilaterally (N1/MMN) as well as in the left and right insulae (P3). During active listening, significant activations were found for the N1/MMN in the right inferior parietal lobule (IPL) and for the P3 in multiple cortical regions (e.g., precuneus).

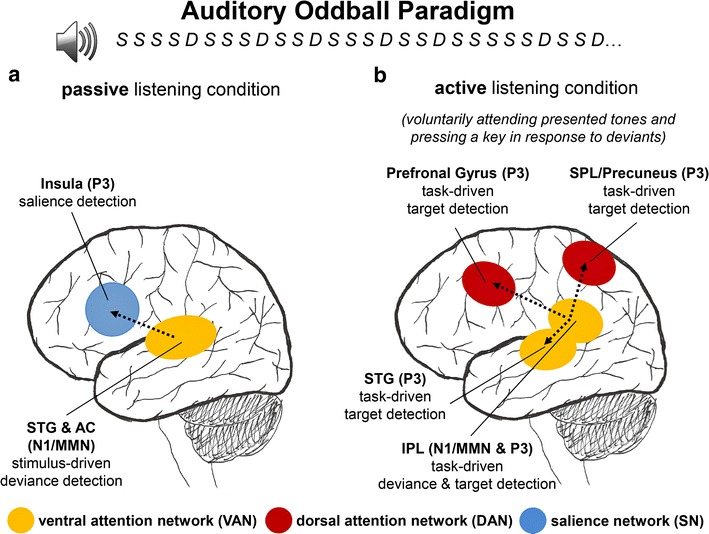
Discussion: The results provide evidence for the hypothesis that passive as well as active deviance and target detection elicit cortical activations in spatially distributed brain regions and neural networks including the ventral attention network (VAN), dorsal attention network (DAN) and salience network (SN). Based on the temporal activation of the neural sources underlying ERP modulations, a neurophysiological model of passive and active deviance and target detection is proposed which can be tested in future studies.

Keywords: Attention; Attention networks; EEG; MMN; Mismatch negativity; N1; P3; Salience; Source localization.


Figures

Fig. 1
Fig. 1
ERPs (upper panel, a and scalp topographic plots (lower panel, b for the N1 and P3 components as well as the MMN and the P3 of the difference waveforms (“Deviant” minus “ Standard”) for the passive listening condition. a The topographic plot shows ERP waveforms from 9 electrode sites (from frontal to posterior regions). ERP waveforms show the N1 and the P3 components with significantly higher amplitudes (more negative for the N1 and more positive for the P3) in response to deviants (pure tones with a frequency of 1000 Hz) as compared to standards (pure tones with a frequency of 500 Hz) during the passive listening condition. Furthermore, the P3 is elicited by deviants, but not in response to standards. b The scalp topographies of the N1 and P3 as well as the MMN and P3 (extracted difference wave) are shown in more detail. Reddish colors of the scalp indicate positive ERP values, whereas bluish colors indicate negative ERP values. In addition, the transparent EEG montage arrays (right panels) show statistically significant electrode sites as indicated by red dots (after comparison for multiple comparisons with FDR). In addition, topographic plots of the MMN and P3 peaks as difference potentials are shown (right panel). FDR false discovery rate, MMN mismatch negativity, negative is plotted up, positive is plotted downwards
Fig. 2
Fig. 2
ERPs (upper panel, a and scalp topographic plots (lower panel, b for the ERP components N1 and P3 components as well as the MMN and the P3 of the difference waveforms (“Deviant” minus “Standard”) for the active listening condition. a The topographic head plot shows ERP waveforms from 9 electrode sites (from frontal to posterior regions). ERP waveforms show the N1 and the P3 component with significantly higher amplitudes (more negative for the N1 and more positive for the P3) in response to deviants (pure tones with a frequency of 1000 Hz) as compared to standards (pure tones with a frequency of 500 Hz) during the passive listening condition. Furthermore, the P3 is elicited by deviants, but not in response to standards. b The scalp topographies of the N1 and P3 as well as the MMN and P3 (extracted difference wave) are shown in more detail. Reddish colors of the scalp indicate positive ERP values, whereas bluish colors indicate negative ERP values. In addition, the transparent EEG montage arrays (right panels) show statistically significant electrode sites as indicated by red dots (after comparison for multiple comparisons with FDR). In addition, topographic plots of the MMN and P3 as difference potentials are shown (right panel). FDR false discovery rate, MMN mismatch negativity, negative is plotted up, positive is plotted downwards
Fig. 3
Fig. 3
Results of the standardized low-resolution brain electrotomography (sLORETA) source localization analysis in the ‘passive’ and ‘active’ pure tone oddball paradigm. Images have been obtained after statistical non-parametric mapping (SnPM) and co-registration to the stereotaxic Talairach space based on the Co-Planar Stereotaxic Atlas of the Human Brain [72] and the probabilistic MNI-152 template [70]. Activated voxels are indicated by yellowish and reddish colors [after correction for multiple comparisons (p < 0.01 and p < 0.05, respectively)]. a In the averaged time windows of the ‘unattended’ MMN component (80–123 ms), the peak of highest cortical activity has been found in the right LG (BAs 17/18/19) and right STG (BAs 13/22/39/42). b In the averaged time windows of the ‘attended’ MMN component (83–95 ms), the peak of highest cortical activity has been found in the right IPL (BAs 7/39/40). c In the averaged time windows of the ‘unattended’ P3 component (269–322 ms), the peak of highest cortical activity has been found in both insulae bilaterally (BA 13) and the right LG (BA 18). d In the averaged time windows of the ‘attended’ P3 component (253–351 ms), the peak of highest cortical activity has been found in the precuneus/SPL bilaterally (BAs 7/19/23/21). L left, R right, LG lingual gyrus, STG superior temporal gyrus, IPL inferior parietal lobule, SPL superior parietal lobule, MNI Montreal Neurological Institute, X, Y, Z corresponding MNI coordinates, BA Brodmann area
Fig. 4
Fig. 4
Overview of a proposed model based on the obtained ERP and sLORETA results (for an explanation, see "A neurophysiolological model of passive and active auditory deviance and target detection" section). AC auditory cortex, IPL inferior parietal lobule, MMN mismatch negativity, STG superior temporal gyrus, SPL superior parietal lobule

Similar articles

Cited by

References

    1. Watkins S, Dalton P, Lavie N, Rees G. Brain mechanisms mediating auditory attentional capture in humans. Cereb Cortex. 2007;17:1694–1700. doi: 10.1093/cercor/bhl080. - DOI - PubMed
    1. Halgren E, Squires NK, Wilson CL, Rohrbaugh JW, Babb TL, Crandall PH. Endogenous potentials generated in the human hippocampal formation and amygdala by infrequent events. Science. 1980;210:803 LP–805. doi: 10.1126/science.7434000. - DOI - PubMed
    1. Bledowski C, Prvulovic D, Goebel R, Zanella FE, Linden DEJ. Attentional systems in target and distractor processing: a combined ERP and fMRI study. Neuroimage. 2004;22:530–540. doi: 10.1016/j.neuroimage.2003.12.034. - DOI - PubMed
    1. Kim H. Involvement of the dorsal and ventral attention networks in oddball stimulus processing: a meta-analysis. Hum Brain Mapp. 2014;35:2265–2284. doi: 10.1002/hbm.22326. - DOI - PMC - PubMed
    1. Bennington JY, Polich J. Comparison of P300 from passive and active tasks for auditory and visual stimuli. Int J Psychophysiol. 1999;34:171–177. doi: 10.1016/S0167-8760(99)00070-7. - DOI - PubMed

Publication types

LinkOut - more resources