. 2018 May 25;360(6391):eaaq1736.
doi: 10.1126/science.aaq1736. Epub 2018 Apr 19.

Cell type transcriptome atlas for the planarian Schmidtea mediterranea

Affiliations

Cell type transcriptome atlas for the planarian Schmidtea mediterranea

Christopher T Fincher et al. Science. .

Abstract

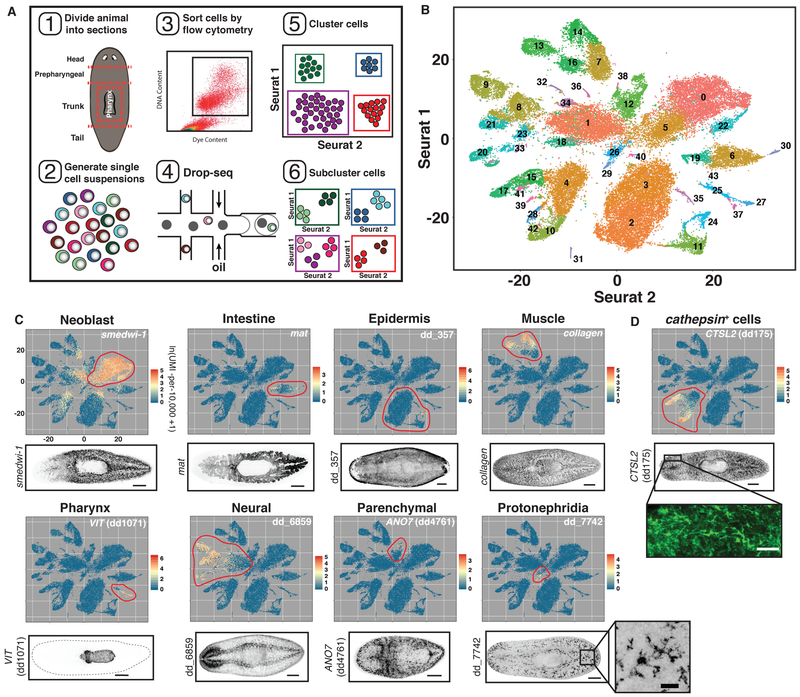
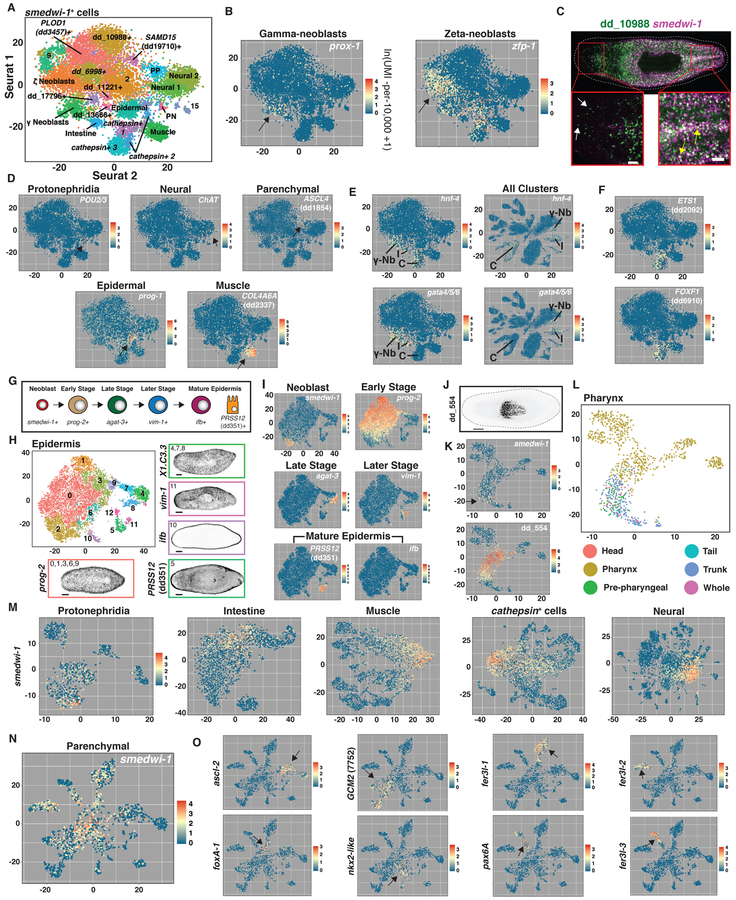
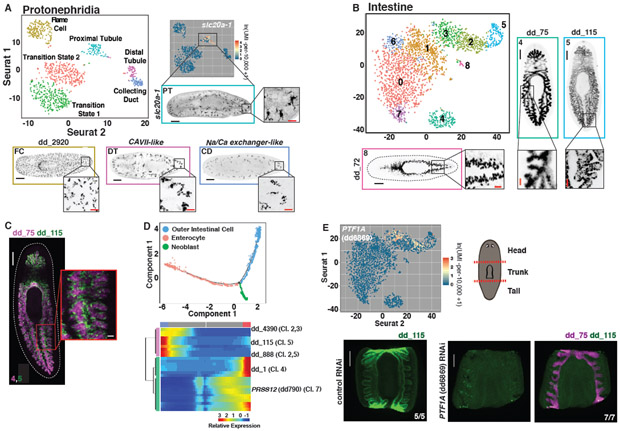
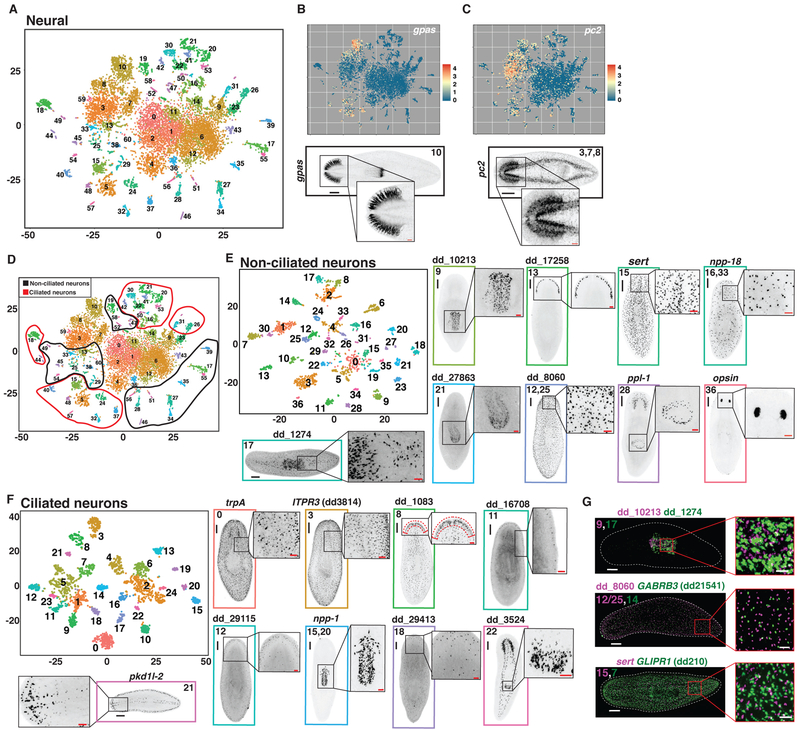
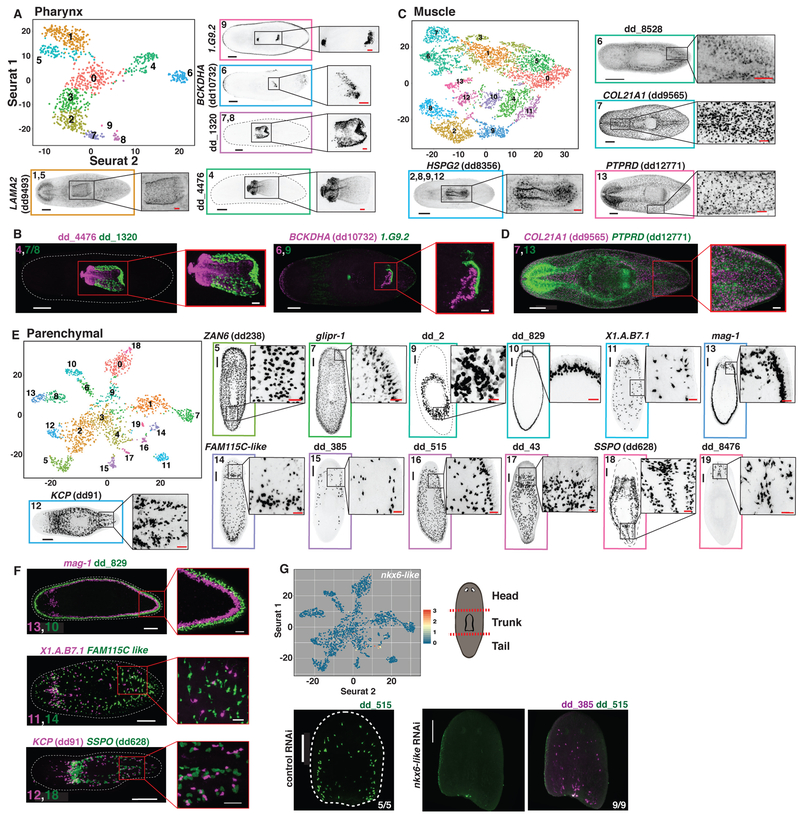
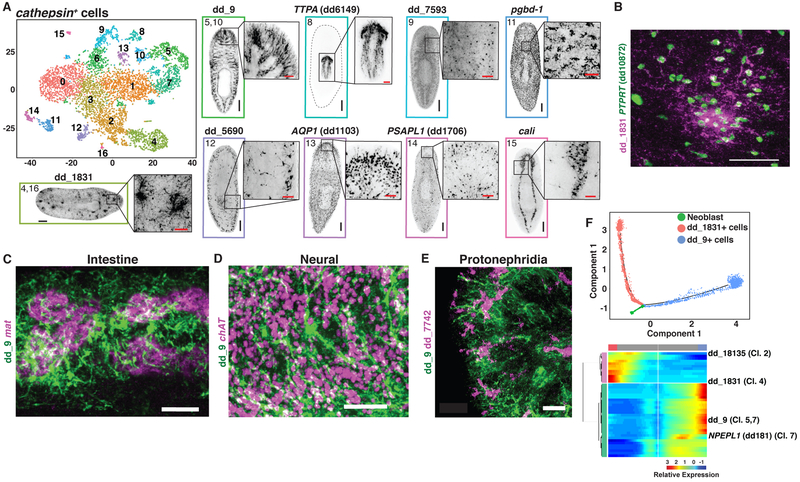
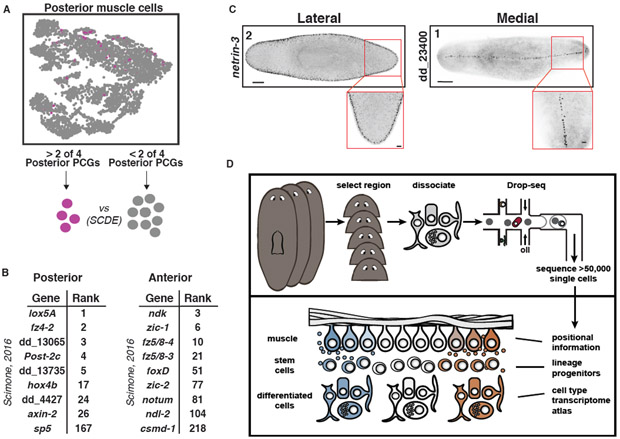
The transcriptome of a cell dictates its unique cell type biology. We used single-cell RNA sequencing to determine the transcriptomes for essentially every cell type of a complete animal: the regenerative planarian Schmidtea mediterranea. Planarians contain a diverse array of cell types, possess lineage progenitors for differentiated cells (including pluripotent stem cells), and constitutively express positional information, making them ideal for this undertaking. We generated data for 66,783 cells, defining transcriptomes for known and many previously unknown planarian cell types and for putative transition states between stem and differentiated cells. We also uncovered regionally expressed genes in muscle, which harbors positional information. Identifying the transcriptomes for potentially all cell types for many organisms should be readily attainable and represents a powerful approach to metazoan biology.


Figures

Fig. 1.
Fig. 1.. Drop-seq of 50,562 planarian cells.
(A) Schematic illustrating the workflow used to isolate and cluster single cells. (B) t-SNE representation of 44 clusters generated from the data. (C and D) Top: t-SNE plots, colored by gene expression for highly enriched genes from 9 planarian tissue classes (Red to yellow to blue indicates high to medium to low expression). Red circles denote clusters assigned to that tissue class. Bottom: FISH images for tissue-enriched genes. Scale bars: whole-animal images, 200 μm; insets, 50 μm.
Fig. 2.
Fig. 2.. Subclustering identifies neoblast subpopulations.
(A) t-SNE representation of 22 clusters generated from subclustering cells with smedwi-1 expression ≥ 2.5 (ln(UMI-per−10,000+1)). Identity of numbered clusters unknown. PP, parenchymal; PN, protonephridia. Intestine cluster indicated by lower expression of smedwi-1 and enriched gata4/5/6 and hnf4 expression. (B) smedwi-1+ t-SNE plots colored by prox-1 and zfp-1 expression. (C) Double FISH image for dd_10988 and smedwi-1. Yellow arrows: coexpression. White arrows: no co-expression. (D) smedwi-1+ t-SNE plots colored by expression of differentiated tissue-enriched genes. Arrows: gene expression sites. (E) Left: smedwi-1+ t-SNE plots colored by gata4/5/6 and hnf-4 expression. Right: All cluster t-SNE plots colored by gata4/5/6 and hnf-4 expression. C, cathepsin+ cells; I, Intestine; γ-Nb, γ Neoblasts. (F) smedwi-1+ t-SNE plots colored by ETS1 (dd2092) and FOXF1 (dd6910) expression. (G) Epidermal cell maturation stages. (H) t-SNE representation of epidermal subclusters. FISH images labeled by their associated cluster(s) are shown. (I) Epidermal t-SNE plots colored by epidermal-lineage marker expression from (G). (J) dd_554 FISH. (K) Pharynx t-SNE plots colored by smedwi-1 and dd_554 expression. (L) Pharynx t-SNE plot colored by the body region from which each cell was isolated. (M and N) t-SNE plots generated by subclustering cells identified as (M) protonephridia, intestine, muscle, cathepsin+ cells, neural, and (N) parenchymal. t-SNE plots colored by smedwi-1 expression. (O) Parenchymal t-SNE plots colored by expression of 8 transcription factor-encoding genes enriched in (N). Arrows: gene expression sites. Scale bars: whole-animal images, 200 μm; insets, 50 μm.
Fig. 3.
Fig. 3.. Subclustering of tissues reveals transcriptomes for known and novel cell populations.
(A) t-SNE representation of the protonephridial subcluster. FISH images are labeled by their associated cluster. (B) t-SNE representation of intestinal subclusters. (C) Double FISH images of genes enriched in separate intestinal subclusters. Numbers indicate the associated subcluster for each marker. (D) Top: Cell trajectory of enterocyte and outer intestinal cell lineages produced by Monocle. Cells colored by identity. Bottom: Heat map of branch dependent genes (q-value < 1E-145) across cells plotted in pseudotime. Cells, columns; Genes, rows. Beginning of pseudotime at center of heatmap. “Cl.” annotation indicates a log-fold enrichment ≥ 1 of the gene in that intestine Seurat cluster. (E) Top left: Intestine t-SNE plot colored by expression of PTF1A (dd6869). Top right: Illustration of cutting scheme used to generate fragments. Bottom: dd_ 115 and dd_75 FISH of control and PTF1A (dd6869) RNAi animals. Animals cut and fixed 23 days following the start of dsRNA feedings. Scale bars: whole-animal/fragment images, 200 μm; insets 50 μm.
Fig. 4.
Fig. 4.. Subclustering of neural cells reveals known and novel cell populations.
(A) t-SNE representation of the neural subcluster. (B and C) Top: t-SNE plots colored by expression of (B) gpas and (C) pc-2. Bottom: FISH for (B) gpas and (C) pc-2 labeled with the associated neural subcluster. (D) t-SNE plot in (A) overlaid with circles indicating the ascribed identity of each subcluster as ciliated or non-ciliated. (E and F) t-SNE representation of subclustered cells identified as (E) non-ciliated or (F) ciliated in (D). (G) Double FISH images of 3 sets of non-ciliated neuron genes enriched in separate subclusters. Numbers indicate the associated non-ciliated neuron subcluster(s) for each marker. Scale bars: whole-animal images, 200 μm; insets 50 μm.
Fig. 5.
Fig. 5.. Tissue subclustering identifies cell populations of poorly characterized tissues.
(A) t-SNE representation of the pharynx subcluster. FISH images are labeled by their associated cluster(s). (B) Double FISH images of pharynx markers enriched in separate subclusters. Numbers indicate the associated pharynx subcluster(s) for each marker. (C) t-SNE representation of the muscle subcluster. (D) Double FISH images of 2 muscle markers enriched in separate subclusters. Numbers indicate the associated muscle subcluster for each marker. (E) t-SNE representation of the parenchymal subcluster. (F) Double FISH images of 3 sets of parenchymal markers enriched in separate subclusters. Numbers indicate the associated parenchymal subcluster for each marker. (G) Top left: Parenchymal t-SNE plot colored by expression of nkx6-like. Top right: Illustration of cutting scheme used to generate fragments. Bottom: dd_515 and dd_385 FISH of control and nkx6-like RNAi animals. Animals cut and fixed 23 days following the start of dsRNA feedings. Scale bars: whole-animal/fragment images, 200 μm; insets, 50 μm.
Fig. 6.
Fig. 6.. Tissue subclustering reveals a previously unidentified class of cells.
(A) t-SNE representation of the cathepsin+ cell subcluster. FISH images are labeled by their associated cluster(s). Images associated with subclusters 5/10 and 8 are single slices in the animal. All other images are maximum intensity projections. (B) Double FISH for 2 cathepsin+ cell markers enriched in the same subclusters, 4 and 16. (C-E) FISH for dd_9 and (C) mat, (D) ChAT, and (E) dd_7742. (F) Top: Cell trajectory of dd_1831+ and dd_9+ cathepsin+ cell lineages produced by Monocle. Cells colored by identity. Bottom: Heat map of branch dependent genes (q-value < 1E-175) across cells plotted in pseudotime. Cells, columns; Genes, rows. Beginning of pseudotime at center of heatmap. “Cl.” annotation indicates a log-fold enrichment ≥ 1 of the gene in that cathepsin+ cell Seurat cluster. Scale bars: whole-animal images, 200 μm; insets and B-E, 50 μm.
Fig. 7.
Fig. 7.. Identification of new regionally expressed genes in muscle.
(A) Top: t-SNE plot colored by muscle cells positive for expression ≥ 0.5 (ln(UMI-per−10,000+1)) of 2 of the 4 posterior PCGs wnt11-1, wnt11-2, fz-4, and wntP-2. Positive cells, pink; negative cells, grey. Bottom: Transcriptomes for posterior muscle cells were compared to all other muscle cells by SCDE. (B) List of differentially expressed genes in (left) posterior and (right) anterior muscle cells that were identified in Scimone et al. (56). Rank indicates the rank of the gene in our analysis. (C) FISH images of one (left) lateral and one (right) medial expressed gene ranked highly in this analysis (59). Number indicates gene rank in the list generated by SCDE. Scale bars: whole-mount images, 200 μm; insets, 50 μm. (D) Illustration highlighting the capacity of the dataset to identify almost all cell types in the planarian, as well specialized neoblast progenitors, and novel patterning information from the adult animal.

References

    1. The C elegans Sequencing Consortium, Genome sequence of the nematode C. elegans: A platform for investigating biology. Science 282, 2012–2018 (1998). - PubMed
    1. Lander ES, Linton LM, Birren B, Nusbaum C, Zody MC, Baldwin J, Devon K, Dewar K, Doyle M, FitzHugh W, Funke R, Gage D, Harris K, Heaford A, Howland J, Kann L, Lehoczky J, LeVine R, McEwan P, McKernan K, Meldrim J, Mesirov JP, Miranda C, Morris W, Naylor J, Raymond C, Rosetti M, Santos R, Sheridan A, Sougnez C, Stange-Thomann N, Stojanovic N, Subramanian D, Rogers Wyman, J., Sulston J, Ainscough R, Beck S, Bentley D, Burton J, Clee C, Carter N, Coulson A, Deadman R, Deloukas P, Dunham A, Dunham I, Durbin R, French L, Grafham D, Gregory S, Hubbard T, Humphray S, Hunt A, Jones M, Lloyd C, McMurray A, Matthews L, Mercer S, Milne S, Mullikin JC, Mungall A, Plumb R, Ross M, Shownkeen R, Sims S, Waterston RH, Wilson RK, Hillier LW, McPherson JD, Marra MA, Mardis ER, Fulton LA, Chinwalla AT, Pepin KH, Gish WR, Chissoe SL, Wendl MC, Delehaunty KD, Miner TL, Delehaunty A, Kramer JB, Cook LL, Fulton RS, Johnson DL, Minx PJ, Clifton SW, Hawkins T, Branscomb E, Predki P, Richardson P, Wenning S, Slezak T, Doggett N, Cheng JF, Olsen A, Lucas S, Elkin C, Initial sequencing and analysis of the human genome. Nature 409, 860–921 (2001). - PubMed
    1. Venter JC, Adams MD, Myers EW, Li PW, Mural RJ, Sutton GG, Smith HO, Yandell M, Evans CA, Holt RA, Gocayne JD, Amanatides P, Ballew RM, Huson DH, Wortman JR, Zhang Q, Kodira CD, Zheng XH, Chen L, Skupski M, Subramanian G, Thomas PD, Zhang J, Gabor Miklos GL, Nelson C, Broder S, Clark AG, Nadeau J, McKusick VA, Zinder N, Levine AJ, Roberts RJ, Simon M, Slayman C, Hunkapiller M, Bolanos R, Delcher A, Dew I, Fasulo D, Flanigan M, Florea L, Halpern A, Hannenhalli S, Kravitz S, Levy S, Mobarry C, Reinert K, Remington K, Abu-Threideh J, Beasley E, Biddick K, Bonazzi V, Brandon R, Cargill M, Chandramouliswaran I, Charlab R, Chaturvedi K, Deng Z, Di Francesco V, Dunn P, Eilbeck K, Evangelista C, Gabrielian AE, Gan W, Ge W, Gong F, Gu Z, Guan P, Heiman TJ, Higgins ME, Ji RR, Ke Z, Ketchum KA, Lai Z, Lei Y, Li Z, Li J, Liang Y, Lin X, Lu F, Merkulov GV, Milshina N, Moore HM, Naik AK, Narayan VA, Neelam B, Nusskern D, Rusch DB, Salzberg S, Shao W, Shue B, Sun J, Wang Z, Wang A, Wang X, Wang J, Wei M, Wides R, Xiao C, Yan C, Yao A, Ye J, Zhan M, Zhang W, Zhang H, Zhao Q, Zheng L, Zhong F, Zhong W, Zhu S, Zhao S, Gilbert D, Baumhueter S, Spier G, Carter C, Cravchik A, Woodage T, Ali F, An H, Awe A, Baldwin D, Baden H, Barnstead M, Barrow I, Beeson K, Busam D, Carver A, Center A, Cheng ML, Curry L, Danaher S, Davenport L, Desilets R, Dietz S, Dodson K, Doup L, Ferriera S, Garg N, Gluecksmann A, Hart B, Haynes J, Haynes C, Heiner C, Hladun S, Hostin D, Houck J, Howland T, Ibegwam C, Johnson J, Kalush F, Kline L, Koduru S, Love A, Mann F, May D, McCawley S, McIntosh T, McMullen I, Moy M, Moy L, Murphy B, Nelson K, Pfannkoch C, Pratts E, Puri V, Qureshi H, Reardon M, Rodriguez R, Rogers YH, Romblad D, Ruhfel B, Scott R, Sitter C, Smallwood M, Stewart E, Strong R, Suh E, Thomas R, Tint NN, Tse S, Vech C, Wang G, Wetter J, Williams S, Williams M, Windsor S, Winn-Deen E, Wolfe K, Zaveri J, Zaveri K, Abril JF, Guigo R, Campbell MJ, Sjolander KV, Karlak B, Kejariwal A, Mi H, Lazareva B, Hatton T, Narechania A, Diemer K, Muruganujan A, Guo N, Sato S, Bafna V, Istrail S, Lippert R, Schwartz R, Walenz B, Yooseph S, Allen D, Basu A, Baxendale J, Blick L, Caminha M, Carnes-Stine J, Caulk P, Chiang YH, Coyne M, Dahlke C, Mays A, Dombroski M, Donnelly M, Ely D, Esparham S, Fosler C, Gire H, Glanowski S, Glasser K, Glodek A, Gorokhov M, Graham K, Gropman B, Harris M, Heil J, Henderson S, Hoover J, Jennings D, Jordan C, Jordan J, Kasha J, Kagan L, Kraft C, Levitsky A, Lewis M, Liu X, Lopez J, Ma D, Majoros W, McDaniel J, Murphy S, Newman M, Nguyen T, Nguyen N, Nodell M, Pan S, Peck J, Peterson M, Rowe W, Sanders R, Scott J, Simpson M, Smith T, Sprague A, Stockwell T, Turner R, Venter E, Wang M, Wen M, Wu D, Wu M, Xia A, Zandieh A, Zhu X, The sequence of the human genome. Science 291, 1304–1351 (2001). - PubMed
    1. Jaitin DA, Kenigsberg E, Keren-Shaul H, Elefant N, Paul F, Zaretsky I, Mildner A, Cohen N, Jung S, Tanay A, Amit I, Massively parallel single-cell RNA-seq for marker-free decomposition of tissues into cell types. Science 343, 776–779 (2014). - PMC - PubMed
    1. Shalek AK, Satija R, Shuga J, Trombetta JJ, Gennert D, Lu D, Chen P, Gertner RS, Gaublomme JT, Yosef N, Schwartz S, Fowler B, Weaver S, Wang J, Wang X, Ding R, Raychowdhury R, Friedman N, Hacohen N, Park H, May AP, Regev A, Single-cell RNA-seq reveals dynamic paracrine control of cellular variation. Nature 510, 363–369 (2014). - PMC - PubMed

Publication types