. 2018 Apr 20;360(6386):eaao1729.
doi: 10.1126/science.aao1729.

Systematic analysis of complex genetic interactions

Affiliations

Systematic analysis of complex genetic interactions

Elena Kuzmin et al. Science. .

Abstract

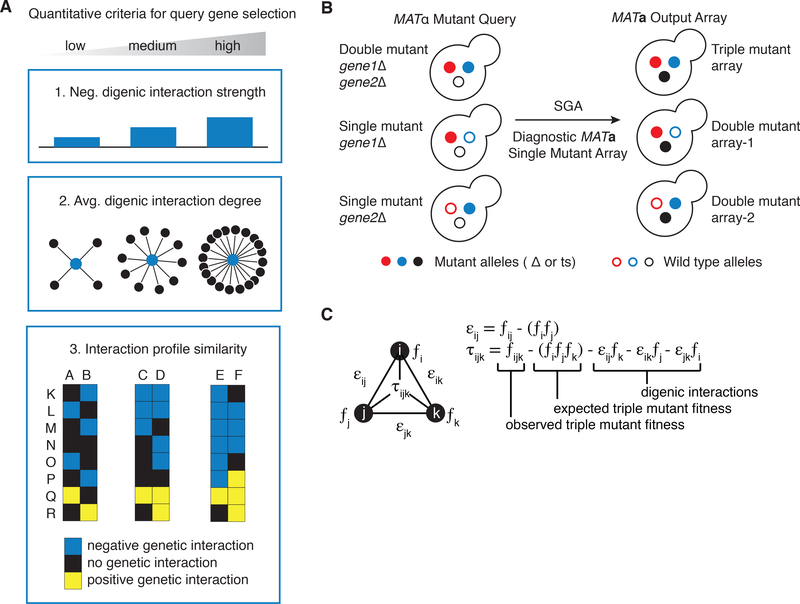
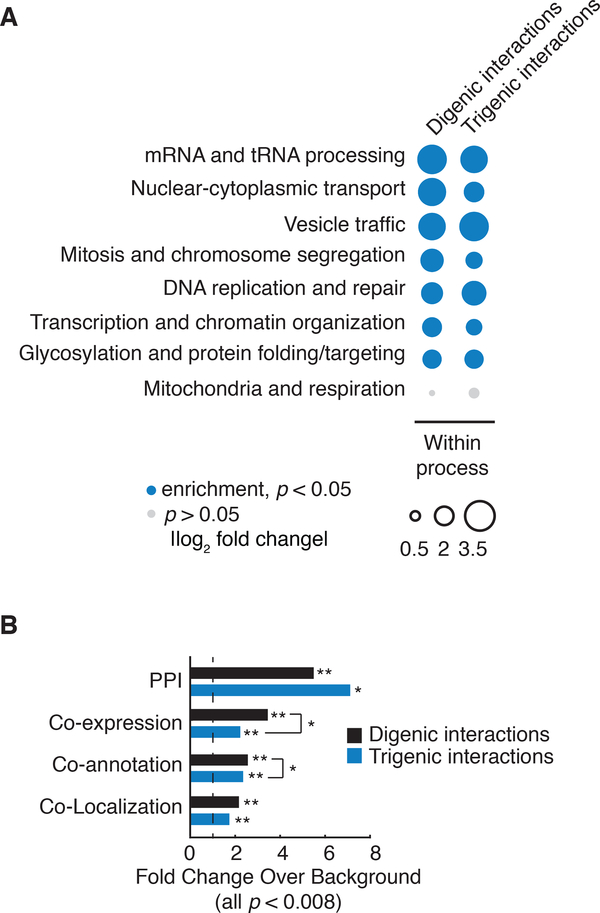
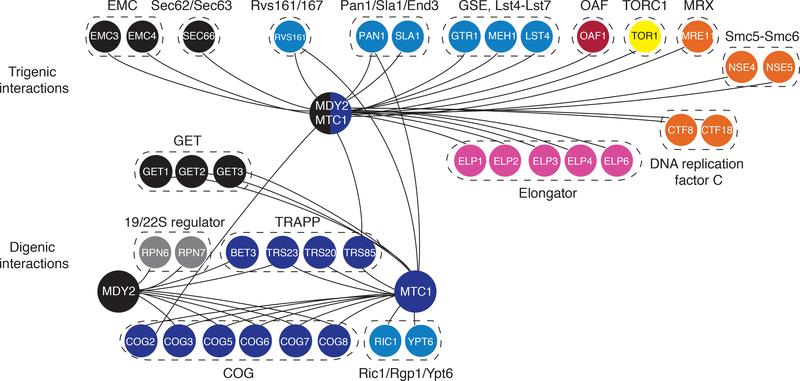
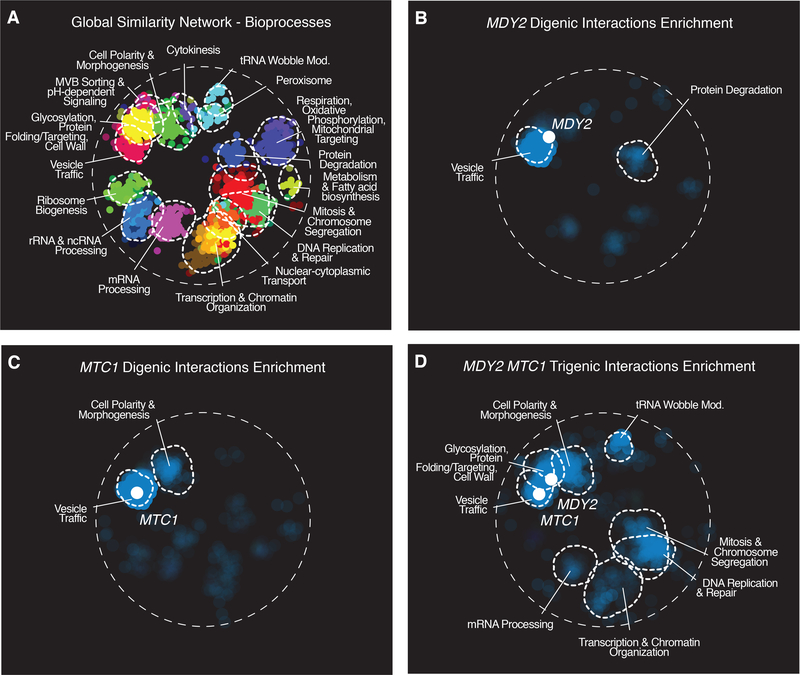
To systematically explore complex genetic interactions, we constructed ~200,000 yeast triple mutants and scored negative trigenic interactions. We selected double-mutant query genes across a broad spectrum of biological processes, spanning a range of quantitative features of the global digenic interaction network and tested for a genetic interaction with a third mutation. Trigenic interactions often occurred among functionally related genes, and essential genes were hubs on the trigenic network. Despite their functional enrichment, trigenic interactions tended to link genes in distant bioprocesses and displayed a weaker magnitude than digenic interactions. We estimate that the global trigenic interaction network is ~100 times as large as the global digenic network, highlighting the potential for complex genetic interactions to affect the biology of inheritance, including the genotype-to-phenotype relationship.


Conflict of interest statement

Competing interests: All authors declare that they have no competing interests.

Figures

Fig. 1.
Fig. 1.. Triple mutant Synthetic Genetic Array (SGA) analysis.
(A) Criteria for selecting query strains for sampling trigenic interaction landscape of singleton genes in yeast. The gene pairs were grouped into three general categories based on a range of feature as follows: 1) gene pairs directly connected by zero-very weak (0 to −0.08, n = 74), weak (−0.08 to −0.1, n = 32) or moderate (< −0.1, n = 45) negative digenic interaction; 2) low (10 to 45, n = 50), intermediate (46 to 70, n = 53), and high (> 71, n = 48) average digenic interaction degree (denoted by the number of black edges of each node); and 3) low (−0.02 to 0.03, n = 46, represented by genes A & B, which show a relatively low overlap of genetic interactions with genes K to R), intermediate (0.03 to 0.1, n = 59, represented by gene pair C & D, which display an intermediate overlap of genetic interactions) and high (> 0.1, n = 46, represented by gene pair E & F, which display a relatively high level of overlap of genetic interactions) functional similarity, as measured by their digenic interaction profile similarity and co-annotation to the same Gene Ontology term(s). Query mutant genes were either nonessential deletion mutant alleles (Δ) or conditional temperature sensitive (ts) alleles of essential genes. (B) Diagram illustrating the triple mutant SGA experimental strategy. To quantify a trigenic interaction, 3 types of screens are conducted in parallel. To estimate triple mutant fitness a double mutant query strain carrying two desired mutated genes of interest (red and blue filled circles) is crossed to a diagnostic array of single mutants (black filled circle). Meiosis is induced in heterozygous triple mutants and haploid triple mutant progeny is selected in sequential replica pinning steps. In parallel, single mutant control query strains are used to generate double mutants for fitness analysis. (C) Triple mutant SGA quantitative scoring strategy. The top equation shows the quantification of a digenic interaction, where ε is the digenic interaction score, ƒij is the observed double mutant fitness and the expected double mutant fitness is expressed as the product of single mutant fitness estimates ƒiƒj. The trigenic interaction score (τ) is derived from the digenic interaction score, where ƒijk is the observed triple mutant fitness, ƒiƒjƒk is triple mutant fitness expectation expressed as the product of three single mutant fitness estimates; the influence of digenic interactions is subtracted from the expectation, each digenic interaction is scaled by the fitness of the third mutation.
Fig. 2.
Fig. 2.. Functional characterization of trigenic interactions.
(A) Frequency of negative genetic interactions within biological processes. The fraction of screened query-array combinations exhibiting negative interactions belonging to functional gene sets annotated by SAFE on the global genetic interaction network (55). Within process received a count for any combination in which both genes for digenic interactions or all three genes for trigenic interactions, were annotated to the same term. The size of the circle assigned to each process-process element reflects the fold-increase over the background fraction of interactions (digenic = 0.023, trigenic = 0.016). Significance was assessed using hypergeometric cumulative distribution test, p < 0.05. Significant enrichment is shown in filled blue circle and no significant change is in grey. (B) Enrichment of negative digenic (black) and trigenic (blue) interactions across four functional standards. Black dashed line marks no enrichment. The functional standards are the following: merged protein-protein interaction (PPI) standard (–60), co-annotation is based on SAFE terms (7), co-expression (61), co-localization (62). Significance was assessed using hypergeometric cumulative distribution test, * represents 10−4p < 0.01, ** represents p < 10-4.
Fig. 3.
Fig. 3.. MDY2-MTC1 – a hub on the trigenic interaction network.
Representative digenic interactions are highlighted for MDY2 and MTC1 single mutant query genes, and representative trigenic interactions are shown for the MDY2-MTC1 double mutant query. The network was visualized using Cytoscape (63). Genes were chosen from representative protein complexes (8) in which ≥ 50% of members on the diagnostic array display genetic interactions. Negative genetic interactions, ε or τ < −0.08, p < 0.05, are depicted. All of the digenic and trigenic interactions displayed have been confirmed by tetrad analysis. Nodes are color coded based on their biological roles. Nodes are labeled with gene names and genes are grouped according to specific protein complexes.
Fig. 4.
Fig. 4.. Enrichment of genetic interactions within bioprocesses defined by a global network of digenic interaction profile similarities.
(A) The global digenic interaction profile similarity network (7) was annotated using SAFE (55), identifying network regions enriched for similar GO biological process terms as outlined in dashed white lines. (B) MDY2 digenic interactions showing bioprocess enrichments are highlighted. (C) MTC1 digenic interactions showing bioprocess enrichments are highlighted. (D) MDY2-MTC1 trigenic interactions showing bioprocess enrichment are highlighted.
Fig. 5.
Fig. 5.. Trigenic interactions reflect the physiology of MDY2-MTC1 double mutant query strain.
(A) Endocytic membrane trafficking is impaired in mdy2Δ mtc1Δ double mutant query strain. Example of tetrad analysis confirmations for the mdy2Δ mtc1Δ sla1Δ triple mutant strain. Endocytic uptake dynamics were examined with the Sla1-GFP reporter. Lifetime of Sla1-GFP endocytic vesicle formation was quantified across ~100 different patches in two independent experiments. Error bars represent s.d. Representative kymographs are displayed for wild-type and the mdy2Δ mtc1Δ double mutant. (B) Peroxisome biogenesis was monitored in wild-type, mdy2Δ, mtc1Δ, and mdy2Δ mtc1Δ mutants using Pex14p-GFP reporter. (C) Growth response to HU and MMS for wild-type, mdy2Δ, mtc1Δ, and mdy2Δ mtc1Δ mutants.
Fig. 6.
Fig. 6.. Trigenic interactions are more functionally distant than digenic interactions.
(A) Distribution of genetic interaction profile similarities of genes showing digenic and trigenic interactions. P-values are based on rank sum median test, all p < 10-34. (B) Frequency of negative genetic interactions between biological processes using SAFE annotations for digenic and trigenic interactions (55). The size of the circle assigned to each process-process element reflects the fold-increase over the background fraction of interactions (digenic = 0.023, trigenic = 0.016), p < 0.05 based on hypergeometric cumulative distribution test. The “between process” category received a count for any combinations that were not counted in the “within process” category shown in Fig. 2A. Significant enrichment is shown in filled blue circle, significant underenrichment in open blue circle, and no significant change is in grey. Trigenic vs. digenic fold change is the ratio of trigenic interaction enrichment to digenic interaction enrichment, and is shown as a filled square (black is maximal fold change, white is no fold change). In cases where the between-process enrichment was observed but is not significant at a p < 0.05, the square is outlined with a dashed line. (C) The number of SAFE bioprocess clusters enriched for digenic or trigenic interactions.
Fig. 7.
Fig. 7.. Relation of digenic and trigenic interaction networks.
(A) Trigenic interaction degree distribution correlated with three quantitative features of genes on the digenic interaction network: 1) Interaction profile similarity of the two genes in the double mutant query gene pair (bin thresholds: −0.02, 0.03, 0.1, +∞), which generates three bins for average digenic interaction profile similarity (r): −0.02 < r < 0.03; 0.03 ≤ r < 0.1; 0.1 ≤ r; 2) Negative digenic interaction strength associated with the double mutant query gene pair (bin thresholds: 0, −0.08, −0.1, −∞), which generates three bins for digenic interaction score (ε): ε < −0.1; −0.1 ≤ ε <−0.08; −0.08 ≤ ε < 0. Average digenic interaction degree, which represents the average number of negative genetic interactions associated with each of the genes of the double mutant query gene pair (bin thresholds: 10, 45, 70, +∞), which generates 3 bins for average digenic interaction degree: 10 ≤ degree < 45; 45 ≤ degree <70; 70 ≤ degree. The bin with the highest average negative trigenic interaction degree at the intermediate interaction score cut-off (τ < −0.08) of 63.5 is colored dark blue. (B) Essentiality determines trigenic interaction degree. No. single mutants: 254 nonessential genes, 47 essential genes. No. double mutants: 111 nonessential gene pairs, 40 essential or mixed essentiality gene pairs. Mean genetic interaction is shown, error bars: SEM, p values are based on a t-test. Negative genetic interactions, ε or τ < −0.08, p < 0.05, are depicted. (C) Cumulative distribution of negative digenic and trigenic interaction score magnitudes, pairwise significance was assessed using a Wilcoxon rank-sum test. (D) Estimates of the number of digenic and trigenic interactions at the intermediate score cut-off (ε or τ < −0.08, p < 0.05). Bootstrapping was used to generate the estimate by sampling 10,000 times with replacement, 95% C.I. is depicted by the dashed lines, the estimate of the extent of trigenic interaction landscape is denoted with a solid black line. This conservative estimate of the total number of trigenic interactions in the yeast genome covers approximately 26% of the interaction space, for the total genome-wide estimate see Fig. S15B, Table S3.

Comment in

References

    1. Hartman J. L. t., Garvik B, Hartwell L, Principles for the buffering of genetic variation. Science 291, 1001–1004 (2001). - PubMed
    1. Genomes Project C et al., A global reference for human genetic variation. Nature 526, 68–74 (2015). - PMC - PubMed
    1. Zuk O, Hechter E, Sunyaev SR, Lander ES, The mystery of missing heritability: Genetic interactions create phantom heritability. Proceedings of the National Academy of Sciences 109, 1193–1198 (2012). - PMC - PubMed
    1. Bloom JS, Ehrenreich IM, Loo WT, Lite TL, Kruglyak L, Finding the sources of missing heritability in a yeast cross. Nature 494, 234–237 (2013). - PMC - PubMed
    1. Bloom JS et al., Genetic interactions contribute less than additive effects to quantitative trait variation in yeast. Nat Commun 6, 8712 (2015). - PMC - PubMed

Publication types

MeSH terms

Substances