. 2018 Apr 20;360(6386):331-335.
doi: 10.1126/science.aao4750.

Developmental and oncogenic programs in H3K27M gliomas dissected by single-cell RNA-seq

Affiliations

Developmental and oncogenic programs in H3K27M gliomas dissected by single-cell RNA-seq

Mariella G Filbin et al. Science. .

Abstract

Gliomas with histone H3 lysine27-to-methionine mutations (H3K27M-glioma) arise primarily in the midline of the central nervous system of young children, suggesting a cooperation between genetics and cellular context in tumorigenesis. Although the genetics of H3K27M-glioma are well characterized, their cellular architecture remains uncharted. We performed single-cell RNA sequencing in 3321 cells from six primary H3K27M-glioma and matched models. We found that H3K27M-glioma primarily contain cells that resemble oligodendrocyte precursor cells (OPC-like), whereas more differentiated malignant cells are a minority. OPC-like cells exhibit greater proliferation and tumor-propagating potential than their more differentiated counterparts and are at least in part sustained by PDGFRA signaling. Our study characterizes oncogenic and developmental programs in H3K27M-glioma at single-cell resolution and across genetic subclones, suggesting potential therapeutic targets in this disease.


Conflict of interest statement

Competing interests: B.E.B. is an advisor and equity holder for Fulcrum Therapeutics, 1CellBio, and HiFiBio. A.R. is a scientific advisory board member for ThermoFisher Scientific, Syros Pharmaceuticals, and Driver Group. M.G.F., I.T., V.H., A.R., B.B., and M.L.Su. are co-inventors on a U.S. provisional patent application (U.S. 62/585,468) relating to advances described in this manuscript filed by the Broad Institute, MIT, and MGH. G.G. has patent applications on tools for cancer genome analysis. All other authors have no competing interests.

Figures

Fig. 1
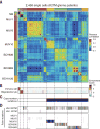
Fig. 1. Characterization of H3K27M-glioma by means of scRNA-seq
(A) Pairwise correlations between the expression profiles of 2458 single cells (rows, column) from six H3K27M-glioma samples (color bar). Two clusters of nonmalignant cells are marked as “NM.” (B) Enrichment score of microglia and oligodendrocyte signatures. (C) Inferred CNV profiles. Black indicates CNV present (fig. S4). (D) Gene mutations. (Top) H3K27M.; (Bottom) All other mutations identified per sample by means of WGS/WES. Black line indicates at least one mutated gene identified (fig. S6).
Fig. 2
Fig. 2. Intratumor heterogeneity in H3K27M-glioma
(A and B) Relative expression (color bar) across 2259 malignant cells (columns) of the top 30 genes for each of the combined expression programs P1, P2, and P3 [(A), rows] or 19 genes [(B), P4] that are preferentially expressed in cells with low expression of P1, P2, and P3 (8). (C) Plot of the lineage (x axis) and stemness ( y axis) scores for each of 2259 malignant cells (dots). Red dots indicate positive score for the cell cycle program. (D) In situ RNA hybridization of H3K27M glioma for astrocytic-like (APOE), OPC-like (PDGFRA), and proliferation (Ki-67) markers. Arrow highlights cell coexpressing PDGFRA and Ki-67.
Fig. 3
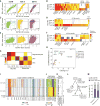
Fig. 3. Cellular hierarchies of H3K27M-glioma and IDH-mutant gliomas
(A, C, and E) Malignant cells (dots) from H3K27M, IDH-A, and IDH-O scored for the (A) AC-like, (C) OC-like, and (E) stem-like signatures of H3K27M-glioma (x axis) and of IDH-mutant gliomas (y axis). Correlation values are in the bottom right quadrant. (B, D, and F) Relative expression in (B) AC-like, (D) OC-like, and (F) stem-like cells in each glioma class (rows) of genes with preferential expression in the respective cell subset (8), with genes ordered into those common to H3K27M and IDH-mutant gliomas, or specific to either tumor type. (G) Relative expression (color bar) of OC-like and stem-like genes shared between (common) or specific to H3K27M and IDH-mutant gliomas in nonmalignant oligodendrocytes, OPCs, and NPCs (5). (H) Percentage of cycling cells (x axis) and undifferentiated cells (y axis) in each glioma sample, marked by type and grade. (I)CNVs, (J) haplotype frequencies, and (K) point mutations in selected genes identified with WGS (columns) inferred for individual malignant cells (rows) from BCH869. Dashed lines indicate four subclones based on CNV and haplotype profiles. (L) Inferred phylogenetic tree (8) of individual subclones detected for BCH869. Circle sizes indicate relative number of cells in subclone. Genetic events are indicated at the inferred point of their first detection. (M) Relative number of malignant cells classified into OPC-, AC-, or OC-like states for BCH869 subclone 1 or the combination of subclones 2 and 3.
Fig. 4
Fig. 4. Single-cell comparisons of matched H3K27M-glioma patient sample, PDX, and culture models for tumor BCH869
(A) Cells ordered by sample type and within each sample by means of hierarchical clustering (fig. S19). (B) Heatmap shows expression of the top 30 genes of the cell cycle and lineage programs (P1 to P4) described in Fig. 2 and in (8), for cells ordered as in (A). (C) (Left) Mouse brain magnetic resonance images (MRIs) with three-dimensional reconstruction at 22 weeks after injection of 200,000 BCH869 cells. (Right) MRI tumor volume (8). **P < 0.01 by paired, two-tailed Student’s t test. Error bars indicate SEM. (D) Heatmap shows expression of differentially expressed genes between sample types, for each pairwise comparison. Cells are ordered as in (A). (Right) Average expression in each sample type. (E) Model of H3K27M-glioma cellular architecture (right) compared with normal development (left).

Comment in

  • Inverted architecture.
    Seton-Rogers S. Seton-Rogers S. Nat Rev Cancer. 2018 Jul;18(7):405. doi: 10.1038/s41568-018-0025-4. Nat Rev Cancer. 2018. PMID: 29802352 No abstract available.

References

    1. Sturm D, et al. Nat. Rev. Cancer. 2014;14:92–107. - PMC - PubMed
    1. Funato K, Major T, Lewis PW, Allis CD, Tabar V. Science. 2014;346:1529–1533. - PMC - PubMed
    1. Lewis PW, et al. Science. 2013;340:857–861. - PMC - PubMed
    1. Patel AP, et al. Science. 2014;344:1396–1401. - PMC - PubMed
    1. Tirosh I, et al. Nature. 2016;539:309–313. - PMC - PubMed

Publication types

MeSH terms

Substances