. 2018 Apr 19;9(1):1551.
doi: 10.1038/s41467-018-03998-z.

Reduced oxidative capacity in macrophages results in systemic insulin resistance

Affiliations

Reduced oxidative capacity in macrophages results in systemic insulin resistance

Saet-Byel Jung et al. Nat Commun. .

Abstract

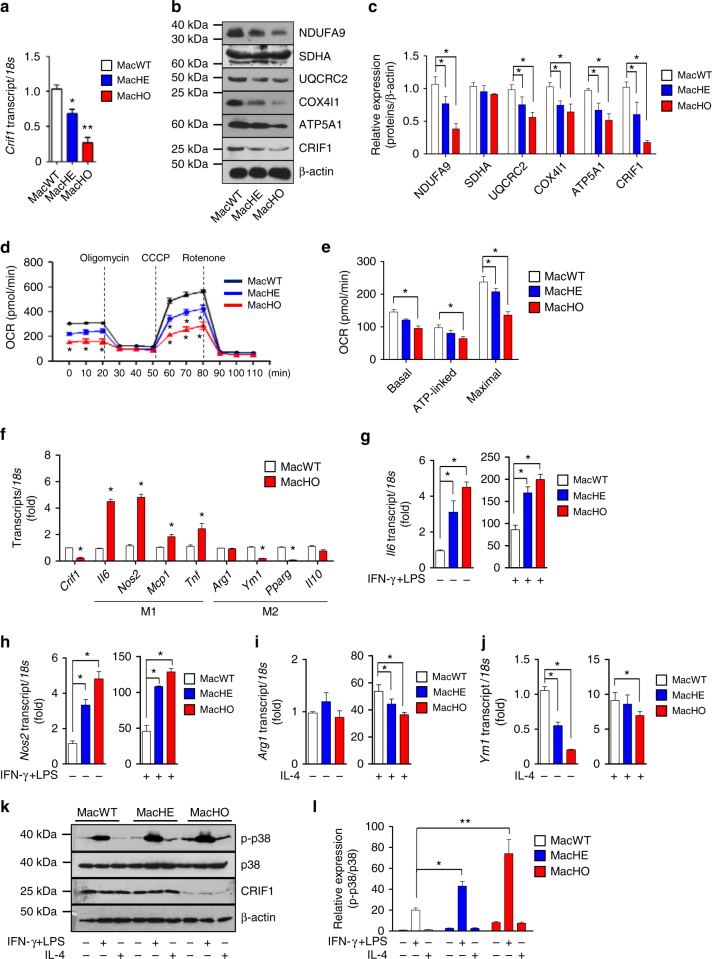
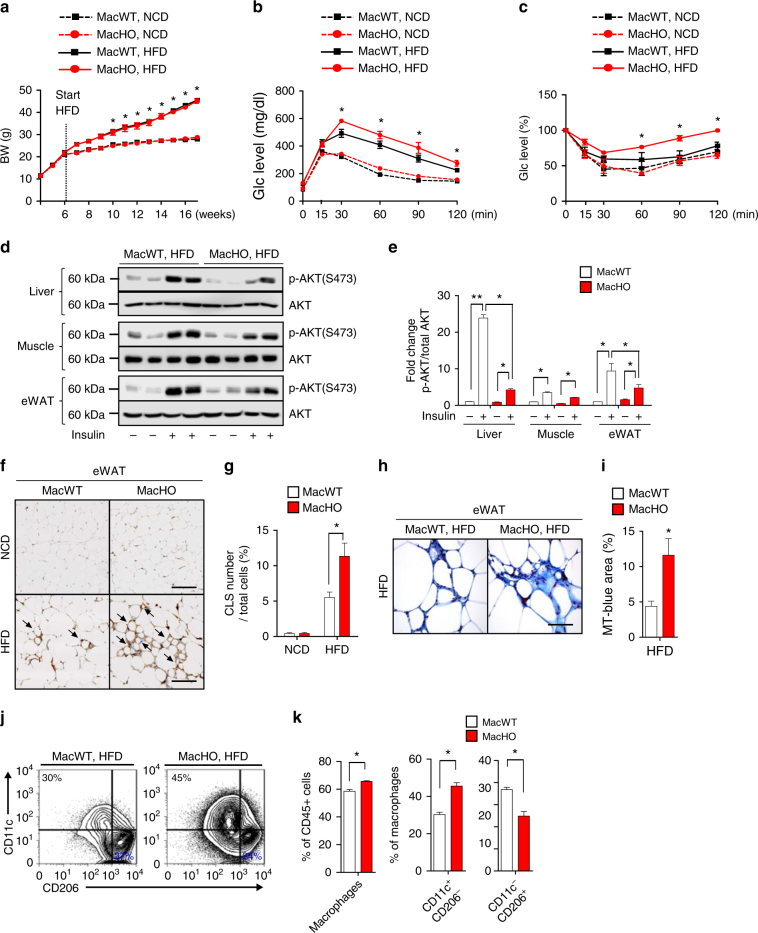
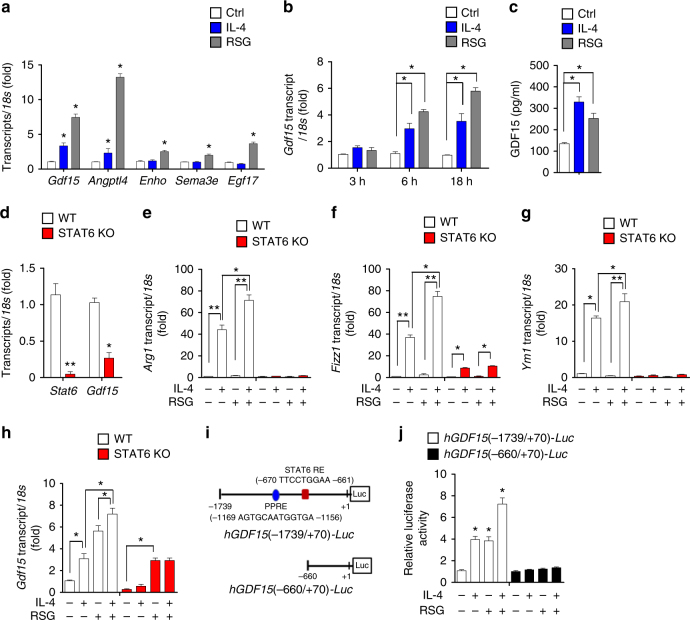
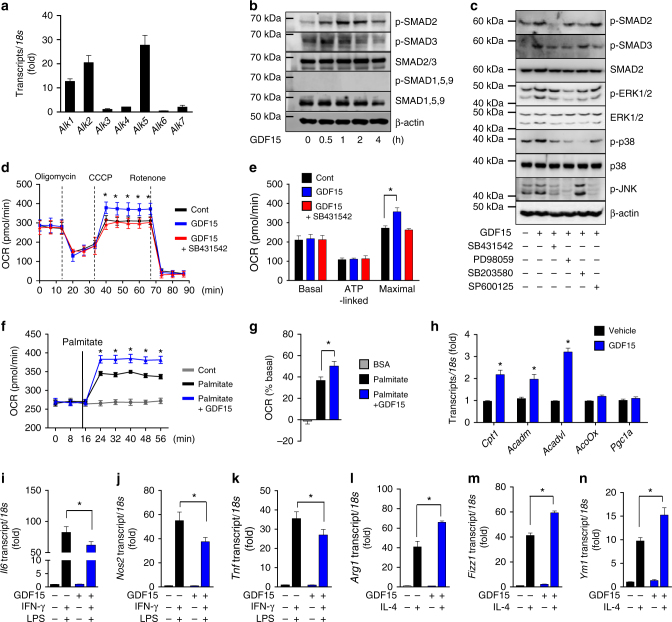
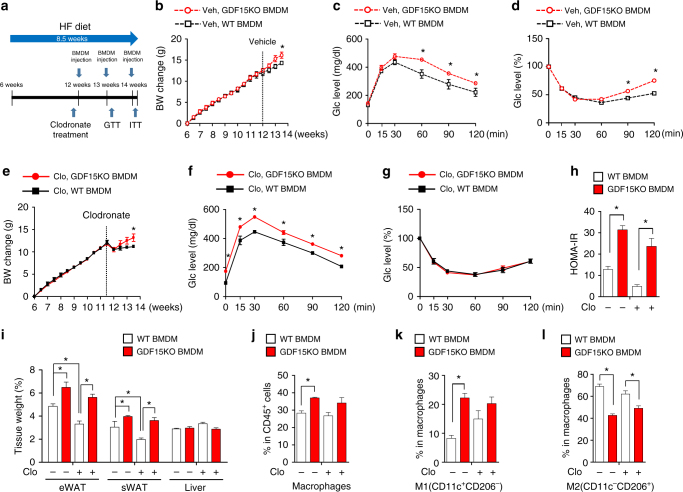
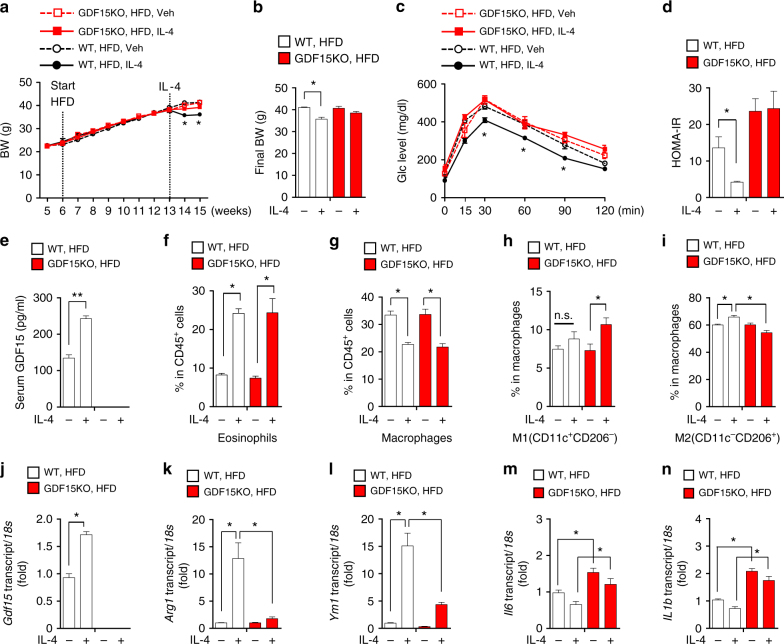
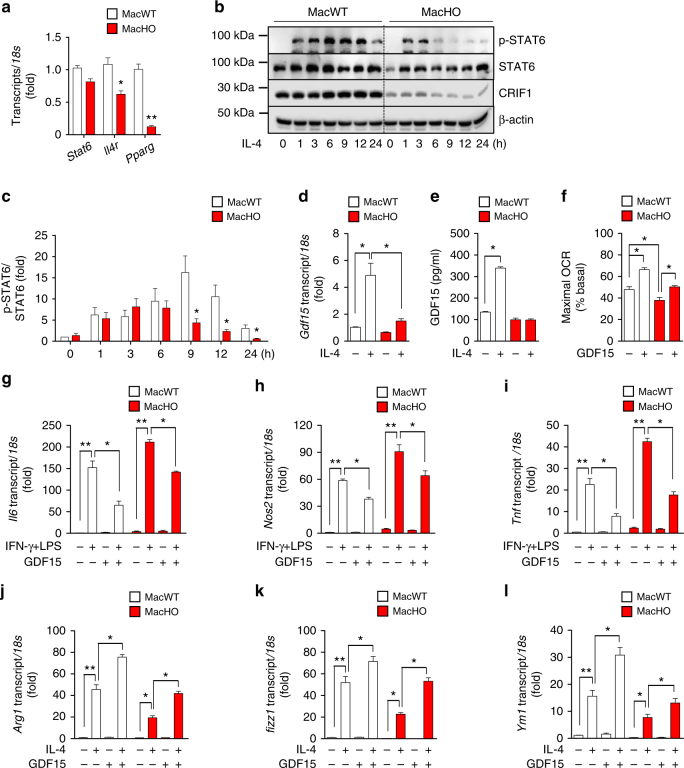
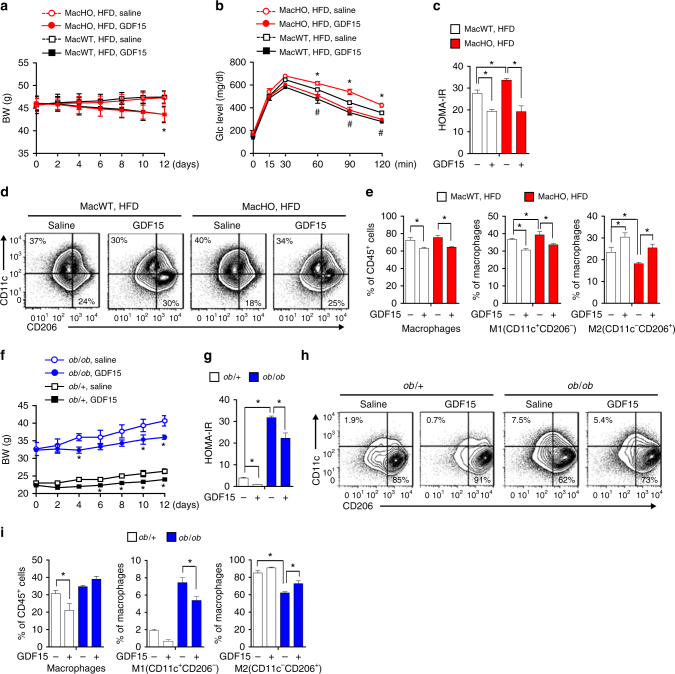
Oxidative functions of adipose tissue macrophages control the polarization of M1-like and M2-like phenotypes, but whether reduced macrophage oxidative function causes systemic insulin resistance in vivo is not clear. Here, we show that mice with reduced mitochondrial oxidative phosphorylation (OxPhos) due to myeloid-specific deletion of CR6-interacting factor 1 (Crif1), an essential mitoribosomal factor involved in biogenesis of OxPhos subunits, have M1-like polarization of macrophages and systemic insulin resistance with adipose inflammation. Macrophage GDF15 expression is reduced in mice with impaired oxidative function, but induced upon stimulation with rosiglitazone and IL-4. GDF15 upregulates the oxidative function of macrophages, leading to M2-like polarization, and reverses insulin resistance in ob/ob mice and HFD-fed mice with myeloid-specific deletion of Crif1. Thus, reduced macrophage oxidative function controls systemic insulin resistance and adipose inflammation, which can be reversed with GDF15 and leads to improved oxidative function of macrophages.


Conflict of interest statement

The authors declare no competing interests.

Figures

Fig. 1
Fig. 1
Oxidative dysfunction by CRIF1 deficiency increases M1-like macrophages a Real-time PCR analysis of Crif1 in BMDMs from 8-week-old MacWT, MacHE, and MacHO mice. b, c Immunoblot analysis of OxPhos complex and CRIF1 expression in BMDMs from 8-week-old MacWT, MacHE, and MacHO mice. d, e Oxygen consumption rates (OCR) in BMDMs from 8-week-old MacWT, MacHE, and MacHO mice. CCCP: carbonyl cyanide m-chlorophenyl hydrazone. f Real-time PCR analysis of M1-related and M2-related genes in BMDMs from 8-week-old MacWT and MacHO mice. g, h Real-time PCR analysis of Il6 and Nos2 mRNA expression in the presence or absence of IFN-γ (10 ng/ml) and LPS (100 ng/ml). i, j Real-time PCR analysis of Arg1 and Ym1 mRNA expression in the presence or absence of IL-4 (20 ng/ml). k, l Immunoblot analysis of p38 phosphorylation after exposure to IFN-γ (10 ng/ml) and LPS (100 ng/ml) for 30 min. Data are expressed as means ± SEM and are representative of three independent experiments (n = 5 mice per group). *p < 0.05 or **p < 0.01 (two-tailed Student’s t test)
Fig. 2
Fig. 2
MacHO mice fed a HFD exhibit systemic insulin resistance. (a) Body weight of MacWT and MacHO mice fed a NCD or HFD for 10 weeks (MacWT, n = 5; MacHO, n = 5). b, c MacWT or MacHO mice fed a NCD or HFD were subjected to IPGTT after a 16 h fast and an insulin tolerance test after a 4 h fast (MacWT, n = 5; MacHO, n = 5). d, e Immunoblot analysis of AKT (S473) phosphorylation in liver, muscle, and eWAT 30 min after intraperitoneal injection of insulin into MacWT or MacHO mice fed a HFD. f, g Immunohistochemical analysis (staining with an anti-F4/80 antibody and hematoxylin) of macrophages in eWAT of MacWT or MacHO mice fed a HFD. Scale bar: 200 μm. h, i Masson’s trichrome staining (for fibrosis) of eWAT from MacWT or MacHO mice fed a HFD. Scale bar: 50 μm. (j and k) FACS analysis of total macrophages (CD45+/F4/80+/CD11b+) and M1 (CD11c+/CD206-) and M2 (CD11c/CD206+) macrophages infiltrated into eWAT of MacWT or MacHO mice fed a HFD. Data represent means ± SEM and are representative of three independent experiments. *p < 0.05 or **p < 0.01 (two-tailed Student’s t test)
Fig. 3
Fig. 3
PPARγ agonist and STAT6 modulate GDF15 expression. a Real-time PCR analysis of Gdf15, Angptl4, Enho, Sema3e, and Egf17 mRNA expression in BMDMs 18 h after treatment with rosiglitazone (RSG) (10 μM) and IL-4 (100 ng/ml). b Real-time PCR analysis of Gdf15 mRNA in BMDMs 3, 6, and 18 h after treatment with rosiglitazone (10 μM) and IL-4 (100 ng/ml). c GDF15 levels in culture supernatants from BMDMs treated with rosiglitazone (10 μM) and IL-4 (100 ng/ml) for 48 h. d Real-time PCR analysis of Stat6 and Gdf15 mRNA expression in BMDMs from WT and Stat6-KO mice. eh Real-time PCR analysis of Arg1, Fizz1, Ym1, and Gdf15 mRNA expression in BMDMs after 18 h treatment with rosiglitazone (10 μM) and IL-4 (100 ng/ml) from WT and Stat6-KO mice. i Schematic structure of reporter constructs containing a 1739 or 660 bp fragment of the human GDF15 promoter. j Relative luciferase activity induced by the human GDF15 promoter in RAW264.7 cells transfected with hGDF15(-1739/+70)-Luc or hGDF15(-660/+70)-Luc and cultured with or without rosiglitazone (10 μM) and IL-4 (100 ng/ml) for 24 h. Data are expressed as means ± SEM and are representative of three independent experiments. *p < 0.05 or **p < 0.01 (two-tailed Student’s t-test)
Fig. 4
Fig. 4
GDF15 promotes oxidative metabolism and M2-like polarization. a Real-time PCR analysis of TGF-β RI (Alk1–7) expression in BMDMs. b Immunoblot analysis of rGDF15-induced phosphorylation of SMAD2 and 3. c Immunoblot analysis of rGDF15-induced phosphorylation of SMAD2, SMAD3, ERK1/2, p38, and JNK, which was inhibited by the chemical inhibitors, SB431542 (an ALK4, 5, 7 inhibitor; 5 μM), PD98059 (an ERK1/2 inhibitor; 25 μM), SB203580 (a p38 inhibitor; 10 μM), and SP600125 (a JNK inhibitor; 10 μM). d, e OCR in BMDMs treated with rGDF15 (300 ng/ml) for 24 h with or without SB431542 (5 μM). f, g Fatty acid oxidation in BMDMs treated with rGDF15 (300 ng/ml) for 24 h with or without palmitate-BSA (200 μM). h Real-time PCR analysis of FAO-related genes in rGDF15 (300 ng/ml)-treated BMDMs. ik Real-time PCR analysis of M1-related gene expression in rGDF15 (300 ng/ml)-treated BMDMs in the presence of IFN-γ (10 ng/ml) and LPS (100 ng/ml). (ln) Real-time PCR analysis of M2-related gene expression in rGDF15-treated BMDMs in the presence of IL-4 (20 ng/ml). Data are expressed as means ± SEM and are representative of three independent experiments. *p < 0.05 or **p < 0.01 (two-tailed Student’s t test)
Fig. 5
Fig. 5
Adoptive transfer of GDF15KO macrophages aggravates glucose tolerance. a Diagram representing the experimental design. b Body weight change of PBS-liposome-treated HFD-fed mice intravenously injected with BMDMs from WT or Gdf15-KO (n = 5 per group). c, d IPGTT after a 16 h fast and an ITT after a 4 h fast (n = 5 per group). e Body weight change of clodronate liposome–treated HFD-fed mice injected with BMDMs from WT or Gdf15-KO (n = 5 per group). f, g IPGTT after a 16 h fast and ITT after a 4 h fast (n = 5 per group). h HOMA-IR of PBS or clodronate liposome-treated HFD-fed mice injected with BMDMs from WT or Gdf15-KO (n = 5 per group). i Tissue weight of PBS or clodronate liposome-treated HFD-fed mice injected with BMDM from WT or Gdf15-KO (n = 5 per group). jl FACS analysis of total macrophages (CD45+/F4/80+/CD11b+) and M1 (CD11c+/CD206-) and M2 (CD11c/CD206+) macrophages infiltrated into the eWAT. Data represent means ± SEM and are representative of three independent experiments. *p < 0.05 (two-tailed Student’s t-test)
Fig. 6
Fig. 6
GDF15 deficiency prevents improvement of insulin sensitivity by rIL-4. a, b Body weight of WT and Gdf15-KO mice fed a HFD for 7 weeks and then intraperitoneally injected with rIL-4 (50 μg/kg) for 2 weeks (n = 5 per group). c WT or Gdf15-KO mice fed a HFD after injection of IL-4 were subjected to an IPGTT after a 16 h fast. d HOMA-IR of HFD-fed WT and Gdf15-KO mice after treatment with rIL-4. e Serum GDF15 level of HFD-fed WT and Gdf15-KO mice after treatment with rIL-4. fi FACS analysis of eosinophils (CD45+/CD11b+/SiglecF+), macrophages (CD45+/F4/80+/CD11b+), and M1 (CD11c+/CD206) and M2 (CD11c/CD206+) macrophages infiltrated into eWAT. j Real-time PCR analysis of Gdf15 mRNA in CD11b+ cells from eWAT of WT and Gdf15-KO mice treated with rIL-4. kn Real-time PCR analysis of Arg1, Ym1, Il6, and Il1b mRNAs in CD11b+ cells from eWAT of WT and Gdf15-KO mice treated with rIL-4. Data are expressed as means ± SEM and are representative of three independent experiments. *p < 0.05 (two-tailed Student’s t-test)
Fig. 7
Fig. 7
Macrophages from MacHO mice secrete less GDF15 upon stimulation with rIL-4. a Real-time PCR analysis of Stat6, Il4r, and Pparg gene expression in BMDMs from 8-week-old MacWT and MacHO mice. b, c Immunoblot analysis of STAT6 phosphorylation in BMDMs from 8-week-old MacWT and MacHO mice after treatment with rIL-4 (100 ng/ml). d Real-time PCR analysis of Gdf15 mRNA expression in BMDMs from 8-week-old MacWT and MacHO mice in the presence/absence of rIL-4 (100 ng/ml). e GDF15 levels in culture supernatants of MacWT and MacHO BMDMs from 8-week-old mice after treatment with rIL-4 (100 ng/ml) for 48 h. f OCR in BMDMs from 8-week-old MacWT (n = 5) and MacHO mice (n = 5) treated with rGDF15 (300 ng/ml) for 24 h. gi Real-time PCR analysis of Il6, Nos2, and Tnf mRNA after treatment with rGDF15 (300 ng/ml) in the presence or absence of IFN-γ (10 ng/ml) and LPS (100 ng/ml). jl Real-time PCR analysis of Arg1, Fizz1, and Ym1 mRNA expression after treatment with rGDF15 (300 ng/ml) in the presence/absence of rIL-4 (20 ng/ml). Data are expressed as means ± SEM and are representative of three independent experiments. *p < 0.05 or **p < 0.01 (two-tailed Student’s t-test)
Fig. 8
Fig. 8
GDF15 reverses insulin resistance caused by reduced oxidative function. a Body weight changes in MacWT or MacHO mice fed a HFD for 12 weeks and intraperitoneally injected with rGDF15 (300 μg/kg) every other day for 2 weeks (n = 5 per group). b IPGTT performed after rGDF15 treatment. c HOMA-IR of HFD-fed MacWT and MacHO mice after treatment with rGDF15. d, e FACS analysis of macrophages (CD45+/F4/80+/CD11b+) and M1 (CD11c+/CD206-) and M2 (CD11c-/CD206+) macrophages infiltrated into eWAT. f Body weight changes in ob/+ and ob/ob mice treated with rGDF15 (300 μg/kg) for 2 weeks (n = 5 per group). g HOMA-IR of ob/+ and ob/ob mice after GDF15 treatment. h, i FACS analysis of macrophages (CD45+/F4/80+/CD11b+) and M1 (CD11c+/CD206-) and M2 (CD11c-/CD206+) macrophages infiltrated into eWAT of ob/+ and ob/ob mice. Data represent means ± SEM and are representative of three independent experiments. *p < 0.05 (two-tailed Student’s t-test)

References

    1. Weisberg SP, et al. Obesity is associated with macrophage accumulation in adipose tissue. J. Clin. Investig. 2003;112:1796–1808. doi: 10.1172/JCI200319246. - DOI - PMC - PubMed
    1. Lackey DE, Olefsky JM. Regulation of metabolism by the innate immune system. Nat. Rev. Endocrinol. 2016;12:15–28. doi: 10.1038/nrendo.2015.189. - DOI - PubMed
    1. Xu H, et al. Chronic inflammation in fat plays a crucial role in the development of obesity-related insulin resistance. J. Clin. Investig. 2003;112:1821–1830. doi: 10.1172/JCI200319451. - DOI - PMC - PubMed
    1. Olefsky JM, Glass CK. Macrophages, inflammation, and insulin resistance. Annu. Rev. Physiol. 2010;72:219–246. doi: 10.1146/annurev-physiol-021909-135846. - DOI - PubMed
    1. Anthony RM, et al. Memory T(H)2 cells induce alternatively activated macrophages to mediate protection against nematode parasites. Nat. Med. 2006;12:955–960. doi: 10.1038/nm1451. - DOI - PMC - PubMed

Publication types