. 2018 Apr 5:9:305.
doi: 10.3389/fphar.2018.00305. eCollection 2018.

Frequency of CYP2D6 Alleles Including Structural Variants in the United States

Affiliations

Frequency of CYP2D6 Alleles Including Structural Variants in the United States

Andria L Del Tredici et al. Front Pharmacol. .

Abstract

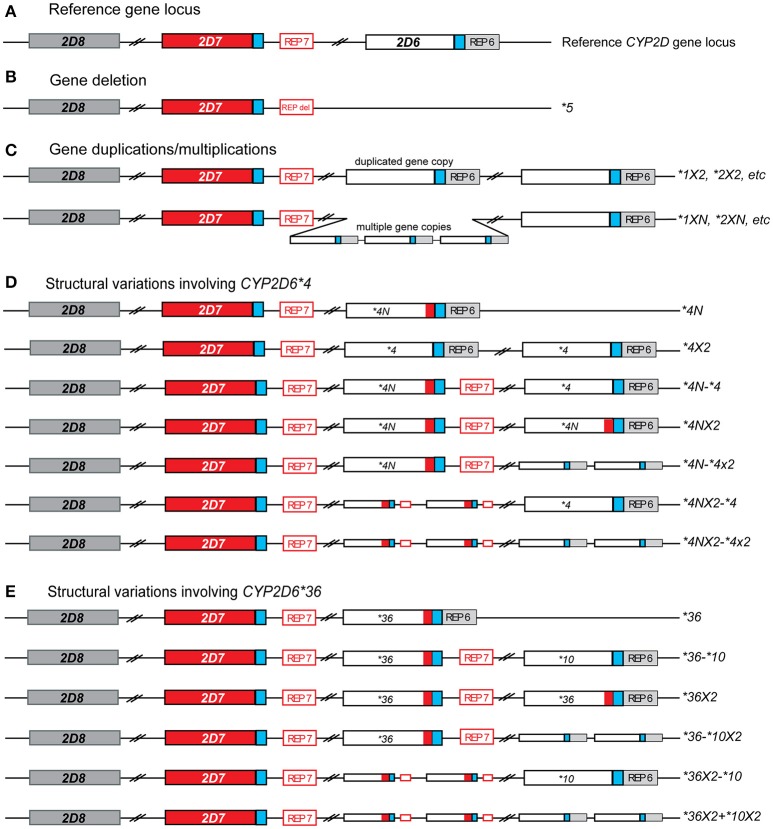
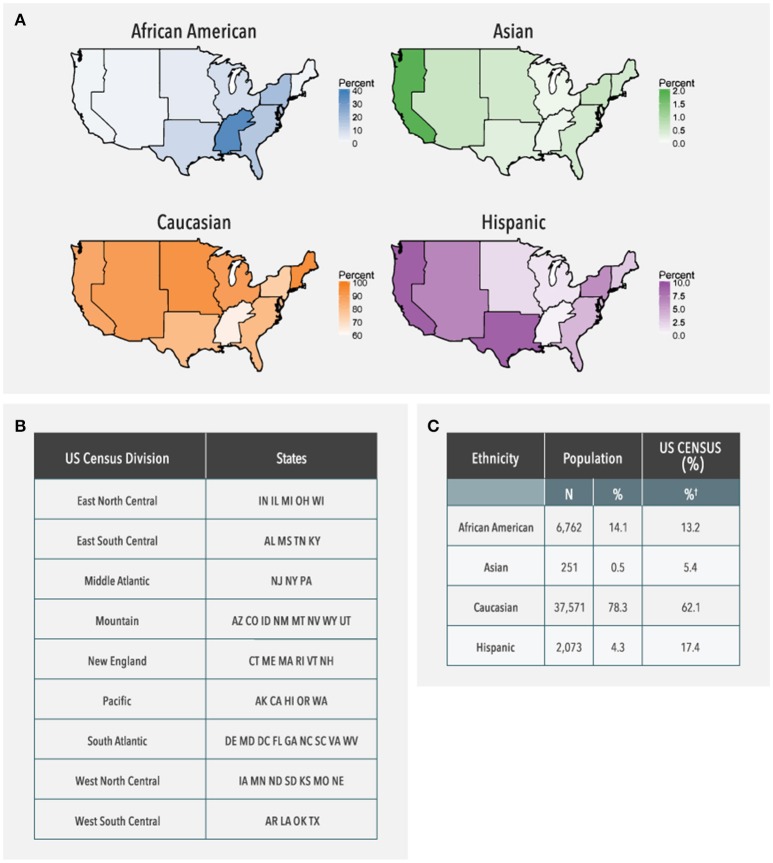
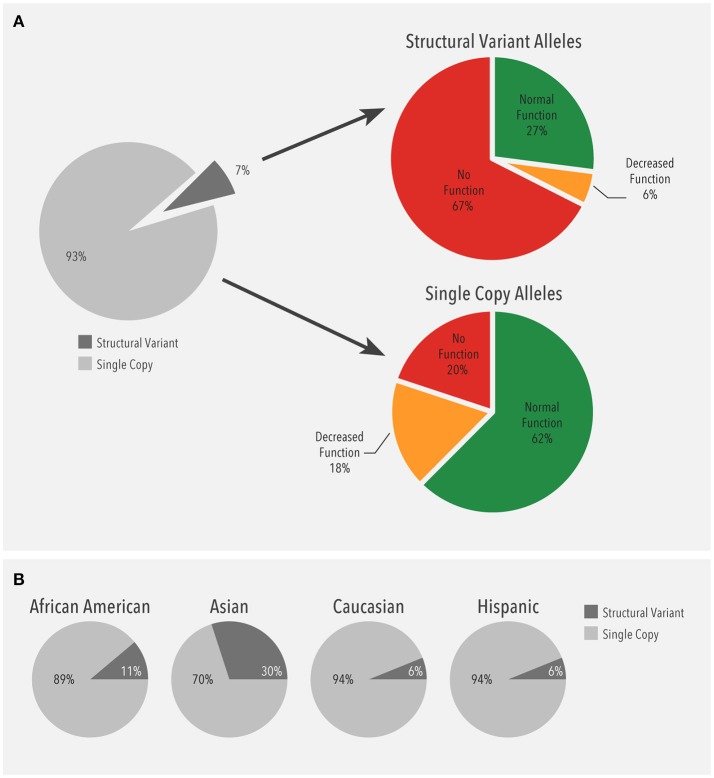
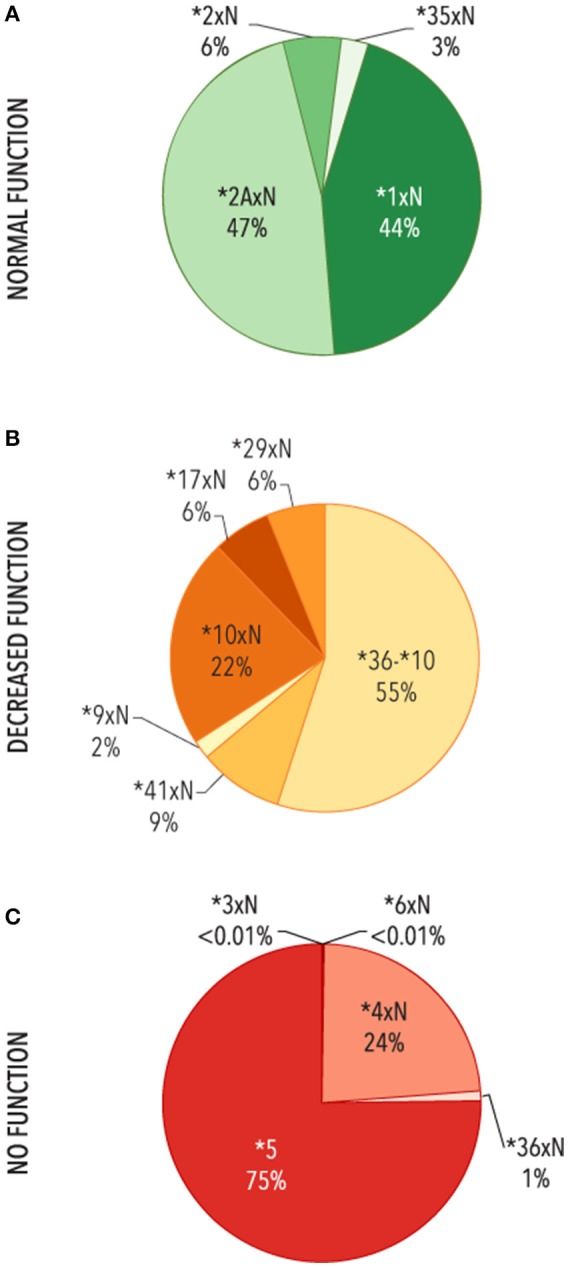
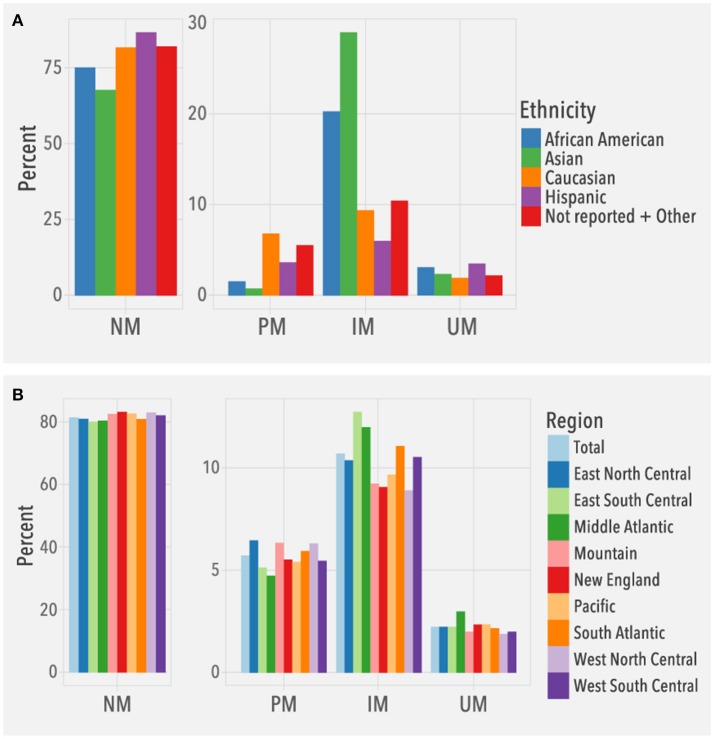
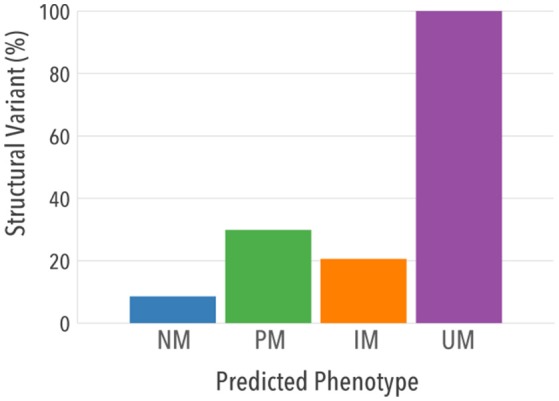
The CYP2D6 gene encodes an enzyme important in the metabolism of many commonly used medications. Variation in CYP2D6 is associated with inter-individual differences in medication response, and genetic testing is used to optimize medication therapy. This report describes a retrospective study of CYP2D6 allele frequencies in a large population of 104,509 de-identified patient samples across all regions of the United States (US). Thirty-seven unique CYP2D6 alleles including structural variants were identified. A majority of these alleles had frequencies which matched published frequency data from smaller studies, while eight had no previously published frequencies. Importantly, CYP2D6 structural variants were observed in 13.1% of individuals and accounted for 7% of the total variants observed. The majority of structural variants detected (73%) were decreased-function or no-function alleles. As such, structural variants were found in approximately one-third (30%) of CYP2D6 poor metabolizers in this study. This is the first CYP2D6 study to evaluate, with a consistent methodology, both structural variants and single copy alleles in a large US population, and the results suggest that structural variants have a substantial impact on CYP2D6 function.

Keywords: CYP2D6; copy number variation; cytochrome P450; drug metabolism; pharmacogenetics.


Figures

Figure 1
Figure 1
Overview of structural CYP2D6 variants identified in this study. (A) Reference gene locus consisting of CYP2D6 and two pseudo genes, CYP2D7 (red), and CYP2D8 (dark gray). Blue boxed indicate almost-identical downstream sequences and the open red and gray boxes labeled REP7 and REP6 represent regions with repetitive elements located downstream of CYP2D6 and CYP2D7, respectively. (B) Deletion that includes the entire CYP2D6 gene. The deletion breakpoints are within the near-identical REP6 and REP7 elements which are fused to the REP-DEL element in the CYP2D6*5 gene deletion allele. (C) Allelic variants carrying two or more identical gene copies. These may include duplications/multiplications of functional variants (i.e., CYP2D6 *1XN) or no function variants (CYP2D6 *4XN). This group does not include tandem arrangements, in which two or more different gene copies are present on an allele (see E). (D) Structural variants including CYP2D6 *4. The red box within CYP2D6*4 gene copies indicates the presence of CYP2D7-derived sequences in exon 9, also known as the “exon 9 conversion” (these are designated CYP2D6*4N). (E) The CYP2D6 *36 variant, which includes a CYP2D7-derived exon 9 conversion, can be found in different structural variants. The most commonly found is the CYP2D6 *36-*10 tandem arrangement. In this study CYP2D6 *36 alone was included in the single gene copy variants, not structural variants.
Figure 2
Figure 2
Ethnicity distribution of the study population based on geographical region. (A) US Maps shaded in proportion to the adjusted frequency of the study population for each ethnicity in each geographic region. The bar next to each choropleth map indicates how the shading varies based on frequency which is adjusted for the percentage of samples with reported ethnicity in each region (38–61%). Alaska and Hawaii are not shown on the choropleth, but were included in the data analysis. (B) Geographic regions as defined by states by the US Census Bureau. (C) Frequency of each ethnic group in the entire study population as compared to expected frequencies from the US Census Bureau. US Census data is provided only for those groups that are represented in the current study population; therefore, these percentages do not sum to 100%.
Figure 3
Figure 3
(A) Frequency of alleles with a single gene copy (n = 195,094) and structural variants (n = 13,924). Structural variants (SV) include copy number variants (CNVs) such as gene deletions and duplications, tandems, and rearrangements. (B) Ethnicity-specific frequency of alleles with a single gene copy and structural variants. Structural variants (SV) include copy number variants (CNVs) such as gene deletions and duplications, tandems, and rearrangements.
Figure 4
Figure 4
Functional categories of structural variants. Frequency of alleles which include (A) 2 or more copies of normal function genes (N = 3,763), (B) ≥ two copies of decreased function variants or tandems with decreased function (n = 753), (C) gene deletions (CYP2D6 *5) or ≥ 2 copies of variants with no function (n = 9,395). Functional status is defined based on the functional category for the single gene copy. *4xN represents *4N-*4, *4N-*4xN, *4NxN, *4NxN-*4, *4NxN-*4xN, and *4xN. 36-*10 represents *36-*10, *36-*10xN, *36xN-*10, and *36xN-*10xN.
Figure 5
Figure 5
Predicted phenotype frequencies. Frequencies are based on (A) ethnicity (N = 104,509) and (B) geographical regions (N = 104,384; Puerto Rico not included). NM, normal metabolizer, PM, poor metabolizer, IM, intermediate metabolizer, UM, ultrarapid metabolizer.
Figure 6
Figure 6
Contribution of structural variants and single copy variants to predicted phenotypes. Proportion of individuals in each predicted phenotype that had at least one structural variant is shown.

References

    1. (2016a). US Census Bureau: Divisions. Available online at: http://www2.census.gov/geo/pdfs/maps-data/maps/reference/us_regdiv.pdf
    1. (2016b). US Census Bureau: Ethnicity Percentages. Available online at: http://www.census.gov/quickfacts/table/PST045214/00
    1. Bell G. C., Caudle K. E., Whirl-Carrillo M., Gordon R. J., Hikino K., Prows C. A., et al. . (2017). Clinical Pharmacogenetics Implementation Consortium (CPIC) guideline for CYP2D6 genotype and use of ondansetron and tropisetron. Clin. Pharmacol. Ther. 102, 213–218. 10.1002/cpt.598 - DOI - PMC - PubMed
    1. Beoris M., Amos Wilson J., Garces J. A., Lukowiak A. A. (2016). CYP2D6 copy number distribution in the US population. Pharmacogenet. Genomics 26, 96–99. 10.1097/FPC.0000000000000188 - DOI - PMC - PubMed
    1. Bernard S., Neville K. A., Nguyen A. T., Flockhart D. A. (2006). Interethnic differences in genetic polymorphisms of CYP2D6 in the U.S. population: clinical implications. Oncologist 11, 126–135. 10.1634/theoncologist.11-2-126 - DOI - PubMed