

Exploiting exciton coupling of ligand radical intervalence charge transfer transitions to tune NIR absorption
- PMID: 29675206
- PMCID: PMC5887452
- DOI: 10.1039/c7sc04537a
Exploiting exciton coupling of ligand radical intervalence charge transfer transitions to tune NIR absorption
Abstract
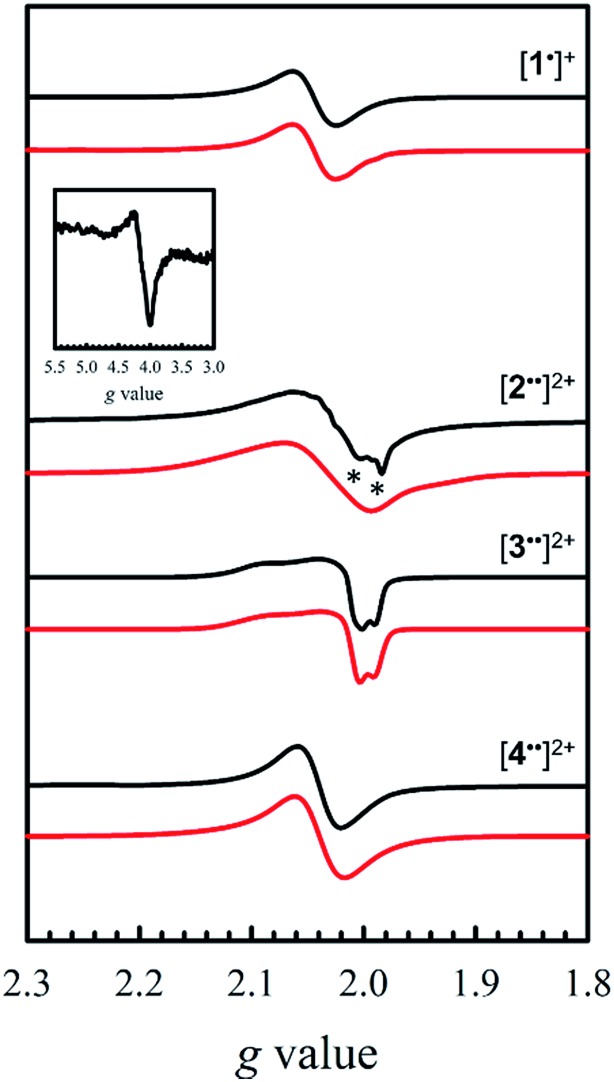
We detail the rational design of a series of bimetallic bis-ligand radical Ni salen complexes in which the relative orientation of the ligand radical chromophores provides a mechanism to tune the energy of intense intervalence charge transfer (IVCT) bands in the near infrared (NIR) region. Through a suite of experimental (electrochemistry, electron paramagnetic resonance spectroscopy, UV-vis-NIR spectroscopy) and theoretical (density functional theory) techniques, we demonstrate that bimetallic Ni salen complexes form bis-ligand radicals upon two-electron oxidation, whose NIR absorption energies depend on the geometry imposed in the bis-ligand radical complex. Relative to the oxidized monomer [1˙]+ (E = 4500 cm-1, ε = 27 700 M-1 cm-1), oxidation of the cofacially constrained analogue 2 to [2˙˙]2+ results in a blue-shifted NIR band (E = 4830 cm-1, ε = 42 900 M-1 cm-1), while oxidation of 5 to [5˙˙]2+, with parallel arrangement of chromophores, results in a red-shifted NIR band (E = 4150 cm-1, ε = 46 600 M-1 cm-1); the NIR bands exhibit double the intensity in comparison to the monomer. Oxidation of the intermediate orientations results in band splitting for [3˙˙]2+ (E = 4890 and 4200 cm-1; ε = 26 500 and 21 100 M-1 cm-1), and a red-shift for [4˙˙]2+ using ortho- and meta-phenylene linkers, respectively. This study demonstrates for the first time, the applicability of exciton coupling to ligand radical systems absorbing in the NIR region and shows that by simple geometry changes, it is possible to tune the energy of intense low energy absorption by nearly 400 nm.
Figures


Similar articles
-
Class III delocalization and exciton coupling in a bimetallic bis-ligand radical complex.Chemistry. 2013 Jul 15;19(29):9606-18. doi: 10.1002/chem.201300798. Epub 2013 Jun 7. Chemistry. 2013. PMID: 23749684
-
Electronic Structure Description of a Doubly Oxidized Bimetallic Cobalt Complex with Proradical Ligands.Inorg Chem. 2016 Jan 19;55(2):762-74. doi: 10.1021/acs.inorgchem.5b02231. Epub 2015 Dec 31. Inorg Chem. 2016. PMID: 26719989
-
Radical localization in a series of symmetric Ni(II) complexes with oxidized salen ligands.Chemistry. 2012 Oct 29;18(44):14117-27. doi: 10.1002/chem.201201410. Epub 2012 Sep 20. Chemistry. 2012. PMID: 22997000
-
Non-innocent ligand behavior of a bimetallic Ni Schiff-base complex containing a bridging catecholate.Inorg Chem. 2011 Jul 18;50(14):6746-55. doi: 10.1021/ic200785g. Epub 2011 Jun 15. Inorg Chem. 2011. PMID: 21675708
-
Design and Synthesis of Cofacially-Arrayed Polyfluorene Wires for Electron and Energy Transfer Studies.Molecules. 2023 Apr 25;28(9):3717. doi: 10.3390/molecules28093717. Molecules. 2023. PMID: 37175127 Free PMC article. Review.
Cited by
-
Cooperative redox and spin activity from three redox congeners of sulfur-bridged iron nitrosyl and nickel dithiolene complexes.Proc Natl Acad Sci U S A. 2022 Jun 21;119(25):e2201240119. doi: 10.1073/pnas.2201240119. Epub 2022 Jun 13. Proc Natl Acad Sci U S A. 2022. PMID: 35696567 Free PMC article.
References
-
- Ostroverkhova O. Chem. Rev. 2016;116:13279–13412. - PubMed
- Reineke S., Thomschke M., Lüssem B., Leo K. Rev. Mod. Phys. 2013;85:1245–1293.
-
- Clarke T. M., Durrant J. R. Chem. Rev. 2010;110:6736–6767. - PubMed
-
- Lu X., Lee S., Hong Y., Phan H., Gopalakrishna T. Y., Herng T. S., Tanaka T., Sandoval-Salinas M. E., Zeng W., Ding J., Casanova D., Osuka A., Kim D., Wu J. J. Am. Chem. Soc. 2017;139:13173–13183. - PubMed
- Cai K., Xie J., Zhao D. J. Am. Chem. Soc. 2014;136:28–31. - PubMed
- Yong G.-P., Zhao Y.-M., Feng Y., Zhang X.-R. J. Mater. Chem. C. 2013;1:3395–3398.
-
- Dou L., Liu Y., Hong Z., Li G., Yang Y. Chem. Rev. 2015;115:12633–12665. - PubMed
LinkOut - more resources
Full Text Sources
Other Literature Sources
Miscellaneous