. 2018 Apr 17:3:9.
doi: 10.1038/s41536-018-0048-1. eCollection 2018.

Translation of remote control regenerative technologies for bone repair

Affiliations

Translation of remote control regenerative technologies for bone repair

Hareklea Markides et al. NPJ Regen Med. .

Abstract

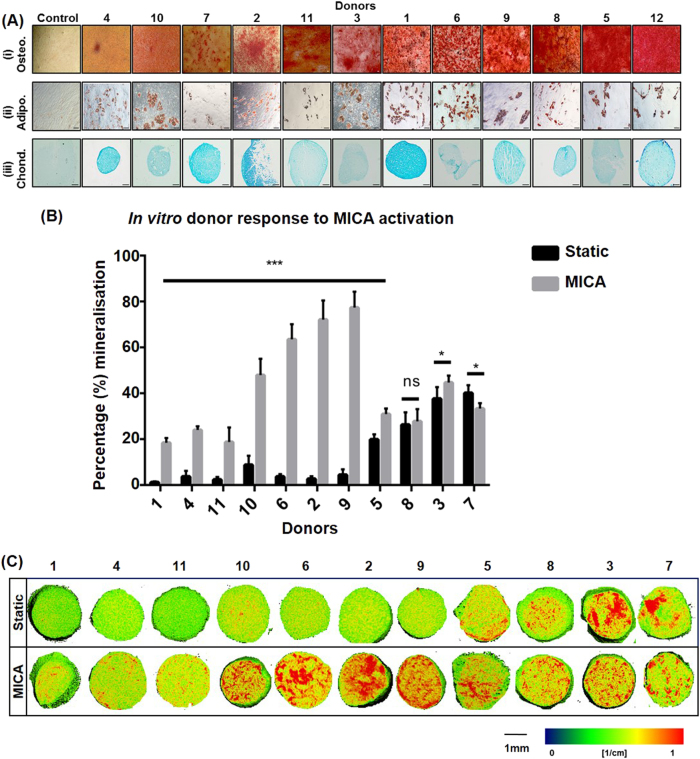
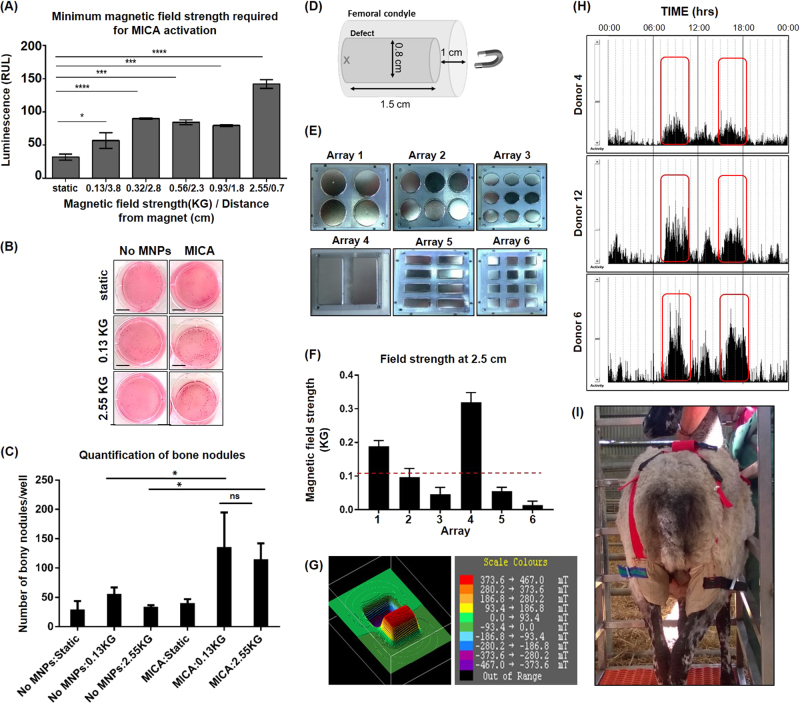
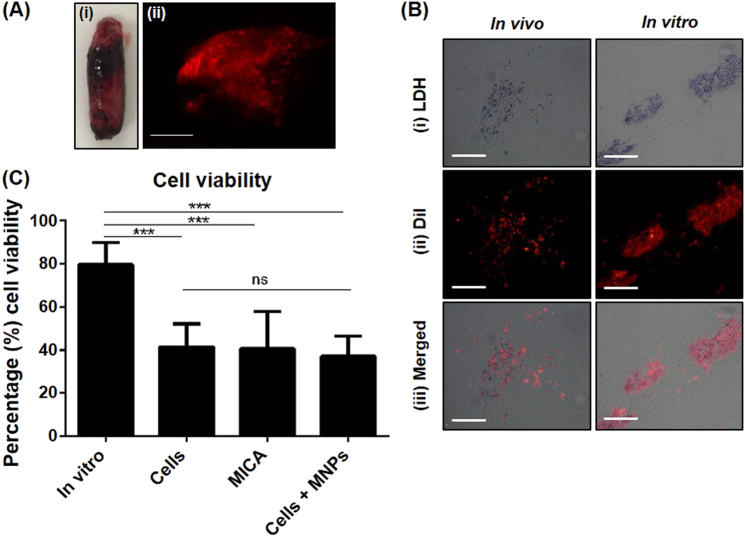
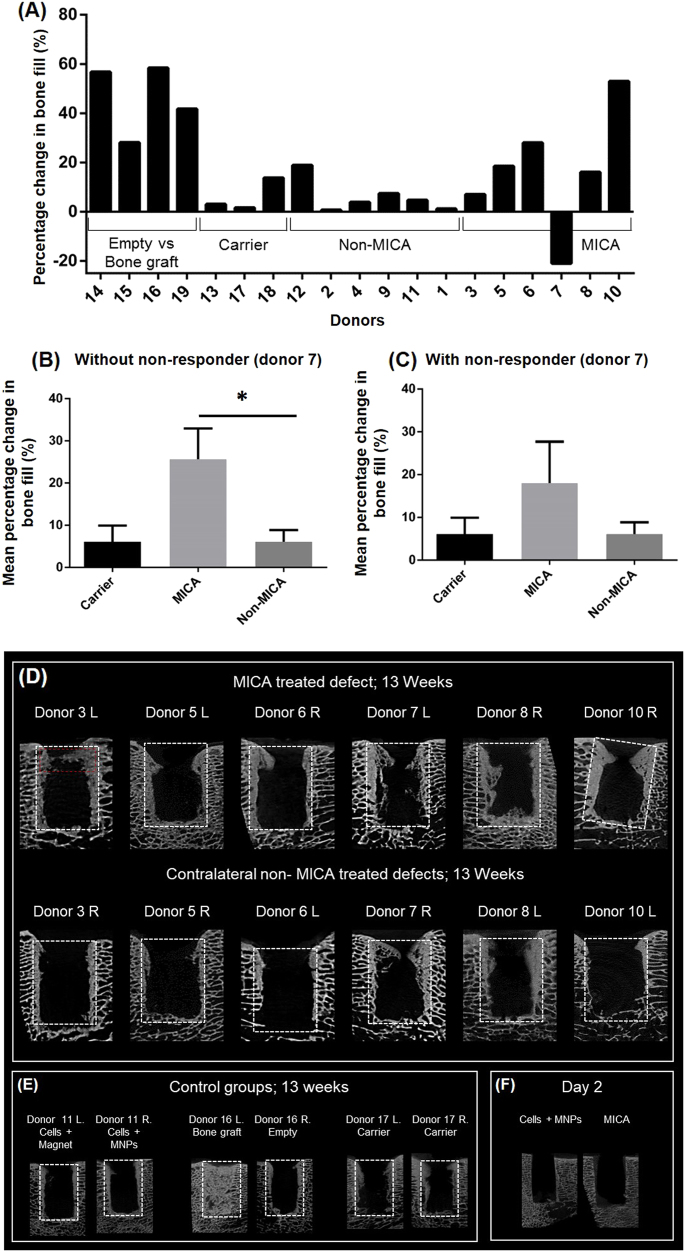
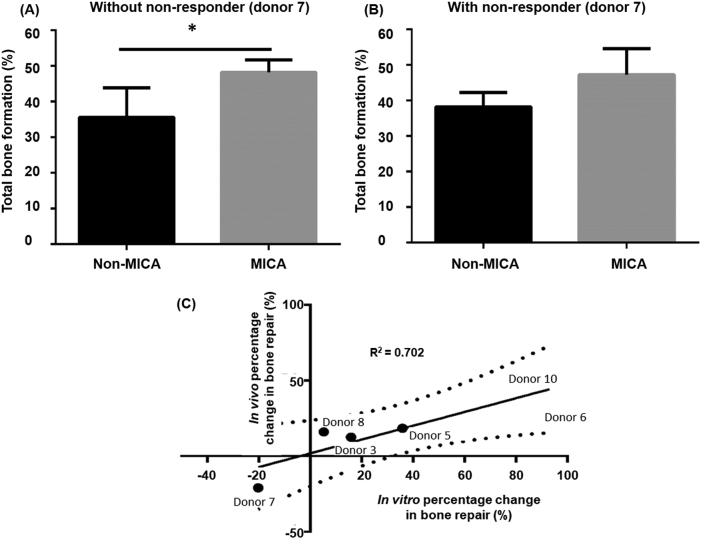
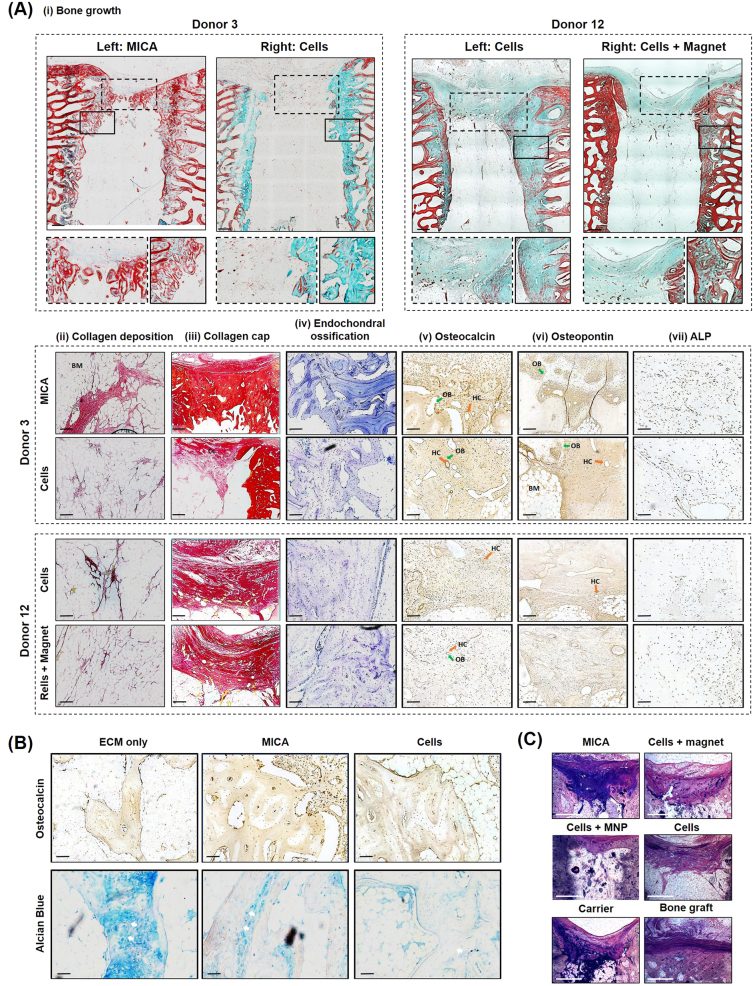
The role of biomechanical stimuli, or mechanotransduction, in normal bone homeostasis and repair is understood to facilitate effective osteogenesis of mesenchymal stem cells (MSCs) in vitro. Mechanotransduction has been integrated into a multitude of in vitro bone tissue engineering strategies and provides an effective means of controlling cell behaviour towards therapeutic outcomes. However, the delivery of mechanical stimuli to exogenous MSC populations, post implantation, poses a significant translational hurdle. Here, we describe an innovative bio-magnetic strategy, MICA, where magnetic nanoparticles (MNPs) are used to remotely deliver mechanical stimuli to the mechano-receptor, TREK-1, resulting in activation and downstream signalling via an external magnetic array. In these studies, we have translated MICA to a pre-clinical ovine model of bone injury to evaluate functional bone repair. We describe the development of a magnetic array capable of in vivo MNP manipulation and subsequent osteogenesis at equivalent field strengths in vitro. We further demonstrate that the viability of MICA-activated MSCs in vivo is unaffected 48 h post implantation. We present evidence to support early accelerated repair and preliminary enhanced bone growth in MICA-activated defects within individuals compared to internal controls. The variability in donor responses to MICA-activation was evaluated in vitro revealing that donors with poor osteogenic potential were most improved by MICA-activation. Our results demonstrate a clear relationship between responders to MICA in vitro and in vivo. These unique experiments offer exciting clinical applications for cell-based therapies as a practical in vivo source of dynamic loading, in real-time, in the absence of pharmacological agents.


Conflict of interest statement

A.J.E.H. is the co-founder of MICA BioSystems, and holds patent applications in this technology. Other authors declare no competing financial and non-financial interests.

Figures

Fig. 1
Fig. 1
In vitro assessment of donor cell differentiation potential. a Comparative tri-lineage differentiation of STRO-4 positive ovine mesenchymal stem cells (oMSCs) from 12 sheep donors. Images are presented in order of increasing differentiation potential for a, i Osteogenesis at day 28 (Alizarin Red staining) with corresponding a, ii Adipogenesis at day 14 (Oil Red O staining), a, iii Chondrogenesis at day 21 (Alcian Blue staining) and compared to a representative proliferation media control (n = 3), scale bars; 100 µm. b Quantification of in vitro donor response to MICA activation in 3D collagen hydrogel cultures assessed by Micro-CT at day 28 and compared to static controls. Data represents the average percentage mineralisation for donors 1–11 ± S.D. (n = 9). c Corresponding 2D slices showing mineralisation (red regions) representing the central slice of the 3D hydrogel. Scale bar; 1 mm. Statistical significance is represented by *P < 0.05, ***P < 0.001 and ns is no significance
Fig. 2
Fig. 2
Design and development of a magnetic array for in vivo MICA activation. a Determining the minimum magnetic field strength required for cell activation. MICA activation of MNP-labelled HEK-293 NFΚ-β reporter cells at increasing magnetic field strengths (corresponding to a decrease in distance between cells and the magnetic array). Data represents the mean luminescence (RLU) ± SEM (n = 3). b MICA activation of MNP-labelled and unlabelled STRO-4 positive ovine mesenchymal stem cells (oMSCs) towards osteogenesis (Alizarin red staining) in 6-well monolayer cell culture plates at a field strength of 0.13 and 2.55 KG and compared to static and unlabelled controls (n = 3), scale bar; 1 cm. c Quantification of bony nodules generated in monolayer as a result of MICA activation at either field strength (0.13 and 2.55 KG) and compared to static and unlabelled controls. Data represents the average number of visible bone nodules across 3 wells of a 6-well plate. d Schematic representing the size and location of the defect within the femoral condyle relative to the position of the magnetic array. “X” marks the location of MNP-labelled cells furthest away from the magnet i.e 2.5 cm in the ovine model. e Fabrication of six magnetic arrays containing neodymium iron boron magnets of varying dimensions. f Comparative magnetic field strength from arrays 1–6 at a distance of 2.5 cm. Data represents the average magnetic field strength at six random points on each magnet per array ± S.D. Red dashed line represents minimum magnetic field strength (0.13 KG) required to activate cells. g 3D Magnetic profile of array 4 at a distance of 0.5 cm demonstrating alternating poles. h Accelerometer data for sheep donors 4, 6 and 12 highlighting most active periods (red boxes) within a 24 h period. i Picture of a sheep fitted with the adapted truss housing magnetic array 4 within the pouch corresponding to the location of the defect. Statistical significance is represented by *P < 0.05, ***P < 0.001 and ns is no significance
Fig. 3
Fig. 3
Assessment of oMSC fate 48 h post implantation. a, i Implanted ECM-constructs remained intact with a, ii delivered oMSCs (CM-DiI-stained; red fluorescence) visibly distributed throughout the implanted construct; scale bar; 2 mm. b Representative cryo-sectioned samples of the extracted in vivo construct and time-point matched in vitro controls constructs. b, i Viable oMSCs were identified by a distinct blue stain attributed to the LDH reaction. b, ii Implanted oMSCs were identified by red fluorescent staining. b, iii Viability of delivered cells was therefore determined by the co-localisation of blue and red-fluorescent stains. c Quantification of cellular viability for all in vivo groups (cells only, MICA and cells + MNPs) and compared to time-point matched in vitro controls. Data is presented as the average viability (proportion of duel LDH:DiI labelled cells relative to total DiI labelled cells) for 5 random sections where 10 independent FOVs were analysed per section for each sample ± S.D (n = 6). Statistical significance is represented by * where, ***P < 0.001 and ns is no significance
Fig. 4
Fig. 4
Micro-CT evaluation of bone repair at 13 weeks. a Percentage change in bone growth between defects of the same animal (n = 1). b, c Corresponding averaged percentage change for the same sheep (n = 6) either excluding or including donor 7, the non-responder respectively. d Representative Micro-CT slices for all 6 MICA treated sheep (donors 3, 5, 6, 7, 8 and 10) comparing the left (L) and right (R) defects of each sheep (MICA vs non-MICA) at 13 weeks. e Representative control groups include a non-MICA treated sheep (donor 11L & R), a positive control (donor 16L; bone graft), the negative control (donor 16R; empty defect), a carrier control (donor 17L & R) and f micro-CT images of a defect at day 2 treated either with MICA or non-MICA (cells + MNPs). White dotted box represents the analysed region of interest. Red dotted box represents region corresponding to histological analysis. Statistical significance is represented by *P < 0.05
Fig. 5
Fig. 5
Continuation of Micro-CT analysis. a, b Averaged total bone formation comparing MICA treatment to the contralateral MICA control (non-MICA) for donors 3, 5, 6, 7, 8 and 10 either excluding or including donor 7 respectively. c Correlation of the in vitro and in vivo responses to MICA activation for donors 3, 5, 6, 7, 8 and 10 when comparing the percentage in change in mineralisation relative to donor matched static control and percentage change in bone fill relative to the non-MICA contralateral control leg of the same animal respectively. Dotted lines indicate the 95% confidence band. Line of best fit plotted with a R2 value of 0.7072
Fig. 6
Fig. 6
Histological evaluation of repair at 13 weeks. a Representative images from; Donor 3 (MICA animal) treated with MICA (left defect) and cells only (right defect) and Donor 12 (MICA-control animal) treated with cells only (left defect) and cells + magnet (right defect). Histological staining; a, i Masson-Goldner trichrome staining identifying new bone callus in green, osteoid steams in red and focused on bone outgrowth over the top of the defect and along the peripheral edges (inserts). a, ii and a, iii Picrosirius red staining of collagen rich structures in the central and proximal regions of each defect respectively. a, iv Toluidine blue staining identifying cartilage-like tissues rich in proteoglycans (indicative of bone growth via the endochondral ossification route) in purple. a, v Osteocalcin a, vi osteopontin and a, vii ALP (alkaline phosphatase) immuno-histochemical (IHC) staining at the proximal region of each defect. b Representative ECM-carrier, MICA and cell only sections stained for Alcian blue and Osteocalcin IHC demonstrating areas of cartilage like tissue (Alcian blue) and areas of mineralised tissue (osteocalcin). c Representative calcified sections from each group stained with paragon and toluidine blue staining; new bone growth is identified by light pink staining while fibrous tissue is stained deep purple. Scale bar represents 500 µm (a, i, a, iii),100 µm (a, ii, a, iv, a, v, a, vi, a, vii, b) or 1500 µm (c). Green arrow (OB); osteoblasts, orange arrow (HC); Haversian Canals, white arrows; hypertrophic chondrocytes, BM; Bone marrow. For further information on the anatomical location of each section, please refer to supplementary information, Fig. 3

References

    1. Stevens MM. Biomaterials for bone tissue engineering. Mater. Today. 2008;11:18–25. doi: 10.1016/S1369-7021(08)70086-5. - DOI
    1. Meng J, et al. Super-paramagnetic responsive nanofibrous scaffolds under static magnetic field enhance osteogenesis for bone repair in vivo. Sci. Rep. 2013;3:2655. doi: 10.1038/srep02655. - DOI - PMC - PubMed
    1. Cancedda R, et al. A tissue engineering approach to bone repair in large animal models and in clinical practice. Biomaterials. 2007;28:4240–4250. doi: 10.1016/j.biomaterials.2007.06.023. - DOI - PubMed
    1. Gaston M, et al. A. H. R. W. Inhibition of fracture healing. J. Bone Jt. Surg. Br. Vol. 2007;89-B:1553. doi: 10.1302/0301-620X.89B12.19671. - DOI - PubMed
    1. Gothard D, et al. Tissue engineered bone using select growth factors: a comprehensive review of animal studies and clinical translation studies in man. Eur. Cell. Mater. 2014;28:166–207. doi: 10.22203/eCM.v028a13. - DOI - PubMed

LinkOut - more resources