. 2018 Apr 18;4(4):eaap9467.
doi: 10.1126/sciadv.aap9467. eCollection 2018 Apr.

Freshening by glacial meltwater enhances melting of ice shelves and reduces formation of Antarctic Bottom Water

Affiliations

Freshening by glacial meltwater enhances melting of ice shelves and reduces formation of Antarctic Bottom Water

Alessandro Silvano et al. Sci Adv. .

Abstract

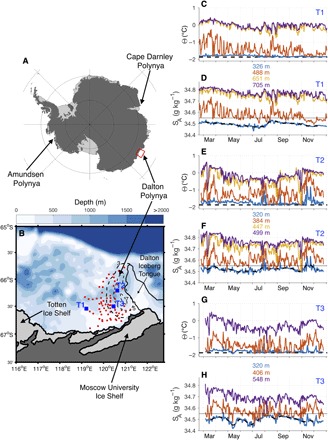
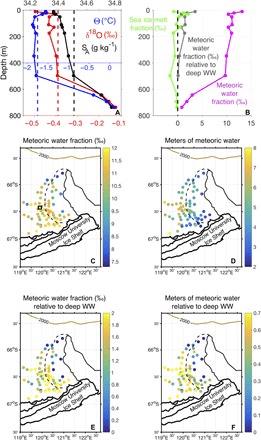
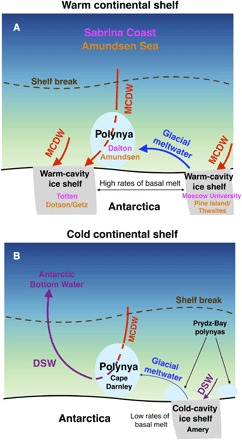
Strong heat loss and brine release during sea ice formation in coastal polynyas act to cool and salinify waters on the Antarctic continental shelf. Polynya activity thus both limits the ocean heat flux to the Antarctic Ice Sheet and promotes formation of Dense Shelf Water (DSW), the precursor to Antarctic Bottom Water. However, despite the presence of strong polynyas, DSW is not formed on the Sabrina Coast in East Antarctica and in the Amundsen Sea in West Antarctica. Using a simple ocean model driven by observed forcing, we show that freshwater input from basal melt of ice shelves partially offsets the salt flux by sea ice formation in polynyas found in both regions, preventing full-depth convection and formation of DSW. In the absence of deep convection, warm water that reaches the continental shelf in the bottom layer does not lose much heat to the atmosphere and is thus available to drive the rapid basal melt observed at the Totten Ice Shelf on the Sabrina Coast and at the Dotson and Getz ice shelves in the Amundsen Sea. Our results suggest that increased glacial meltwater input in a warming climate will both reduce Antarctic Bottom Water formation and trigger increased mass loss from the Antarctic Ice Sheet, with consequences for the global overturning circulation and sea level rise.


Figures

Fig. 1
Fig. 1. Water properties on the Sabrina Coast.
Map (B) of the Sabrina Coast [red rectangle in (A)] with bathymetry and coastline overlaid (81). Oceanographic stations where conductivity-temperature-depth (CTD) and oxygen isotope measurements have been collected are shown in red, whereas moorings T1, T2, and T3 are shown in blue. Black dashed lines are contours of the 2014 annual sea ice production (in meters) in the Dalton Polynya (24). Time series of conservative temperature Θ and absolute salinity SA, low-pass filtered using a fourth-order 40-hour Butterworth filter, are shown for T1 (C and D), T2 (E and F), and T3 (G and H) with indicated depths. A 30-day low-pass filter is shown in black dashed lines for salinity time series at the shallowest instrument of each mooring, whereas the thin black lines represent SA = 34.55 g kg−1 (that is, upper salinity limit for WW). The black dashed lines in (C), (E), and (G) are the surface freezing temperatures for a salinity of 34.4 g kg−1.
Fig. 2
Fig. 2. Freshwater input on the Sabrina Coast.
(A) Vertical profiles of conservative temperature Θ, oxygen isotope δ18O, and absolute salinity SA from station 21 [black square in (C)]. The vertical black (red) dashed line represents SA18O) used to estimate the meteoric water fraction relative to deep WW (see Materials and Methods). The dashed blue line is Θ = −1.75°C, the upper temperature limit for WW. (B) Vertical profiles at station 21 of the fractions of meteoric water (magenta), sea ice melt (green), and meteoric water relative to deep WW (gray) (see Material and Methods). (C) Vertically averaged meteoric water fraction above the MCDW layer. The black dashed line delimits the Dalton Polynya, defined as the area where the annual sea ice production is larger than 3 m. (D) Meters of meteoric water. (E) Same as (C) but relative to deep WW. (F) Meters of meteoric water accumulated above the MCDW layer since the commencement of mixed-layer retreat.
Fig. 3
Fig. 3. Mixed-layer evolution in Antarctic polynyas.
Modeled temporal evolution of mixed-layer depth (A) and absolute salinity SA (B) in the Dalton Polynya. In red, we show the case with no meteoric water included. In black, meteoric water is included by reducing the surface salt flux by 35%. Shaded areas represent uncertainty in the model output related to uncertainty in sea ice production [±25% (37)], whereas blue bars indicate the range of observed WW properties. (C and D) Same as (A) and (B) for the Amundsen Polynya. Surface salt flux is reduced by 75% in the black line case. Blue bars are based on WW variability in different years (6, 12, 25). (E and F) Same as (A) and (B) for the Cape Darnley Polynya but only showing the no–meteoric water case because it reproduces observations of DSW formation (20). Note that the y axis stops at the full depth of the ocean, different in (A), (C), and (E) (figs. S1 to S3).
Fig. 4
Fig. 4. Impact of glacial meltwater on dense water formation and shelf stratification.
On warm continental shelves, as those on the Sabrina Coast and in the Amundsen Sea (A), MCDW drives rapid ice shelf basal melt. The large volume of glacial meltwater prevents DSW formation in polynyas downstream of the meltwater outflow. MCDW remains in the bottom layer throughout the year in the polynya and further downstream, where it can access the ice shelf cavities. On cold continental shelves, the ice shelf cavities are filled by cold shelf waters, and basal melt rates are low. Glacial meltwater input is not sufficient to suppress winter convection in polynyas downstream of the meltwater outflow, as seen at Cape Darnley Polynya (B), allowing formation of DSW, the precursor to Antarctic Bottom Water.

Similar articles

Cited by

References

    1. Rignot E., Velicogna I., van den Broeke M. R., Monaghan A., Lenaerts J. T. M., Acceleration of the contribution of the Greenland and Antarctic ice sheets to sea level rise. Geophys. Res. Lett. 38, L05503 (2011).
    1. Velicogna I., Sutterley T. C., van den Broeke M. R., Regional acceleration in ice mass loss from Greenland and Antarctica using GRACE time-variable gravity data. Geophys. Res. Lett. 41, 8130–8137 (2014).
    1. Sutterley T. C., Velicogna I., Rignot E., Mouginot J., Flament T., van den Broeke M. R., van Wessem J. M., Reijmer C. H., Mass loss of the Amundsen Sea embayment of West Antarctica from four independent techniques. Geophys. Res. Lett. 41, 8421–8428 (2014).
    1. Li X., Rignot E., Mouginot J., Scheuchl B., Ice flow dynamics and mass loss of Totten Glacier, East Antarctica, from 1989 to 2015. Geophys. Res. Lett. 43, 6366–6373 (2016).
    1. Li X., Rignot E., Morlighem M., Mouginot J., Scheuchl B., Grounding line retreat of Totten Glacier, East Antarctica, 1996 to 2013. Geophys. Res. Lett. 42, 8049–8056 (2015).

Publication types