. 2018 Jun;12(7):1047-1060.
doi: 10.1002/1878-0261.12309. Epub 2018 May 21.

Specific breast cancer prognosis-subtype distinctions based on DNA methylation patterns

Affiliations

Specific breast cancer prognosis-subtype distinctions based on DNA methylation patterns

Shumei Zhang et al. Mol Oncol. 2018 Jun.

Abstract

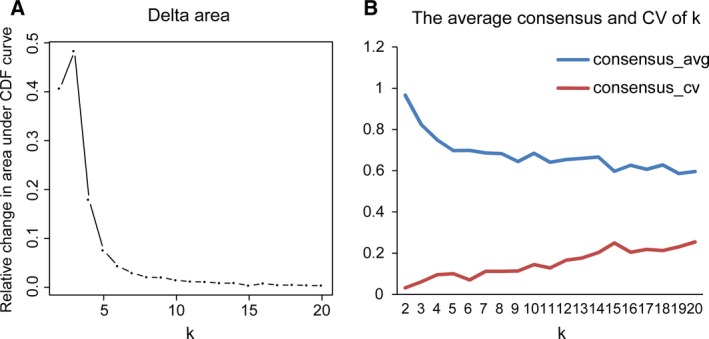
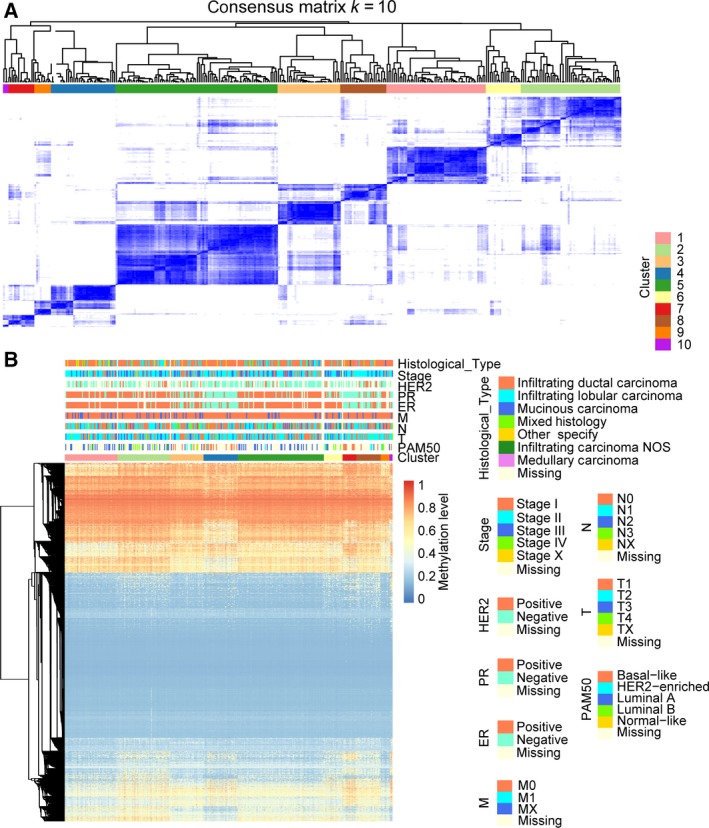
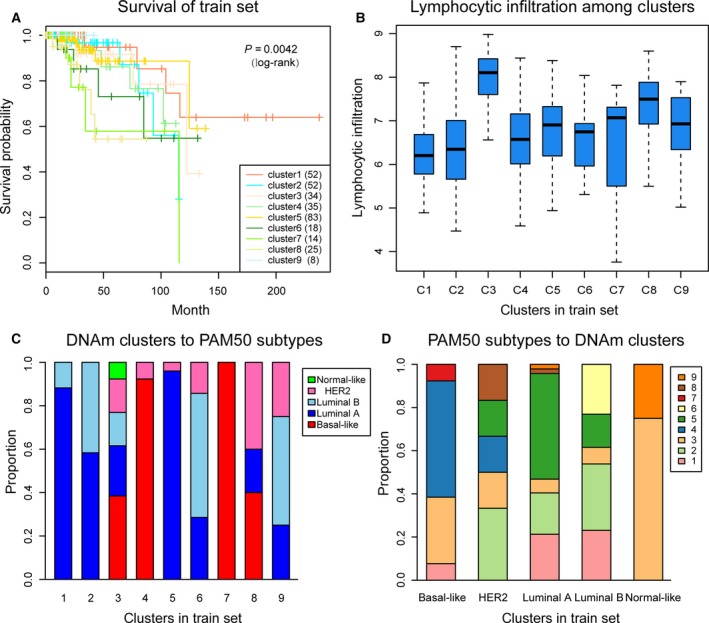
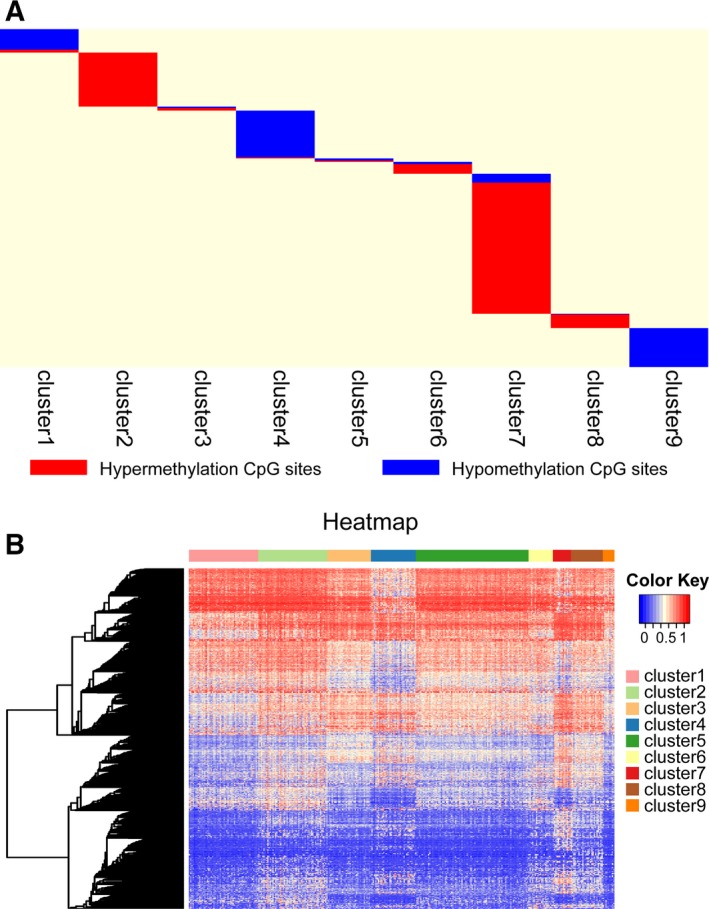
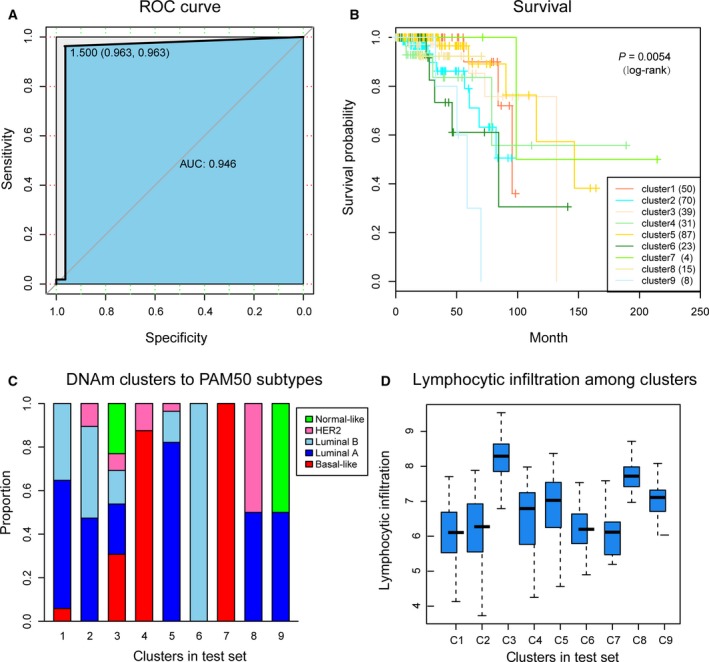
Tumour heterogeneity is an obstacle to effective breast cancer diagnosis and therapy. DNA methylation is an important regulator of gene expression, thus characterizing tumour heterogeneity by epigenetic features can be clinically informative. In this study, we explored specific prognosis-subtypes based on DNA methylation status using 669 breast cancers from the TCGA database. Nine subgroups were distinguished by consensus clustering using 3869 CpGs that significantly influenced survival. The specific DNA methylation patterns were reflected by different races, ages, tumour stages, receptor status, histological types, metastasis status and prognosis. Compared with the PAM50 subtypes, which use gene expression clustering, DNA methylation subtypes were more elaborate and classified the Basal-like subtype into two different prognosis-subgroups. Additionally, 1252 CpGs (corresponding to 888 genes) were identified as specific hyper/hypomethylation sites for each specific subgroup. Finally, a prognosis model based on Bayesian network classification was constructed and used to classify the test set into DNA methylation subgroups, which corresponded to the classification results of the train set. These specific classifications by DNA methylation can explain the heterogeneity of previous molecular subgroups in breast cancer and will help in the development of personalized treatments for the new specific subtypes.

Keywords: DNA methylation; breast cancer; consensus clustering; molecular subtypes.


Figures

Figure 1
Figure 1
Criteria for the selection of the number of categories. (A) Delta area curve of consensus clustering, indicating the relative change in area under the cumulative distribution function (CDF) curve for each category number k compared with k – 1. The horizontal axis represents the category number k and the vertical axis represents the relative change in area under CDF curve. (B) The average cluster consensus and coefficient of variation among clusters for each category number k. The blue line represents the average cluster consensus and the red line represents the coefficient of variation among clusters.
Figure 2
Figure 2
Consensus matrix for DNA methylation classification with the corresponding heat map. (A) The colour‐coded heatmap corresponding to the consensus matrix for k = 10 obtained by applying consensus clustering. The colour gradients were from 0 to 1, representing the degree of consensus, with white corresponding to 0 and dark blue to 1. (B) The heatmap corresponding to the dendrogram in (A) which was generated using the pheatmap function with DNA methylation classification, PAM50 classification, estrogen receptor, progesterone receptor, HER2 receptor status, TNM stage, clinicopathological stage and histological type as the annotations.
Figure 3
Figure 3
Survival curves of DNA methylation subtypes and the comparison of lymphocyte infiltration between DNA methylation clusters and their PAM50 classifications. (A) The survival curves of DNA methylation subtypes in train set. The horizontal axis represents the survival time (months), and the vertical axis the probability of survival. The numbers in parentheses in the legend represent the number of samples in each cluster . The log‐rank test was used to assess the statistical significance of the difference. (B) Lymphocyte infiltration score distributions of nine DNA methylation clusters in the train set. The horizontal axis represents the DNA methylation clustering. (C) PAM50 subtypes with enrichment in each DNA methylation cluster. (D) The reverse orientation of (C).
Figure 4
Figure 4
Specific hyper/hypomethylation CpG sites for each DNA methylation cluster. (A) Display of specific CpG sites for each DNA methylation prognosis subtype. The red bars and blue bars represent hypermethylation CpG sites and hypomethylation CpG sites, respectively. (B) The heat map for the specific sites in nine DNA methylation clusters.
Figure 5
Figure 5
The prognosis model and prediction results. (A) The ROC curve displayed the sensitivity and specificity of the prognosis model. The area under the curve (AUC) reached 0.946. (B) Survival curves of nine clusters predicted from the test set using the prognosis model. The numbers in parentheses in the legend represent the number of samples in each cluster. The log‐rank test was used to assess the statistical significance of the difference. (C) PAM50 subtypes with enrichment in each DNA methylation cluster. (D) Lymphocyte infiltration score distributions of DNA methylation clusters in the test set.

References

    1. Antequera F and Bird A (1993) Number of CpG islands and genes in human and mouse. Proc Natl Acad Sci USA 90, 11995–11999. - PMC - PubMed
    1. Arnedos M, Vicier C, Loi S, Lefebvre C, Michiels S, Bonnefoi H and Andre F (2015) Precision medicine for metastatic breast cancer – limitations and solutions. Nat Rev Clin Oncol 12, 693–704. - PubMed
    1. Ateeq B, Tomlins SA and Chinnaiyan AM (2009) AGTR1 as a therapeutic target in ER‐positive and ERBB2‐negative breast cancer cases. Cell Cycle 8, 3794–3795. - PMC - PubMed
    1. Bu LL, Yang K, Xiong WX, Liu FT, Anderson B, Wang Y and Wang J (2016) Toward precision medicine in Parkinson's disease. Ann Transl Med 4, 26. - PMC - PubMed
    1. Cancer Genome Atlas Network (2012) Comprehensive molecular portraits of human breast tumours. Nature 490, 61–70. - PMC - PubMed

Publication types