. 2018 Jul;28(4):380-388.
doi: 10.1111/jon.12511. Epub 2018 Apr 19.

Selective Inversion Recovery Quantitative Magnetization Transfer Brain MRI at 7T: Clinical and Postmortem Validation in Multiple Sclerosis

Affiliations

Selective Inversion Recovery Quantitative Magnetization Transfer Brain MRI at 7T: Clinical and Postmortem Validation in Multiple Sclerosis

Francesca Bagnato et al. J Neuroimaging. 2018 Jul.

Abstract

Background and purpose: An imaging biomarker of myelin integrity is an unmet need in multiple sclerosis (MS). Selective inversion recovery (SIR) quantitative magnetization transfer imaging (qMT) provides assays of myelin content in the human brain. We previously translated the SIR method to 7T and incorporated a rapid turbo field echo (TFE) readout for whole-brain imaging within clinically acceptable scan times. We herein provide histological validation and test in vivo feasibility and applicability of the SIR-TFE protocol in MS.

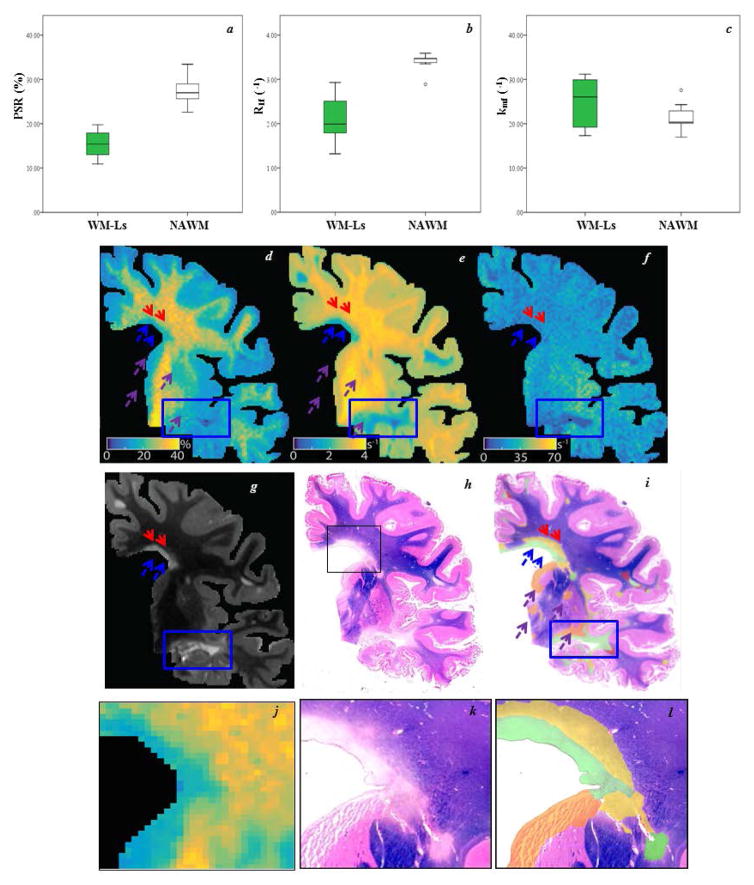
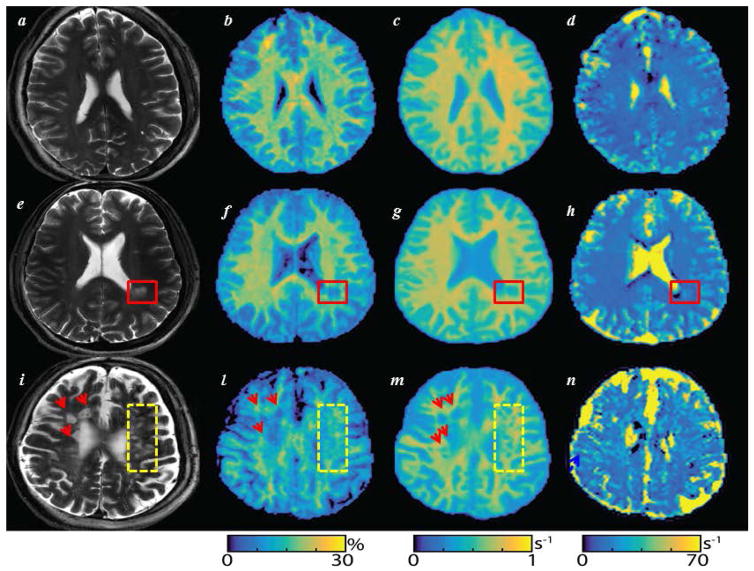
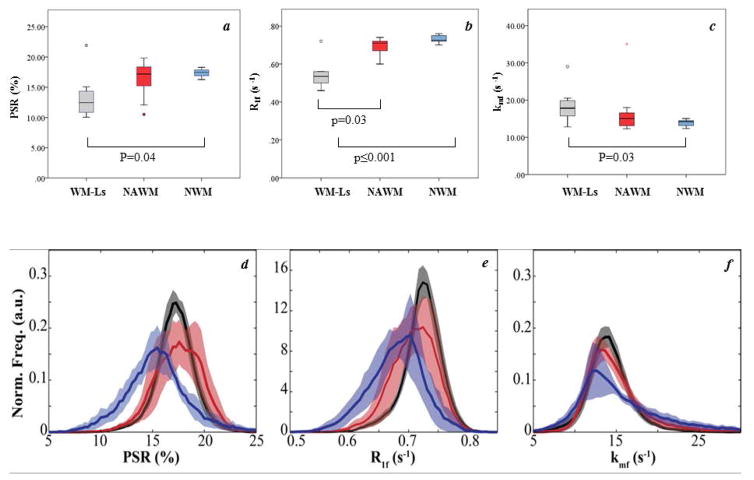
Methods: Clinical (T1 - and T2 -weighted) and SIR-TFE MRI scans were performed at 7T in a postmortem MS brain and MRI data were acquired in 10 MS patients and 14 heathy volunteers in vivo. The following parameters were estimated from SIR data: the macromolecular-to-free water pool-size-ratio (PSR), the spin-lattice relaxation rate of water (R1f ), and the MT exchange rate (kmf ). Differences in SIR parameters across tissue types, eg, white matter lesions (WM-Ls) and normal appearing WM (NAWM) in patients, and normal white matter (NWM) in heathy volunteers were evaluated. Associations between SIR parameters and disability scores were assessed.

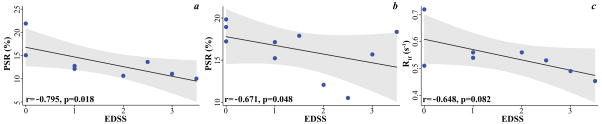
Results: For postmortem scans, correspondence was observed between WM-Ls and NAWM from histology and PSR/R1f values. In vivo differences were detected for PSR, R1f , and kmf between WM-Ls and NWM (P ≤ .041). Associations were seen between WM-Ls/ NAWM PSR and disability scores (r ≤ -.671, P ≤ .048).

Conclusions: SIR-qMT at 7T provides sensitive, quantitative measures of myelin integrity for clinical and research applications.

Keywords: Myelin; magnetic resonance imaging; multiple sclerosis; quantitative magnetization transfer imaging.


Figures

Figure 1
Figure 1. Differences in free water pool-size-ratio (PSR), spin-lattice relaxation rate of water (R1f), and the MT exchange rate (kmf) between white matter lesions (WM-Ls) and normal appearing white matter (NAWM), post mortem
Boxplots for each quantitative magnetization transfer imaging parameter (a=PSR in %, b=R1f and c=kmf in seconds−1 [s−1]), where green and white represent WM-Ls and NAWM regions of interest, respectively. Each box represents the 25th–75th percentile and the black line inside the boxes represents the median value. The vertical lines outside the box delineate the minimum and maximum values. Outliers (small circles, 10th – 90th percentile) are also represented. Side-by-side qMT parameter maps (d=PSR, e=R1f, and f=kmf), T2-weighted gradient echo spin echo (g), luxol fast blue-stained section (h) and proteolipid protein (PLP)-color-coded myelination maps (i). Corresponding zoomed insets (black box) are shown in the bottom row (j= PSR, k=LFP, and l=PLP). In the quantitative magnetization transfer imaging (qMT) maps, the blue/red arrows and rectangles indicate WM-Ls that have a demyelinated/remyelinated component, while the purple arrows indicate gray matter (GM) demyelination. In the PLP maps, green/yellow indicate demyelinated/remyelinated WM-Ls, orange areas indicate GM demyelination, and dark pink areas indicate Wallerian degeneration with secondary demyelination.
Figure 2
Figure 2. Pool-size-ratio (PSR), spin-lattice relaxation rate of water (R1f), and the MT exchange rate (kmf) maps, in vivo
Side-by-side T2-weighted gradient echo spine echo (T2-w GRASE), (a–e–i), PSR (in %, b–f–l), R1f (in second−1 [s−1], c–g–m), kmf (in s−1, d–h–n) maps. The first row displays a T2-w GRASE and selective inversion recovery quantitative magnetization transfer imaging derived PSR (b), R1f (c), and kmf (d) maps of a healthy volunteer. Data are derived from a 31year-old healthy gentleman. One can see the net distinction between white matter/grey matter signal on the PSR (b) and R1f (c) maps, but not on the kmf (d). Rows 2 and 3 show the same maps in multiple sclerosis (MS) patient #1 (e–h) and #8 (i–n) in Table 1. A clearly demarcated white matter lesion (WM-L) is seen on T2-w GRASE image of MS patient #1 (red rectangle in figures e–h). Patient #8 instead shows several diffuse WM-Ls on T2-w GRASE image (i) indicated by red arrows and yellow rectangles. These WM-Ls displayed several degrees of intensity on T2-w GRASE images which were reflected by differences in visibility on PSR (l) and kmf (m) maps. The elevated kmf near tissue boundaries (e.g., near the ventricles or large lesions) is related to partial volume averaging as previously described and contributed to the large observed variability for this index.
Figure 3
Figure 3. Differences in free water pool-size-ratio (PSR), spin-lattice relaxation rate of water (R1f), and the MT exchange rate (kmf) between white matter lesions (WM-Ls), normal appearing white matter (NAWM) and normal white matter (NWM), in vivo
Boxplots for each quantitative magnetization transfer imaging (qMT) parameter (a=PSR in %, b=R1f and c=kmf in seconds−1 [s−1]), where gray, red, and blue represent WM-Ls, NAWM, and NWM, respectively. Significant differences are detailed in figures. Each box represents the 25th– 75th percentile and the black line inside the boxes represents the median value. The vertical lines outside the box delineate the minimum and maximum values. Outliers (small circles, 10th – 90th percentile) and extreme outliers (stars, 5th – 95th percentile) are also represented. NAWM histograms for each qMT parameter (d=PSR, e=R1f and f=kmf). All masks were generated automatically via FSL’s FAST algorithm after subtracting manually defined WM-L regions. The dark line represents the mean values and the shaded region the mean ± standard error. Note the overlap between PSR for healthy controls (black line) and patients with negligible disability (red line, patients with expanded disability status scale [EDSS] score ≤ 1), and the trend of decreasing PSR in NAWM with increasing disability (blue line, patients with EDSS >1). For R1f, a similar trend of decreasing values with increasing disability was observed, while kmf values were similar across all cohorts.
Figure 4
Figure 4. Associations between clinical and imaging metrics, in vivo
Individual points plots showing the significant associations between white matter lesions pool-size-ratio (PSR, in %) (a) and spin-lattice relaxation rate of water (in seconds−1 [s−1]b) as well as normal appearing white matter PSR (c) and expanded disability status scale (EDSS) scores in patients. The gray shadows represent the 95% confidence interval of the regression.

References

    1. Fox RJ, Thompson A, Baker D, et al. Setting a research agenda for progressive multiple sclerosis: the International Collaborative on Progressive MS. Mult Scler. 2012;18:1534–40. - PMC - PubMed
    1. Catalaa I, Grossman RI, Kolson DL, et al. Multiple sclerosis: magnetization transfer histogram analysis of segmented normal-appearing white matter. Radiology. 2000;216:351–5. - PubMed
    1. Filippi M, Rocca MA. Magnetization transfer magnetic resonance imaging in the assessment of neurological diseases. J Neuroimaging. 2004;14:303–13. - PubMed
    1. Gass A, Barker GJ, Kidd D, et al. Correlation of magnetization transfer ratio with clinical disability in multiple sclerosis. Ann Neurol. 1994;36:62–7. - PubMed
    1. Kalkers NF, Hintzen RQ, van Waesberghe JH, et al. Magnetization transfer histogram parameters reflect all dimensions of MS pathology, including atrophy. J Neurol Sci. 2001;184:155–62. - PubMed

Publication types

LinkOut - more resources