Review
. 2018 Apr;42(2):101-116.
doi: 10.4093/dmj.2018.42.2.101.

Effects of Omega-3 Supplementation on Adipocytokines in Prediabetes and Type 2 Diabetes Mellitus: Systematic Review and Meta-Analysis of Randomized Controlled Trials

Affiliations
Review

Effects of Omega-3 Supplementation on Adipocytokines in Prediabetes and Type 2 Diabetes Mellitus: Systematic Review and Meta-Analysis of Randomized Controlled Trials

Tarik Becic et al. Diabetes Metab J. 2018 Apr.

Erratum in

Abstract

Background: The objective of this systematic review and meta-analysis was to determine the effects of omega-3 supplementation on adipocytokine levels in adult prediabetic and diabetic individuals.

Methods: We searched PubMed, Medline, EMBASE, Scopus, Web of Science, Google Scholar, Cochrane Trial Register, World Health Organization Clinical Trial Registry Platform, and Clinicaltrial.gov Registry from inception to August 1, 2017 for randomized controlled trials. Pooled effects of interventions were assessed as mean difference using random effects model. We conducted a sensitivity, publication bias and subgroup analysis.

Results: Fourteen studies individuals (n=685) were included in the meta-analysis. Omega-3 supplementation increased levels of adiponectin (0.48 μg/mL; 95% confidence interval [CI], 0.27 to 0.68; P<0.00001, n=10 trials), but effects disappeared after sensitivity analysis. Tumor necrosis factor α (TNF-α) levels were reduced (-1.71; 95% CI, -3.38 to -0.14; P=0.03, n=8 trials). Treatment duration shorter than 12 weeks was associated with greater reduction than longer treatment duration. Levels of other adipocytokines were not significantly affected. Publication bias could generally not be excluded.

Conclusion: Eicosapentaenoic acid and docosahexaenoic acid supplementation may increase adiponectin and reduce TNF-α levels in this population group. However, due to overall study heterogeneity and potential publication bias, a cautious interpretation is needed.

Keywords: Adipokines; Diabetes mellitus; Fatty acids, omega-3.


Conflict of interest statement

No potential conflict of interest relevant to this article was reported.

Figures
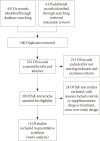
Fig. 1
Fig. 1. Flow diagram.
Fig. 2
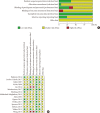
Fig. 2. Risk of bias assessment tool. (A) Summary of risk of bias of across the trials included in the systematic review. Information for every study characteristic was pooled from every trial (green: low risk of bias; yellow: unclear risk of bias; red: high risk of bias), combined and overall results expressed in percentages. (B) Overview of risk of bias across individual trials according to study characteristics. Each bias domain was evaluated carefully from every trial and decided whether the information provided reflected a low risk of bias (green), high risk of bias (red), or if insufficient information was provided and the risk of bias was therefore unclear (yellow).
Fig. 3
Fig. 3. Influence of omega-3 fatty acids supplementation on plasminogen-activator inhibitor 1 levels (ng/mL). Forest plot shows pooled mean differences with 95% confidence intervals (CIs) for two randomized controlled trials. The green colored square represents the point estimate of the effect of the intervention for each trial. The horizontal line joins the upper and lower limits of the 95% CI of the effects. The square area represents the relative weight of the trial in the meta-analysis. The black colored diamond at the bottom represents the pooled mean difference with 95% CI for all study groups. SD, standard deviation; IV, interval variable.
Fig. 4
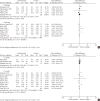
Fig. 4. Influence of omega-3 fatty acids supplementation on adiponectin levels (µg/mL). (A) Forest plot shows pooled mean differences with 95% confidence intervals (CIs) for 10 randomized controlled trials. The green colored square represents the point estimate of the effect of the intervention for each trial. The horizontal line joins the upper and lower limits of the 95% CI of the effects. The square area represents the relative weight of the trial in the meta-analysis. The black colored diamond at the bottom represents the pooled mean difference with 95% CI for all study groups. As opposed to graphs for all other outcome parameters, the labels of the X-axis are different, because an increase in adiponectin levels is seen as favorable. (B) Meta-analysis after eliminating Veleba et al. [43] as part of the leave-one-out sensitivity analysis (the trial was given a relative weight of 0.0%). SD, standard deviation; IV, interval variable.
Fig. 5
Fig. 5. Influence of omega-3 fatty acids supplementation on resisting levels (ng/mL). Forest plot shows pooled mean differences with 95% confidence intervals (CIs) for two randomized controlled trials. The green colored square represents the point estimate of the effect of the intervention for each trial. The horizontal line joins the upper and lower limits of the 95% CI of the effects. The square area represents the relative weight of the trial in the meta-analysis. The black colored diamond at the bottom represents the pooled mean difference with 95% CI for all study groups. SD, standard deviation; IV, interval variable.
Fig. 6
Fig. 6. Influence of omega-3 fatty acids supplementation on leptin levels (ng/mL). (A) Forest plot shows pooled mean differences with 95% confidence intervals (CIs) for seven randomized controlled trials. The green colored square represents the point estimate of the effect of the intervention for each trial. The horizontal line joins the upper and lower limits of the 95% CI of the effects. The square area represents the relative weight of the trial in the meta-analysis. Notice the absence of the black colored diamond at the bottom as in other graphs because of the magnitude of the pooled mean difference with 95% CI for all study groups. (B) Meta-analysis after eliminating Spencer et al. [41] as part of the leave-one-out sensitivity analysis (the trial was given a relative weight of 0.0%). SD, standard deviation; IV, interval variable.
Fig. 7
Fig. 7. Influence of omega-3 fatty acids supplementation on interleukin 6 levels (pg/mL). Forest plot shows pooled mean differences with 95% confidence intervals (CIs) for eight intervention effects pooled from seven randomized controlled trials (two separate effects were pooled for docosahexaenoic acid [DHA] and eicosapentaenoic acid [EPA] treatment arms from Mori et al. [38]). The green colored square represents the point estimate of the effect of the intervention for each intervention. The horizontal line joins the upper and lower limits of the 95% CI of the effects. The square area represents the relative weight of the interventions in the meta-analysis. SD, standard deviation; IV, interval variable.
Fig. 8
Fig. 8. Influence of omega-3 fatty acids supplementation on tumor necrosis factor α levels (pg/mL). (A) Forest plot shows pooled mean differences with 95% confidence intervals (CIs) for nine intervention effects pooled from eight randomized controlled trials (two separate effects were pooled for docosahexaenoic acid [DHA] and eicosapentaenoic acid [EPA] treatment arms from Mori et al. [38]). The green colored square represents the point estimate of the effect of the intervention for each intervention. The horizontal line joins the upper and lower limits of the 95% CI of the effects. The square area represents the relative weight of the interventions in the meta-analysis. (B) Meta-analysis after eliminating Spencer et al. [41] as part of the leave-one-out sensitivity analysis (the trial was given a relative weight of 0.0%). SD, standard deviation; IV, interval variable.
Fig. 9
Fig. 9. Subgroup analysis on the influence of omega-3 fatty acids supplementation according to (A) omega-3 dose and (B) treatment duration for adiponectin (µg/mL). Forest plot shows pooled mean differences with 95% confidence intervals (CIs). The green colored square represents the point estimate of the effect of the intervention for each trial. The horizontal line joins the upper and lower limits of the 95% CI of the effects. The square area represents the relative weight of the trial in the meta-analysis. The black colored diamond at the bottom represents the pooled mean difference with 95% CI for all study groups. SD, standard deviation; IV, interval variable.
Fig. 10
Fig. 10. Subgroup analysis on the influence of omega-3 fatty acids supplementation according to (A) omega-3 dose and (B) treatment duration for tumor necrosis factor α (pg/mL). Forest plot shows pooled mean differences with 95% confidence intervals (CIs). The green colored square represents the point estimate of the effect of the intervention for each trial. The horizontal line joins the upper and lower limits of the 95% CI of the effects. The square area represents the relative weight of the trial in the meta-analysis. The black colored diamond at the bottom represents the pooled mean difference with 95% CI for all study groups. SD, standard deviation; IV, interval variable; DHA, docosahexaenoic acid; EPA, eicosapentaenoic acid.
Fig. 11
Fig. 11. Funnel plot displaying study precision against the mean difference (MD) effect estimate with 95% confidence interval for (A) adiponectin, (B) leptin, (C) interleukin 6, and (D) tumor necrosis factor α. SE, standard error.

Similar articles

Cited by

References

    1. World Health Organization. Diabetes fact sheet. [cited 2018 Apr 9]. Available from: http://www.who.int/mediacentre/factsheets/fs312/en.
    1. American Diabetes Association. Economic costs of diabetes in the U.S. in 2012. Diabetes Care. 2013;36:1033–1046. - PMC - PubMed
    1. Eckel RH, Kahn SE, Ferrannini E, Goldfine AB, Nathan DM, Schwartz MW, Smith RJ, Smith SR Endocrine Society; American Diabetes Association; European Association for the Study of Diabetes. Obesity and type 2 diabetes: what can be unified and what needs to be individualized? Diabetes Care. 2011;34:1424–1430. - PMC - PubMed
    1. World Health Organization (WHO) Obesity and overweight fact sheet. [cited 2018 Apr 9]. Available from: http://www.who.int/mediacentre/factsheets/fs311/en.
    1. Bertoni AG, Krop JS, Anderson GF, Brancati FL. Diabetes-related morbidity and mortality in a national sample of U.S. elders. Diabetes Care. 2002;25:471–475. - PubMed

LinkOut - more resources