. 2018 Apr 16;10(4):592-605.
doi: 10.18632/aging.101415.

Mining TCGA database for genes of prognostic value in glioblastoma microenvironment

Affiliations

Mining TCGA database for genes of prognostic value in glioblastoma microenvironment

Di Jia et al. Aging (Albany NY). .

Abstract

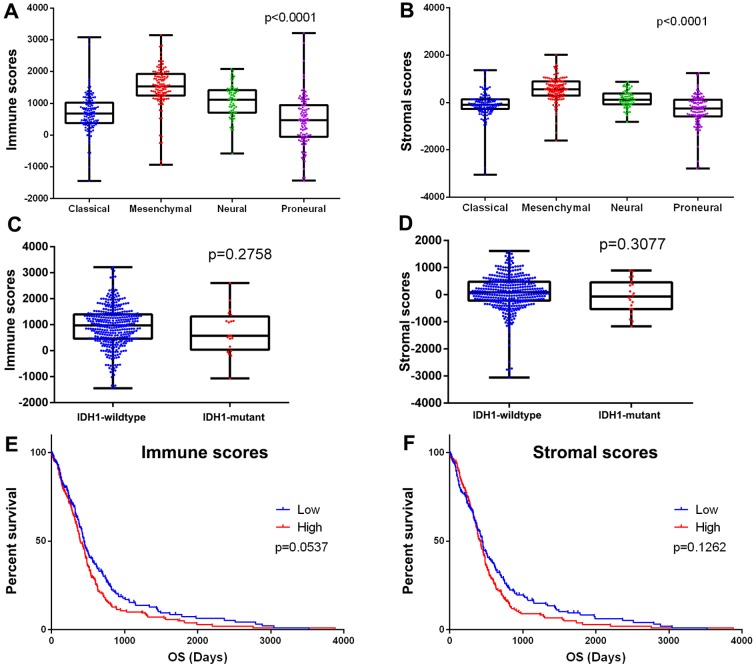
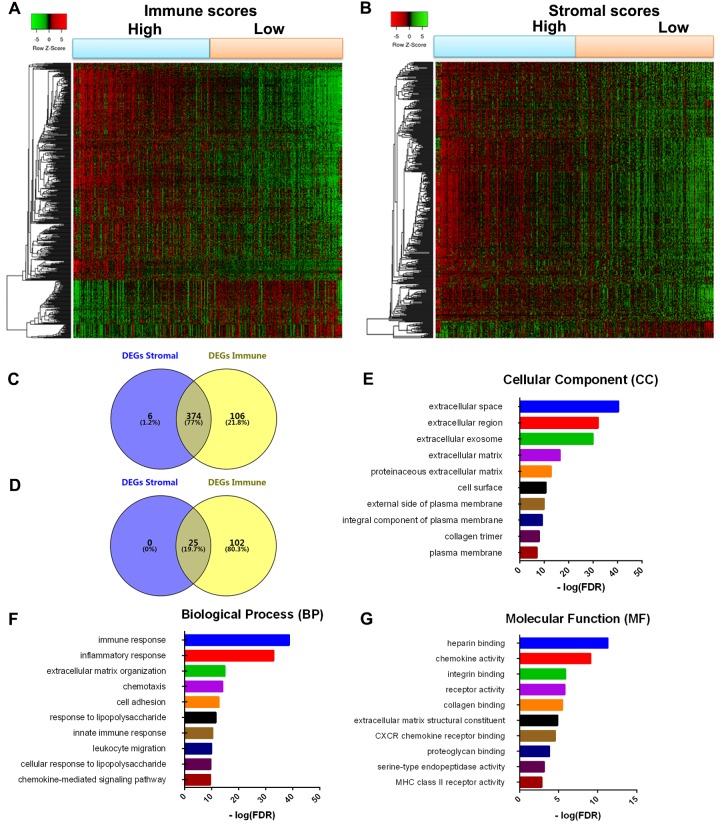
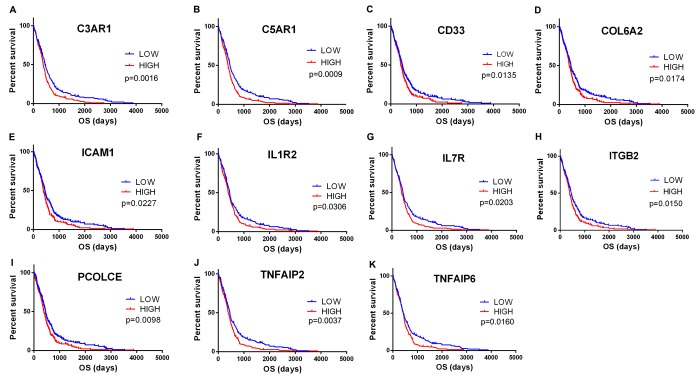
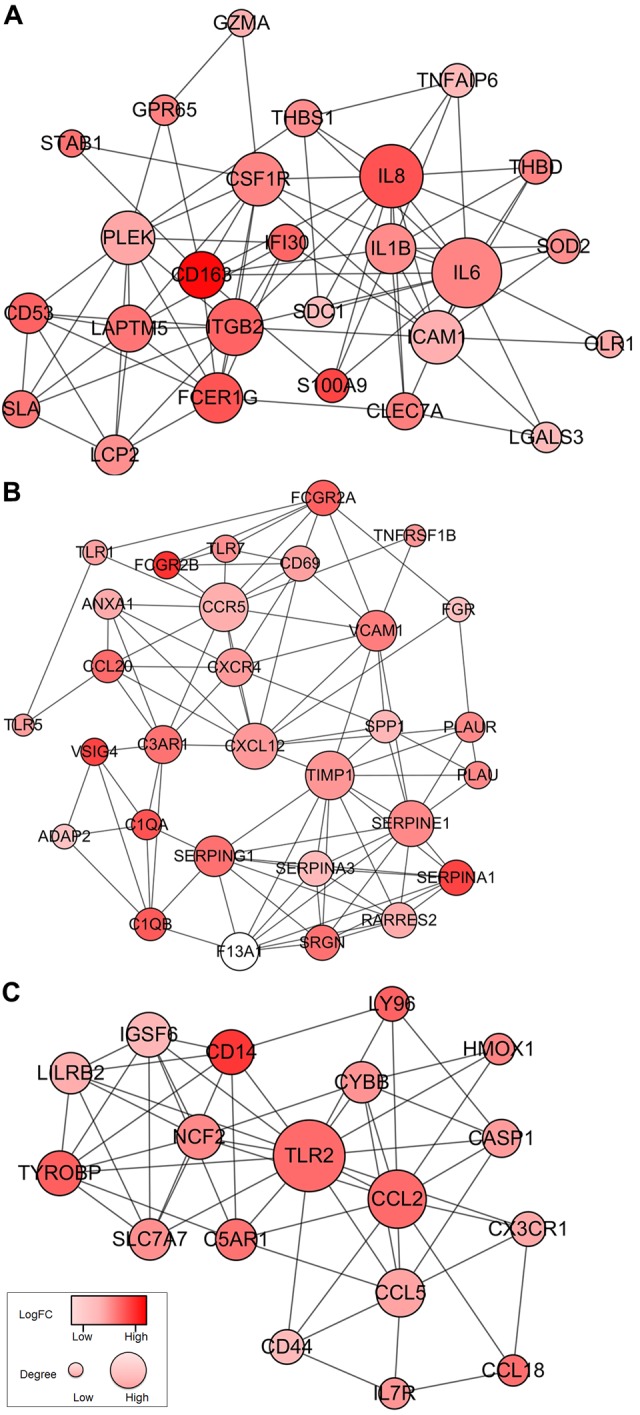
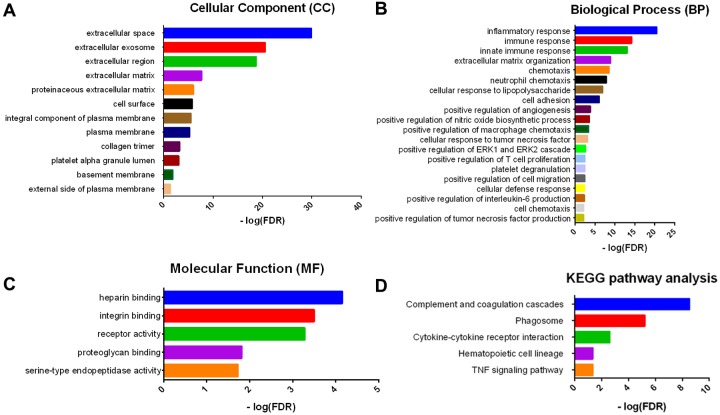
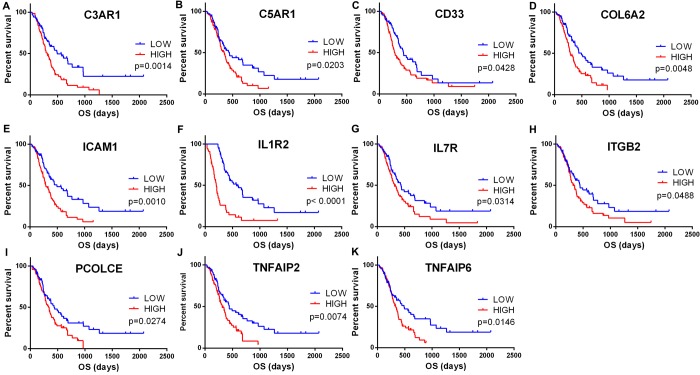
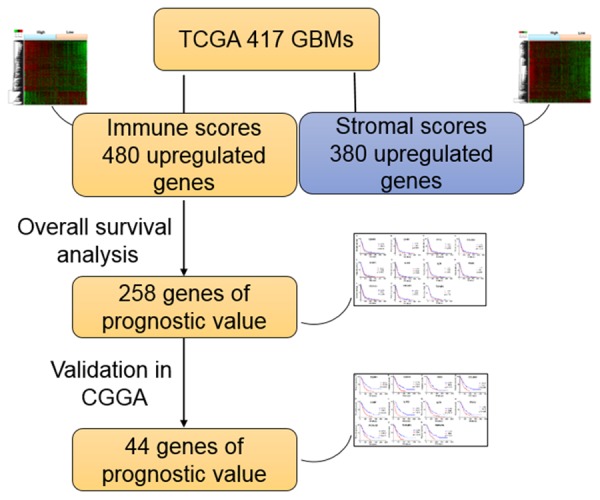
Glioblastoma (GBM) is one of the most deadly brain tumors. The convenient access to The Cancer Genome Atlas (TCGA) database allows for large-scale global gene expression profiling and database mining for potential correlation between genes and overall survival of a variety of malignancies including GBM. Previous reports have shown that tumor microenvironment cells and the extent of infiltrating immune and stromal cells in tumors contribute significantly to prognosis. Immune scores and stromal scores calculated based on the ESTIMATE algorithm could facilitate the quantification of the immune and stromal components in a tumor. To better understand the effects of genes involved in immune and stromal cells on prognosis, we categorized GBM cases in the TCGA database according to their immune/stromal scores into high and low score groups, and identified differentially expressed genes whose expression was significantly associated with prognosis in GBM patients. Functional enrichment analysis and protein-protein interaction networks further showed that these genes mainly participated in immune response, extracellular matrix, and cell adhesion. Finally, we validated these genes in an independent GBM cohort from the Chinese Glioma Genome Atlas (CGGA). Thus, we obtained a list of tumor microenvironment-related genes that predict poor outcomes in GBM patients.

Keywords: CGGA; TCGA; immune scores; overall survival; tumor microenvironment.


Conflict of interest statement

CONFLICTS OF INTEREST: The authors declare that they have no competing interests.

Figures

Figure 1
Figure 1
Immune scores and stromal scores are associated with GBM subtypes and their overall survival. (A) Distribution of immune scores of GBM subtypes. Box-plot shows that there is significant association between GBM subtypes and the level of immune scores (n=417, p<0.001). (B) Distribution of stromal scores of GBM subtypes. Box-plot shows that there is significant association between GBM subtypes and the level of stromal scores (n=417, p<0.001). (C) Distribution of immune scores for IDH1 mutant and IDH1 wildtype GBM cases. Box-plot shows that there is no significant association between IDH1 mutation status and immune scores (n=417, p=0.2758). (D) Distribution of stromal scores for IDH1 mutant and IDH1 wildtype GBM cases. Box-plot shows that there is no significant association between GBM subtypes and the level of stromal scores (n=417, p=0.3077). (E) GBM cases were divided into two groups based on their immune scores: the top half of 209 cases with higher immune scores and the bottom half of 208 cases with lower immune scores. As shown in the Kaplan-Meier survival curve, median survival of the low score group is longer than high score group (442 days vs. 394 days), as indicated by the log-rank test, p value is 0.0537. (F) Similarly, GBM cases were divided into two groups based on their stromal scores: the top half of 209 cases and the bottom half of 208 cases. The median survival of the low score group is longer than the high score group (442 days vs. 422 days), however, it is not statistically different as indicated by the log-rank test p= 0.1262.
Figure 2
Figure 2
Comparison of gene expression profile with immune scores and stromal scores in GBM. Heatmaps were drawn based on the average linkage method and Pearson distance measurement method. Genes with higher expression are shown in red, lower expression are shown in green, genes with same expression level are in black. (A) Heatmap of the DEGs of immune scores of top half (high score) vs. bottom half (low score). p<0.05, fold change >1.5). (B) Heatmap of the DEGs of stromal scores of top half (high score) vs. bottom half (low score). p<0.05, fold change >1.5). (C, D) Venn diagrams showing the number of commonly upregulated (C) or downregulated (D) DEGs in stromal and immune score groups. (E, F, G) Top 10 GO terms. False discovery rate (FDR) of GO analysis was acquired from DAVID functional annotation tool. p <0.05.
Figure 3
Figure 3
Correlation of expression of individual DEGs in overall survival in TCGA. Kaplan-Meier survival curves were generated for selected DEGs extracted from the comparison of groups of high (red line) and low (blue line) gene expression. p<0.05 in Log-rank test. OS, overall survival in days.
Figure 4
Figure 4
Top 3 PPI networks of IL6, TIMP1, and TLR2 modules. The color of a node in the PPI network reflects the log (FC) value of the Z score of gene expression, and the size of node indicates the number of interacting proteins with the designated protein.
Figure 5
Figure 5
GO term and KEGG pathway analysis for DEGs significantly associated with overall survival. Top pathways with FDR < 0.05, -log FDR >1.301 are shown: (A) biological process, (B) cellular component, (C) molecular function, and (D) KEGG pathway.
Figure 6
Figure 6
Validation of correlation of DEGs extracted from TCGA database with overall survival in CGGA cohort. Kaplan-Meier survival curves were generated for selected DEGs extracted from the comparison of groups of high (red line) and low (blue line) gene expression. p<0.05 in Log-rank test. OS, overall survival in days.
Figure 7
Figure 7
Work flow of the current work.

Similar articles

Cited by

References

    1. Stupp R, Mason WP, van den Bent MJ, Weller M, Fisher B, Taphoorn MJ, Belanger K, Brandes AA, Marosi C, Bogdahn U, Curschmann J, Janzer RC, Ludwin SK, et al., and European Organisation for Research and Treatment of Cancer Brain Tumor and Radiotherapy Groups, and National Cancer Institute of Canada Clinical Trials Group. Radiotherapy plus concomitant and adjuvant temozolomide for glioblastoma. N Engl J Med. 2005; 352:987–96. 10.1056/NEJMoa043330 - DOI - PubMed
    1. Perry JR, Laperriere N, O’Callaghan CJ, Brandes AA, Menten J, Phillips C, Fay M, Nishikawa R, Cairncross JG, Roa W, Osoba D, Rossiter JP, Sahgal A, et al., and Trial Investigators. Short-Course Radiation plus Temozolomide in Elderly Patients with Glioblastoma. N Engl J Med. 2017; 376:1027–37. 10.1056/NEJMoa1611977 - DOI - PubMed
    1. Aldape K, Zadeh G, Mansouri S, Reifenberger G, von Deimling A. Glioblastoma: pathology, molecular mechanisms and markers. Acta Neuropathol. 2015; 129:829–48. 10.1007/s00401-015-1432-1 - DOI - PubMed
    1. Cancer Genome Atlas Research Network. Comprehensive genomic characterization defines human glioblastoma genes and core pathways. Nature. 2008; 455:1061–68. 10.1038/nature07385 - DOI - PMC - PubMed
    1. Verhaak RG, Hoadley KA, Purdom E, Wang V, Qi Y, Wilkerson MD, Miller CR, Ding L, Golub T, Mesirov JP, Alexe G, Lawrence M, O’Kelly M, et al., and Cancer Genome Atlas Research Network. Integrated genomic analysis identifies clinically relevant subtypes of glioblastoma characterized by abnormalities in PDGFRA, IDH1, EGFR, and NF1. Cancer Cell. 2010; 17:98–110. 10.1016/j.ccr.2009.12.020 - DOI - PMC - PubMed

Publication types