

An epigenetic biomarker of aging for lifespan and healthspan
- PMID: 29676998
- PMCID: PMC5940111
- DOI: 10.18632/aging.101414
An epigenetic biomarker of aging for lifespan and healthspan
Abstract
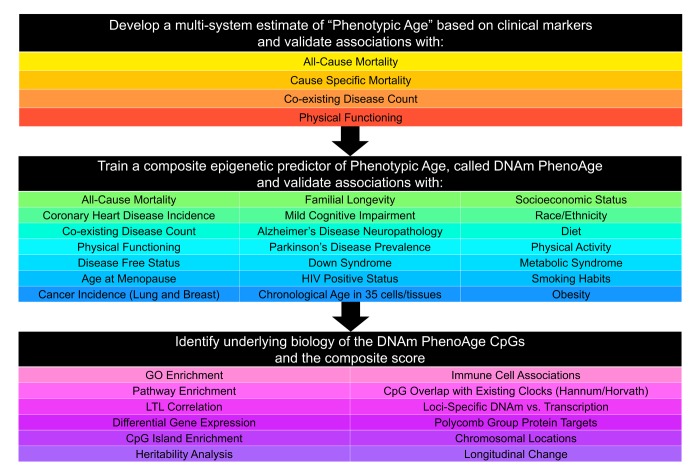
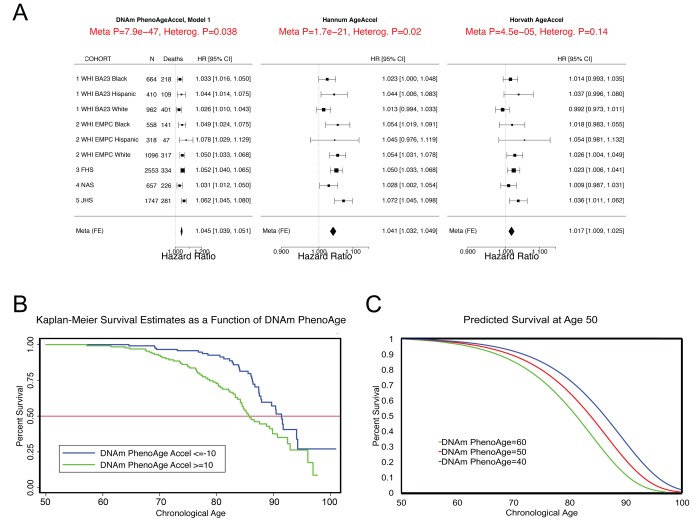
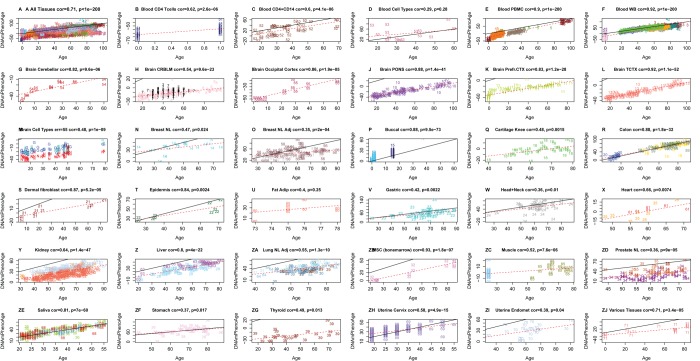
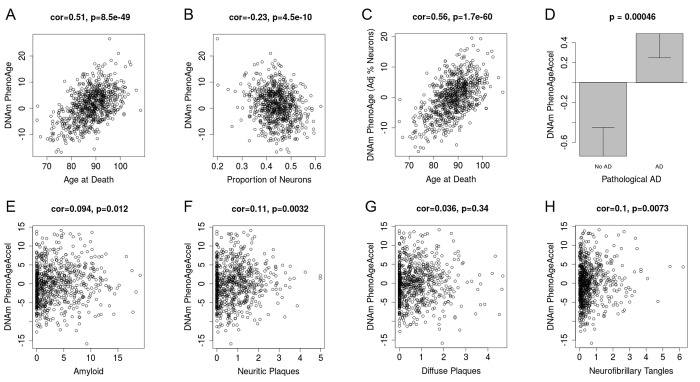
Identifying reliable biomarkers of aging is a major goal in geroscience. While the first generation of epigenetic biomarkers of aging were developed using chronological age as a surrogate for biological age, we hypothesized that incorporation of composite clinical measures of phenotypic age that capture differences in lifespan and healthspan may identify novel CpGs and facilitate the development of a more powerful epigenetic biomarker of aging. Using an innovative two-step process, we develop a new epigenetic biomarker of aging, DNAm PhenoAge, that strongly outperforms previous measures in regards to predictions for a variety of aging outcomes, including all-cause mortality, cancers, healthspan, physical functioning, and Alzheimer's disease. While this biomarker was developed using data from whole blood, it correlates strongly with age in every tissue and cell tested. Based on an in-depth transcriptional analysis in sorted cells, we find that increased epigenetic, relative to chronological age, is associated with increased activation of pro-inflammatory and interferon pathways, and decreased activation of transcriptional/translational machinery, DNA damage response, and mitochondrial signatures. Overall, this single epigenetic biomarker of aging is able to capture risks for an array of diverse outcomes across multiple tissues and cells, and provide insight into important pathways in aging.
Keywords: epigenetic clock; DNA methylation; biomarker; healthspan.
Conflict of interest statement
Figures
References
-
- Burch JB, Augustine AD, Frieden LA, Hadley E, Howcroft TK, Johnson R, Khalsa PS, Kohanski RA, Li XL, Macchiarini F, Niederehe G, Oh YS, Pawlyk AC, et al.. Advances in geroscience: impact on healthspan and chronic disease. J Gerontol A Biol Sci Med Sci. 2014. (Suppl 1); 69:S1–3. 10.1093/gerona/glu041 - DOI - PMC - PubMed
-
- Rakyan VK, Down TA, Maslau S, Andrew T, Yang TP, Beyan H, Whittaker P, McCann OT, Finer S, Valdes AM, Leslie RD, Deloukas P, Spector TD. Human aging-associated DNA hypermethylation occurs preferentially at bivalent chromatin domains. Genome Res. 2010; 20:434–39. 10.1101/gr.103101.109 - DOI - PMC - PubMed
-
- Teschendorff AE, Menon U, Gentry-Maharaj A, Ramus SJ, Weisenberger DJ, Shen H, Campan M, Noushmehr H, Bell CG, Maxwell AP, Savage DA, Mueller-Holzner E, Marth C, et al.. Age-dependent DNA methylation of genes that are suppressed in stem cells is a hallmark of cancer. Genome Res. 2010; 20:440–46. 10.1101/gr.103606.109 - DOI - PMC - PubMed
Publication types
MeSH terms
Substances
Grants and funding
- R01 MD009164/MD/NIMHD NIH HHS/United States
- HHSN268201100046C/HL/NHLBI NIH HHS/United States
- HHSN268201300049C/HL/NHLBI NIH HHS/United States
- HHSN271201100004C/AG/NIA NIH HHS/United States
- HHSN268201500001I/HL/NHLBI NIH HHS/United States
- RF1 AG054474/AG/NIA NIH HHS/United States
- HHSN268201300046C/HL/NHLBI NIH HHS/United States
- HHSN268201100002I/HL/NHLBI NIH HHS/United States
- U34 AG051425/AG/NIA NIH HHS/United States
- R01 DK103531/DK/NIDDK NIH HHS/United States
- HHSN268201100001I/HL/NHLBI NIH HHS/United States
- RF1 AG036042/AG/NIA NIH HHS/United States
- K99 AG052604/AG/NIA NIH HHS/United States
- R01 HL135009/HL/NHLBI NIH HHS/United States
- R01 HL116446/HL/NHLBI NIH HHS/United States
- R01 ES020836/ES/NIEHS NIH HHS/United States
- HHSN268201500001C/HL/NHLBI NIH HHS/United States
- HHSN268201100004I/HL/NHLBI NIH HHS/United States
- HHSN268201300048C/HL/NHLBI NIH HHS/United States
- HHSN268201100003C/WH/WHI NIH HHS/United States
- R01 HL101250/HL/NHLBI NIH HHS/United States
- P30 AG010161/AG/NIA NIH HHS/United States
- N01 HC025195/HL/NHLBI NIH HHS/United States
- HHSN268201300050C/HL/NHLBI NIH HHS/United States
- HHSN268201100002C/WH/WHI NIH HHS/United States
- HHSN268201300047C/HL/NHLBI NIH HHS/United States
- U54 GM115428/GM/NIGMS NIH HHS/United States
- HHSN268201100001C/WH/WHI NIH HHS/United States
- HHSN268201100004C/WH/WHI NIH HHS/United States
- R01 AG015819/AG/NIA NIH HHS/United States
LinkOut - more resources
Full Text Sources
Other Literature Sources
Medical
