Review
. 2018 Apr 20;18(4):1271.
doi: 10.3390/s18041271.

dPCR: A Technology Review

Affiliations
Review

dPCR: A Technology Review

Phenix-Lan Quan et al. Sensors (Basel). .

Abstract

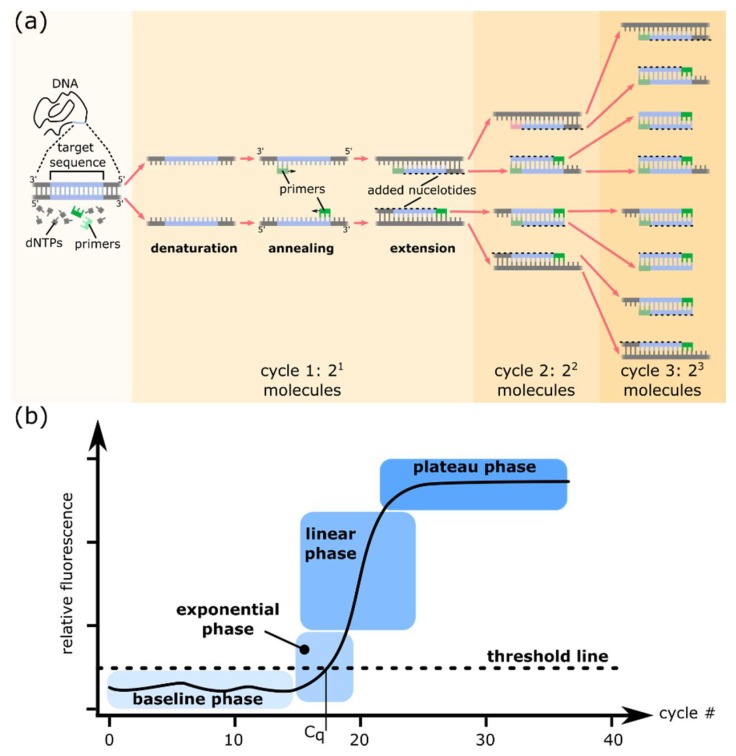
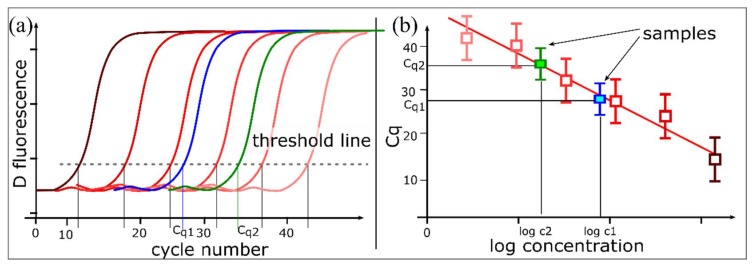
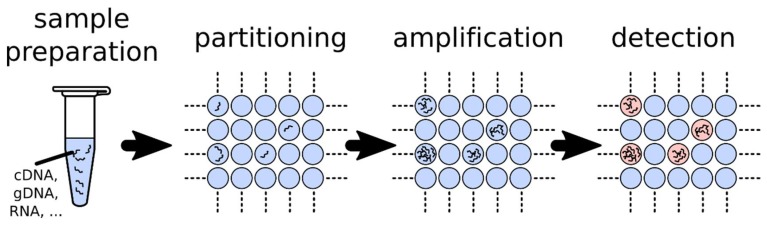
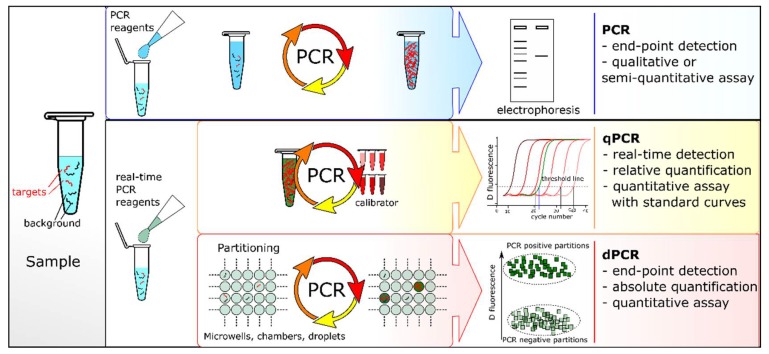
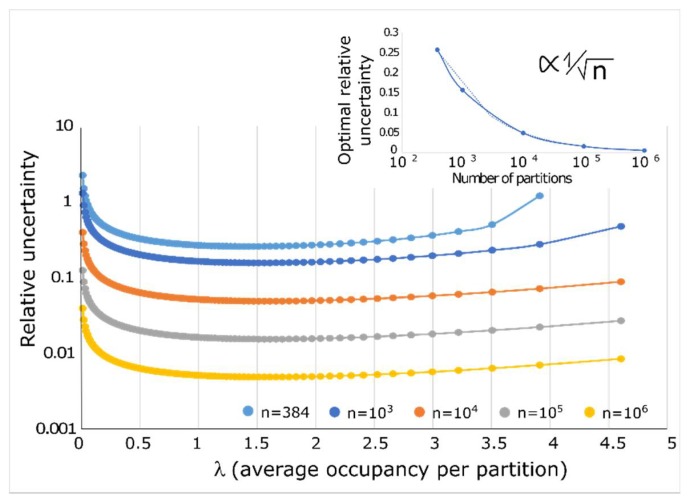
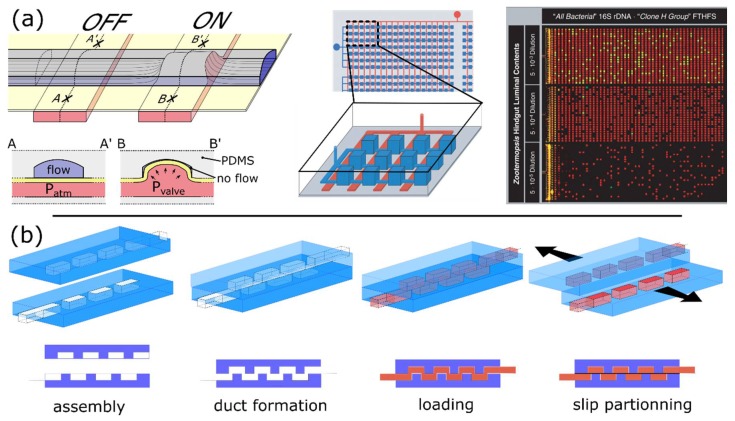
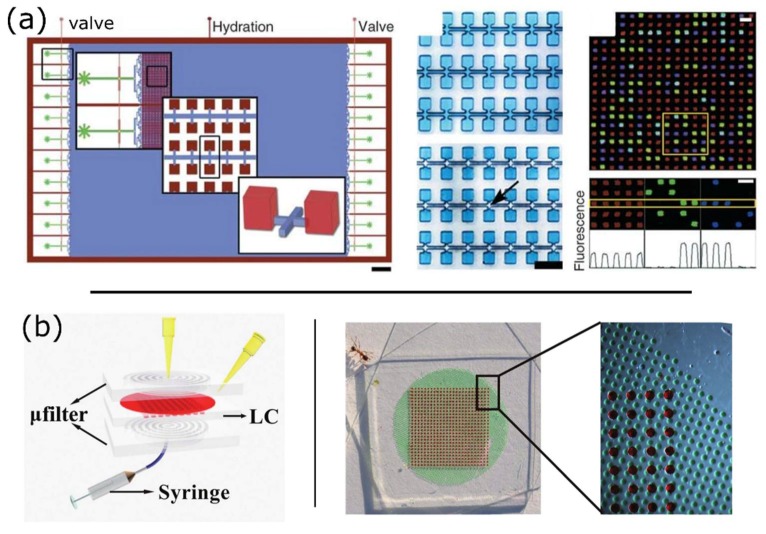
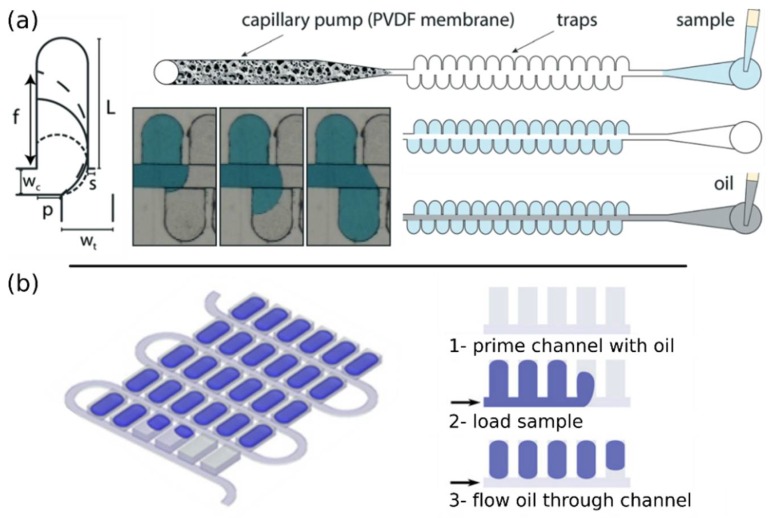
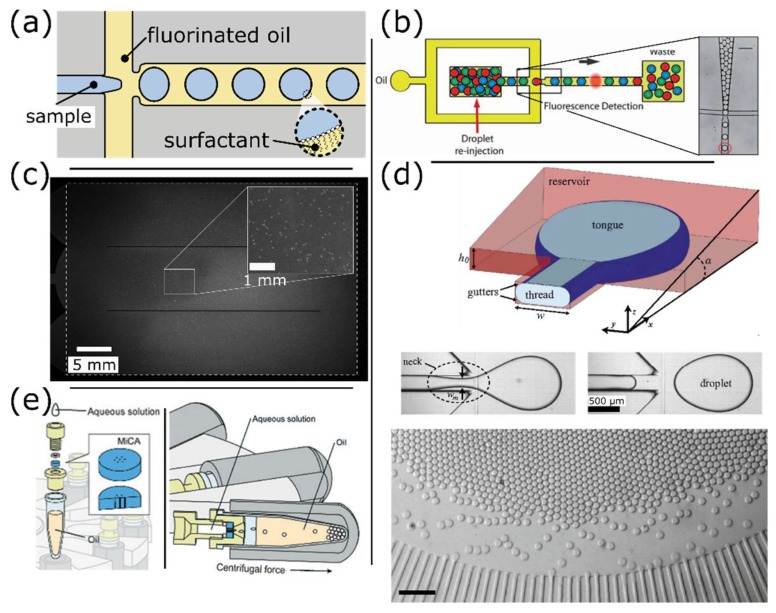
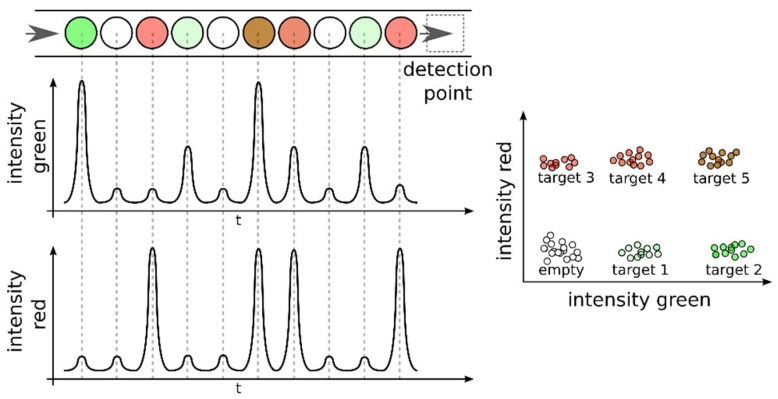
Digital Polymerase Chain Reaction (dPCR) is a novel method for the absolute quantification of target nucleic acids. Quantification by dPCR hinges on the fact that the random distribution of molecules in many partitions follows a Poisson distribution. Each partition acts as an individual PCR microreactor and partitions containing amplified target sequences are detected by fluorescence. The proportion of PCR-positive partitions suffices to determine the concentration of the target sequence without a need for calibration. Advances in microfluidics enabled the current revolution of digital quantification by providing efficient partitioning methods. In this review, we compare the fundamental concepts behind the quantification of nucleic acids by dPCR and quantitative real-time PCR (qPCR). We detail the underlying statistics of dPCR and explain how it defines its precision and performance metrics. We review the different microfluidic digital PCR formats, present their underlying physical principles, and analyze the technological evolution of dPCR platforms. We present the novel multiplexing strategies enabled by dPCR and examine how isothermal amplification could be an alternative to PCR in digital assays. Finally, we determine whether the theoretical advantages of dPCR over qPCR hold true by perusing studies that directly compare assays implemented with both methods.

Keywords: absolute quantification; arrays of microwells; dPCR; digital PCR; droplet microfluidics; microfluidic chambers; microfluidic technologies; microfluidics; on-chip valves; partitioning; qPCR; quantitative real-time PCR; real-time PCR.


Conflict of interest statement

The authors declare no conflict of interest.

Figures

Figure 1
Figure 1
(a) Principles of the polymerase chain reaction (PCR). Each PCR cycle includes three steps: (1) Denaturation of double-stranded DNA by heat; (2) Annealing of primers to their complementary target DNA sequences; (3) Extension of primers by a thermostable DNA polymerase. A typical PCR reaction is cycled 20–40 times. Each cycle can theoretically result in a doubling of the number of molecules of the target sequence; (b) Different phases of a real-time PCR amplification plot on a linear scale. A typical PCR amplification plot displays a sigmoidal-shape curve with 4 distinct phases. (1) In early PCR cycles, the fluorescence signal due to amplification product remains at background level. The baseline is set to eliminate the background fluorescent signal. (2) During the exponential phase, the amount of PCR product doubles with each cycle in perfect reaction conditions, i.e., if amplification efficiency is 100%. The threshold (dotted lines) is set above the background within the exponential phase. The cycle of quantification (Cq) is the cycle number at which the amplification plot intersects the threshold line that is set significantly above the baseline. (3) The linear phase indicates that reagents are becoming limited, which results in a reduction of the amplification efficiency. The amplification signal is no longer exponential. (4) The plateau phase indicates a saturation of the signal. Reagents are depleted and no additional PCR product is generated or detected.
Figure 2
Figure 2
Real-time qPCR assay using a standard curve. (a) Amplification curves for a 6-point 10-fold dilution series of a template with known concentrations (standard) over five orders of magnitude (e.g., genomic DNA, PCR amplicon, linearized plasmid). The Cq value of each serially diluted standard is determined; (b) A standard curve is generated by plotting the Cq values derived from the amplification curves of the dilution series against the logarithm of the standard quantity. The standard curve is used to interpolate the quantity of the target. The slope of the standard curve measures the amplification efficiency of the qPCR assay. A slope of –3.32 (for a standard curve generated from a serial 10-fold dilution series) indicates 100% amplification efficiency, i.e., the amount of PCR product doubles during each cycle.
Figure 3
Figure 3
Principles of digital PCR. The sample is divided into many independent partitions such that each contains either a few or no target sequences. The distribution of target sequences in the partitions can be approximated with a Poisson’s distribution. Each partition acts as an individual PCR microreactor and partitions containing amplified target sequences are detected by fluorescence. The ratio of positive partitions (presence of fluorescence) over the total number allows to determine the concentration of the target in the sample.
Figure 4
Figure 4
Comparison of PCR-based techniques. In conventional PCR, the amplification products are analyzed at the end of the reaction (end-point PCR) by gel electrophoresis and detected after fluorescent staining. qPCR and dPCR use the same amplification reagents and fluorescent labeling systems. In qPCR, the amount of amplified DNA is measured at each cycle during the PCR reaction, i.e., in real-time. The ‘absolute’ quantity of target sequence is interpolated using a standard curve generated with a calibrator. In dPCR, the sample is first partitioned into many sub-volumes (in microwells, chambers or droplets) such that each partition contains either a few or no target sequences. After PCR, the proportion of amplification-positive partitions serves to calculate the concentration of the target sequence using Poisson’s statistics.
Figure 5
Figure 5
Quantification accuracy of dPCR. The precision of dPCR is non-uniform and depends on the average occupancy of target sequence per partition. The precision of dPCR also increases with an increasing number of partitions (distinct colors). The inset shows that the evolution of the relative uncertainty (taken at λ ≈ 1.6) decays as an invert square root of the number of partitions.
Figure 6
Figure 6
Active partitioning platforms. (a) Schematic of a push-up valve in a microfluidic chip made of PDMS. Left panel: The control channels (red) are separated from the fluidic channels (blue) by a thin flexible membrane (yellow). The flow through the fluidic channel is unobstructed if the control channel is not pressurized (OFF valve). When the control channel is pressurized, the thin PDMS membrane deforms and bulges into the fluidic channel, obstructing the flow (ON valve). As depicted in the bottom panel, a tight seal is obtained if the top of the fluidic channel is rounded. Central panel: Schematic diagram showing many parallel chambers (blue) connected through channels to a single input. The network of control channels (red) creates valves between each chamber allowing the partitioning of their content into independent PCR microreactors. Right panel: Three panels of 1176 chambers each, show the results of dPCR on samples harvested from a single termite (Z. nevadensis). (Figure adapted from [65] with permission.); (b) SlipChip device relies on two chip halves that contain arrays of open chambers. Temporary ducts or channels are formed when the two parts are aligned and put in contact while submerged in mineral oil. Sample and reagents are injected before the device is reconfigured by slipping. The slipping motion creates arrays of independent microreactors. The device can be further slipped to bring the two independent arrays (containing reagent and sample) in contact to trigger mixing (not shown). (Figure adapted from [66] with permission.)
Figure 7
Figure 7
Passive partitioning platforms. (a) Megapixel digital PCR using planar emulsion arrays. Left panel: Schematic of the megapixel digital PCR device, with insets showing the array and chambers at increasing magnification. Scale bar: 3 mm. Central panel: The chambers are loaded with a blue dye. The arrow indicates chambers isolated by immiscible oil. Scale bar: 50 μm. Right panel: Multiplexed detection of HLCS (green) and RPPH1 (blue) over 342 chambers. (top). A close-up view shows the signals of the boxed chambers in the different fluorescence channels (middle), with the corresponding intensity profile of the middle row (bottom). Scale bars: 50 μm. (Figure adapted from [37] with permission.); (b) Vacuum-assisted reagent loading in a PDMS-based array of microwells. Left panel: The schematic of the microfluidic chip depicts the process of reagent loading into the lamina chip layer via a μfilter layer. The syringe is used to create a temporary vacuum through the PDMS layer and drive liquid into the microwells. Right panel: Device loaded with the reagent (red) and water (blue). (Figure adapted from [72] with permission.)
Figure 8
Figure 8
Self-filling and partitioning platforms. (a) Geometry for a staggered trap configuration where filling is controlled by pinning. The design enables an efficient filling by the sweeping motion of the solution through the traps and thus avoids trapping air within the chambers. The pinning offset is different on each side of the main channel thanks to a barrier wall. The loading process of the staggered device is shown in the pictures. The device incorporates a capillary pump that passively aspirates the excess of liquid. (Figure adapted from [69] with permission.); (b) Schematic of the self-digitization device that contains 1020 wells. The device is first primed with oil, then filled with the reaction mix and injected with another stream of oil to create an array of droplets trapped in the structures. (Figure adapted from [76] with permission.)
Figure 9
Figure 9
Microfluidic droplet-based platforms. (a) Schematic illustrating the generation of droplets with a nozzle or droplet generator. The aqueous phase is pinched by two streams of immiscible oil that stretch the interface via viscous forces until a capillary instability develops and the droplet detaches. Droplets are very stable thanks to surfactants that stabilize their interface; (b) The fluorescence signal from droplets can be sequentially detected in a single-file configuration. This arrangement is reminiscent of the optical and fluidic configurations used in flow cytometry. (Figure adapted from [86] with permission.); (c) Droplet signal can also be interrogated using a wide field detection that allows up to 1 million droplets to be analyzed simultaneously (Figure adapted from [43] with permission.); (d) Microfluidic droplets can be generated with a simplified experimental setup that relies on a gradient of confinement (a type of step emulsification). (Figure adapted from [87] with permission.); (e) Alternatively, highly parallel droplet generators have been adapted to actuation by centrifuge, which allows concurrent encapsulation of several samples. Scale bar: 500 μm. (Figure adapted from [88] with permission.)
Figure 10
Figure 10
Multiplex droplet dPCR assays. dPCR assays can be multiplexed by coding the level of fluorescence of the plateau phase because dPCR can be implemented as a non-competing template assay, where each target is isolated in different partitions.

Similar articles

Cited by

References

    1. Arya M., Shergill I.S., Williamson M., Gommersall L., Arya N., Patel H.R. Basic Principles of Real-Time Quantitative PCR. Expert Rev. Mol. Diagn. 2005;5:209–219. doi: 10.1586/14737159.5.2.209. - DOI - PubMed
    1. Bustin S.A., Benes V., Garson J.A., Hellemans J., Huggett J., Kubista M., Mueller R., Nolan T., Pfaffl M.W., Shipley G.L., et al. The MIQE Guidelines: Minimum Information for Publication of Quantitative Real-Time PCR Experiments. Clin. Chem. 2009;55:611–622. doi: 10.1373/clinchem.2008.112797. - DOI - PubMed
    1. Svec D., Tichopad A., Novosadova V., Pfaffl M.W., Kubista M. How Good Is a PCR Efficiency Estimate: Recommendations for Precise and Robust qPCR Efficiency Assessments. Biomol. Detect. Quantif. 2015;3:9–16. doi: 10.1016/j.bdq.2015.01.005. - DOI - PMC - PubMed
    1. Bustin S.A., Benes V., Garson J., Hellemans J., Huggett J., Kubista M., Mueller R., Nolan T., Pfaffl M.W., Shipley G. The Need for Transparency and Good Practices in the qPCR Literature. Nat. Methods. 2013;10:1063–1067. doi: 10.1038/nmeth.2697. - DOI - PubMed
    1. Dijkstra J.R., van Kempen L.C., Nagtegaal I.D., Bustin S.A. Critical Appraisal of Quantitative PCR Results in Colorectal Cancer Research: Can We Rely on Published qPCR Results? Mol. Oncol. 2014;8:813–818. doi: 10.1016/j.molonc.2013.12.016. - DOI - PMC - PubMed