. 2018 Apr 20;14(4):e1007010.
doi: 10.1371/journal.ppat.1007010. eCollection 2018 Apr.

HIV-1 adaptation studies reveal a novel Env-mediated homeostasis mechanism for evading lethal hypermutation by APOBEC3G

Affiliations

HIV-1 adaptation studies reveal a novel Env-mediated homeostasis mechanism for evading lethal hypermutation by APOBEC3G

Terumasa Ikeda et al. PLoS Pathog. .

Abstract

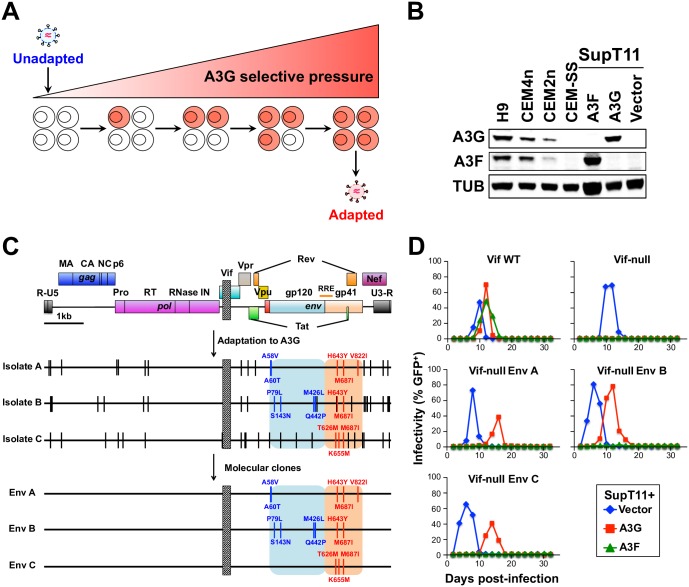
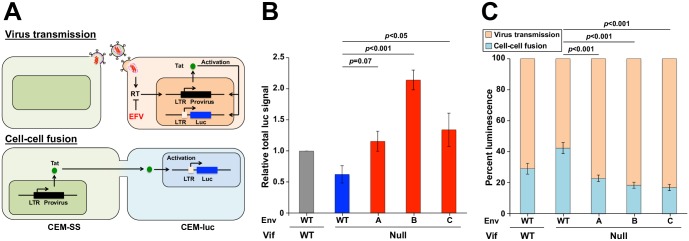
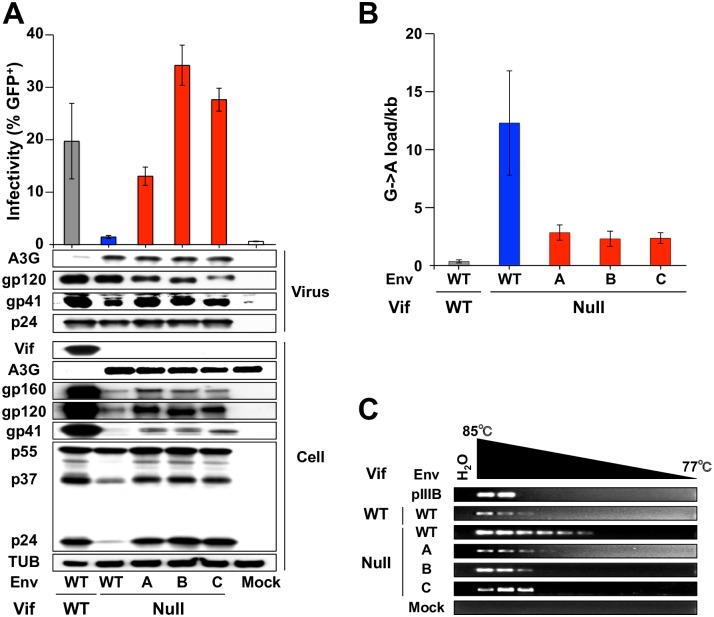
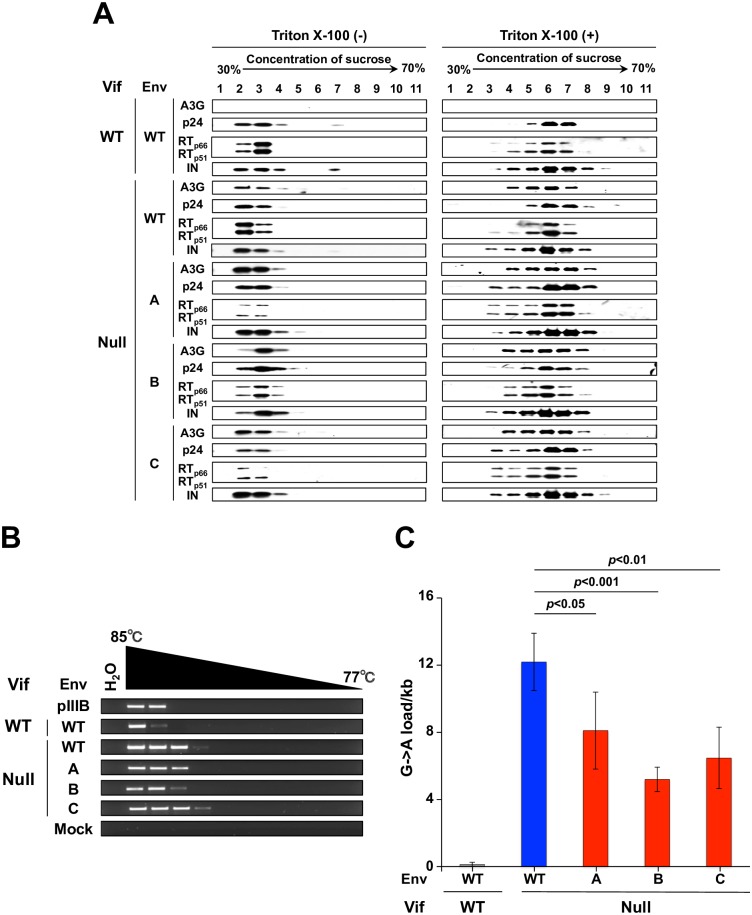
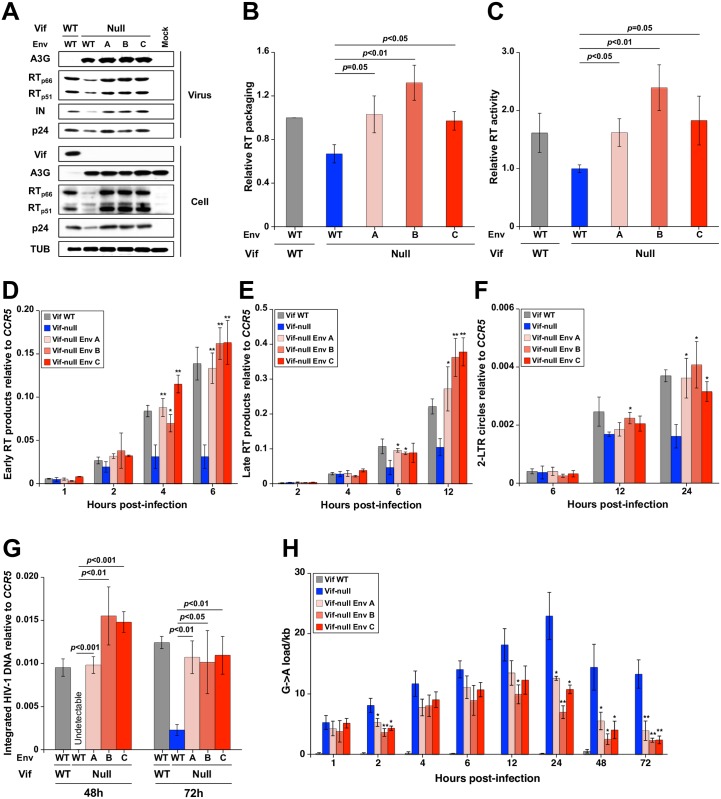
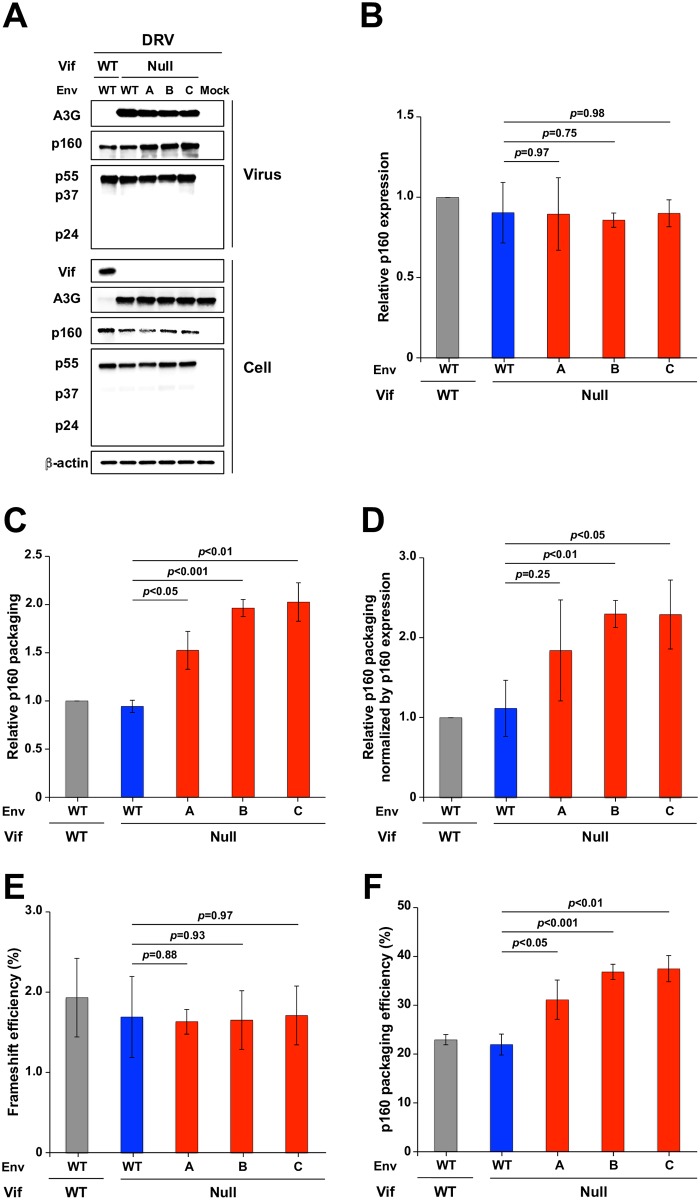
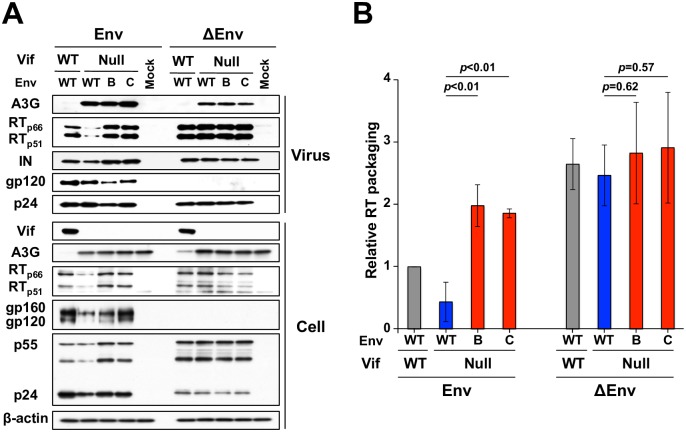
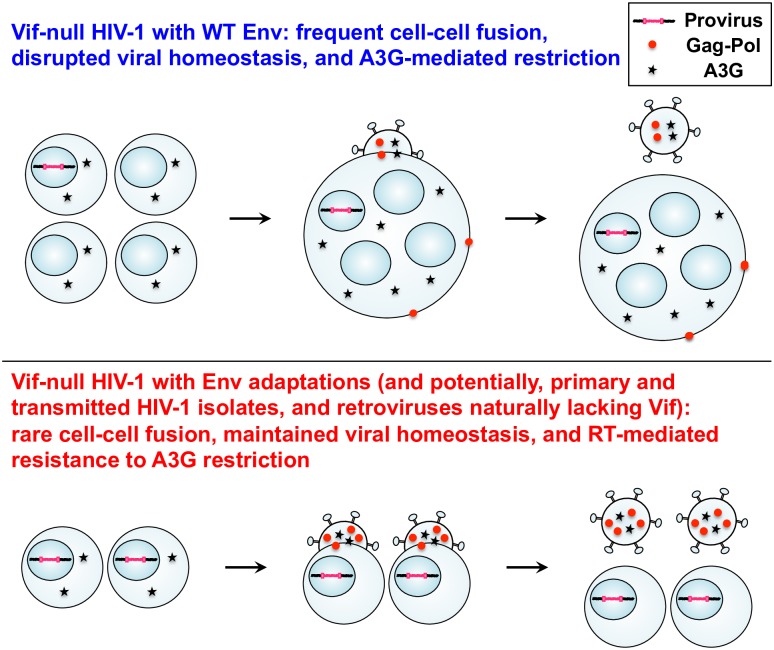
HIV-1 replication normally requires Vif-mediated neutralization of APOBEC3 antiviral enzymes. Viruses lacking Vif succumb to deamination-dependent and -independent restriction processes. Here, HIV-1 adaptation studies were leveraged to ask whether viruses with an irreparable vif deletion could develop resistance to restrictive levels of APOBEC3G. Several resistant viruses were recovered with multiple amino acid substitutions in Env, and these changes alone are sufficient to protect Vif-null viruses from APOBEC3G-dependent restriction in T cell lines. Env adaptations cause decreased fusogenicity, which results in higher levels of Gag-Pol packaging. Increased concentrations of packaged Pol in turn enable faster virus DNA replication and protection from APOBEC3G-mediated hypermutation of viral replication intermediates. Taken together, these studies reveal that a moderate decrease in one essential viral activity, namely Env-mediated fusogenicity, enables the virus to change other activities, here, Gag-Pol packaging during particle production, and thereby escape restriction by the antiviral factor APOBEC3G. We propose a new paradigm in which alterations in viral homeostasis, through compensatory small changes, constitute a general mechanism used by HIV-1 and other viral pathogens to escape innate antiviral responses and other inhibitions including antiviral drugs.


Conflict of interest statement

RSH is a co-founder, shareholder, and consultant of ApoGen Biotechnologies Inc. The other authors declare no competing financial interests.

Figures

Fig 1
Fig 1. Env mutations render Vif-null HIV-1 fully resistant to A3G.
(A) A schematic of the stepwise procedure used for virus adaptation to A3G. (B) Immunoblots of endogenous or stably expressed A3G or A3F in the indicated cell lines. Tubulin (TUB) is the loading control. (C) Schematic of the vif-null parental virus, the 3 independent A3G-adapted isolates, and the 3 molecular clones. Vertical bars depict fixed mutations, and a box depicts the vif deletion. The gp120 and gp41 regions of env are highlighted in blue and red. (D) Representative spreading infection data for the indicated viral molecular clones in SupT11 cells stably expressing a vector control, A3G, or A3F.
Fig 2
Fig 2. Env mutations exhibit reduced syncytium formation and foster more efficient virus transmission.
(A) Schematic of virus transmission and cell-cell fusion events that result in luciferase expression upon co-culture of HIV-infected CEM-SS producer cells and CEM-luc target cells. In each scenario, HIV-1 Tat drives expression of an LTR-luciferase reporter gene in the CEM-luc target cells. Virus transmission is sensitive to RT inhibition by EFV because infection and de novo expression of Tat is required, whereas cell-cell fusion is resistant to EFV because preexisting Tat from an infected CEM-SS cell is able to activate reporter gene expression. (B) Total luminescence normalized to Gag expression and reported relative to the Vif-proficient virus. Each histogram bar represents the mean +/- SEM of the normalized data from 4 biologically independent experiments (p-values above each panel from one-way ANOVA and Fisher’s LSD test). (C) Luminescence signal attributable to cell-cell fusion or virus transmission for the indicated viruses. Cell-cell fusion events are quantified as the fraction of total luciferase signal that is resistant to EFV-treatment, and virus transmission events are quantified by subtracting the cell-cell fusion signal from the total luminescence signal. Each histogram bar represents the mean +/- SEM of 4 biologically independent experiments (p-values above each panel from one-way ANOVA and Fisher’s LSD test).
Fig 3
Fig 3. Env adaptations protect Vif-null HIV-1 from A3G deamination.
(A) Representative pseudo-single cycle infectivity data for the indicated viruses produced in SupT11 cells stably expressing A3G. Infectivity data report the average +/- SD (n = 3). Immunoblots of the indicated proteins in viral particles following p24 normalization and producer cells are shown below for one representative experiment. (B) G-to-A mutation loads in proviral DNA from viruses originally produced in SupT11 cells expressing A3G (mean +/- SD of 3 independent experiments with a minimum of 10 sequences or 5,640 bp analyzed per condition). (C) Images of ethidium bromide-stained agarose gels containing pol 3D-PCR products recovered from CEM-GFP cells infected with the indicated viruses produced in SupT11-A3G cells. Untransfected proviral plasmid (pIIIB) and DNA from uninfected CEM-GFP (mock) are controls.
Fig 4
Fig 4. Env adaptations partly inhibit the capacity of packaged A3G to deaminate viral cDNA.
(A) Immunoblots of viral particles of the indicated genotypes produced in SupT11-A3G cells and fractionated by ultracentrifugation through a sucrose gradient in the presence or absence of detergent. A3G co-sediments with viral core components under all conditions except the Vif-proficient scenario where it is efficiently degraded. (B) Representative images of pol 3D-PCR products using viral cDNAs subjected to ERT. The indicated viruses were originally produced in SupT11 cells expressing A3G. (C) G-to-A mutation loads of high-fidelity, high temperature pol gene amplicons from viruses originally produced in SupT11-A3G and subjected to ERT (mean +/- SD of independent 4 experiments with a minimum of 10 sequences or 5,640 bp analyzed per condition). Statistical comparisons were done using a one-way ANOVA and Fisher’s LSD test (p-values above each panel).
Fig 5
Fig 5. Env adaptations increase RT packaging, accelerate reverse transcription, and reduce G-to-A mutation levels.
(A) Representative immunoblots of the indicated proteins in viral particles and producer cells from one experiment. (B) Relative RT packaging into viral particles produced in SupT11-A3G cells. RT packaging levels were quantified based on band intensity and normalized by each p24 of the virions (mean +/- SD of 3 biologically independent experiments). (C) Relative RT activity in viral particles produced in SupT11-A3G cells. RT activity was measured for each viral lysate normalized to p24 levels (mean +/- SD of 3 biologically independent experiments). (D to G) Kinetics of early RT, late RT, 2-LTR circle, and proviral DNA during infection of CEM-GFP cells using viruses originally produced in SupT11-A3G cells (mean +/- SD of 3 biologically independent experiments). (H) G-to-A mutation loads of high-fidelity, high-temperature pol amplicons from CEM-GFP cells infected with the indicated viruses (mean +/- SD of 3 biologically independent experiments with a minimum of 10 sequences or 5,640 bp per condition). Statistical comparisons for data in panels B-H were done using Student’s t test (p-values above each panel in comparison to Vif-null HIV-1; *: p<0.05, **: p<0.01, ***: p<0.001).
Fig 6
Fig 6. Env adaptations elevate levels of Gag-Pol packaging.
(A) Immunoblot data from pseudo-single cycle assays of the indicated viruses produced in SupT11-A3G cells treated with the protease inhibitor DRV at 20 μM concentration. Immunoblots of the indicated proteins in viral particles and producer cells from one representative experiment of 3 biologically independent experiments. (B) p160 expression in SupT11-A3G cells infected with the indicated viruses. p160 expression levels were quantified by determining cellular band intensities, normalized to levels for WT virus, and then dividing by relative p55 levels (mean +/- SD of 3 biologically independent experiments). (C) p160 expression in the indicated viral particles produced from SupT11-A3G cells. p160 packaging levels were quantified by determining viral particle band intensities, normalizing to levels for WT virus, and then dividing by relative p55 levels (mean +/- SD of 3 biologically independent experiments). (D) p160/p55 ratios in viral particles relative to those in cells (values from panel C divided by those in panel B; mean +/- SD). (E) p55 to p160 ribosomal frameshift efficiency in SupT11-A3G cells infected by viruses with the indicated genotypes. p160 expression levels were quantified based on band intensity and divided by the sum of the p160 and p55 band intensities (mean +/- SD of 3 biologically independent experiments). (F) Efficiency of p160 packaging into viruses with the indicated genotypes produced in SupT11-A3G cells. p160 expression levels were quantified based on band intensity and divided by the sum of the p160 and p55 band intensities (mean +/- SD of 3 biologically independent experiments). Statistical comparisons for data in panels B-E were done using Student’s t test (p-values above each panel in comparison to data for Vif-null HIV-1).
Fig 7
Fig 7. Env is a critical determinant of Gag-Pol packaging.
(A) Immunoblot data from pseudo-single cycle assays of the indicated viruses with an intact env (left) or env deletion (right) produced in SupT11-A3G cells. Immunoblots for the indicated proteins in viral particles (top panels) and producer cells (bottom panels) from one experiment representative of 3 biologically independent experiments. (B) Quantification of RT (p66 and p51) packaging levels in the indicated viruses with and without Env produced in SupT11-A3G cells. Viral particle RT band intensities were normalized to levels for WT virus, and then divided by relative p24 levels (mean +/- SD of data from 3 biologically independent experiments).
Fig 8
Fig 8. Model relating cell-cell fusogenicity, viral homeostasis, and A3G antiviral activity.
The upper panel depicts a vif-null scenario with frequent syncytia and disrupted viral homeostasis characterized by less Gag-Pol packaging, slower reverse transcription, and a high susceptibility to A3G-mediated restriction. The lower panel depicts an adapted virus scenario with few syncytia and restored viral homeostasis including more Gag-Pol packaging, higher rates of reverse transcription, and resistance to A3G-mediated restriction. Individual cells are depicted with one nucleus, and fused cells with four nuclei. For simplicity, individual cells are shown producing particles with 4 units of RT and 2 units of A3G, whereas the syncytium is shown producing particles with 50% less RT (2 units) with the same amount of A3G (2 units). See text for additional explanation.

References

    1. Conticello SG. The AID/APOBEC family of nucleic acid mutators. Genome Biol. 2008;9(6):229 doi: 10.1186/gb-2008-9-6-229 . - DOI - PMC - PubMed
    1. Harris RS, Liddament MT. Retroviral restriction by APOBEC proteins. Nat Rev Immunol. 2004;4(11):868–77. doi: 10.1038/nri1489 . - DOI - PubMed
    1. Desimmie BA, Delviks-Frankenberrry KA, Burdick RC, Qi D, Izumi T, Pathak VK. Multiple APOBEC3 restriction factors for HIV-1 and one Vif to rule them all. J Mol Biol. 2014;426(6):1220–45. doi: 10.1016/j.jmb.2013.10.033 . - DOI - PMC - PubMed
    1. Harris RS, Dudley JP. APOBECs and virus restriction. Virology. 2015;479–480C:131–45. doi: 10.1016/j.virol.2015.03.012 . - DOI - PMC - PubMed
    1. Simon V, Bloch N, Landau NR. Intrinsic host restrictions to HIV-1 and mechanisms of viral escape. Nat Immunol. 2015;16(6):546–53. doi: 10.1038/ni.3156 . - DOI - PMC - PubMed

Publication types

Substances