

doi: 10.1001/jama.2018.2408.
Trends in Post-Acute Care Use Among Medicare Beneficiaries: 2000 to 2015
Affiliations
- PMID: 29677292
- PMCID: PMC5933328
- DOI: 10.1001/jama.2018.2408
Item in Clipboard
Trends in Post-Acute Care Use Among Medicare Beneficiaries: 2000 to 2015
JAMA.
.
Abstract
This study uses MedPAR data to characterize trends in use of skilled nursing facilities (SNFs) and inpatient rehabilitation facilities (IRFs) after acute care hospitalizations and trends in hospital and SNF/IRF lengths of stay among Medicare beneficiaries.
Conflict of interest statement
Figures
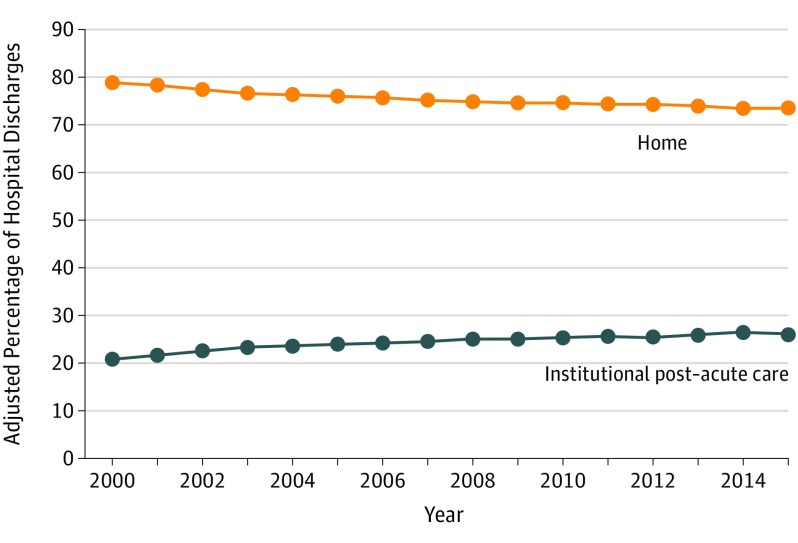
Estimates are adjusted for patient age, sex, race, and Elixhauser comorbidities. The median number of hospital discharges to home per year was 6 664 718 (interquartile range [IQR], 5 768 018-7 367 173) and the median number of discharges to post–acute care per year was 2 151 959 (IQR, 1 978 709-2 199 801).
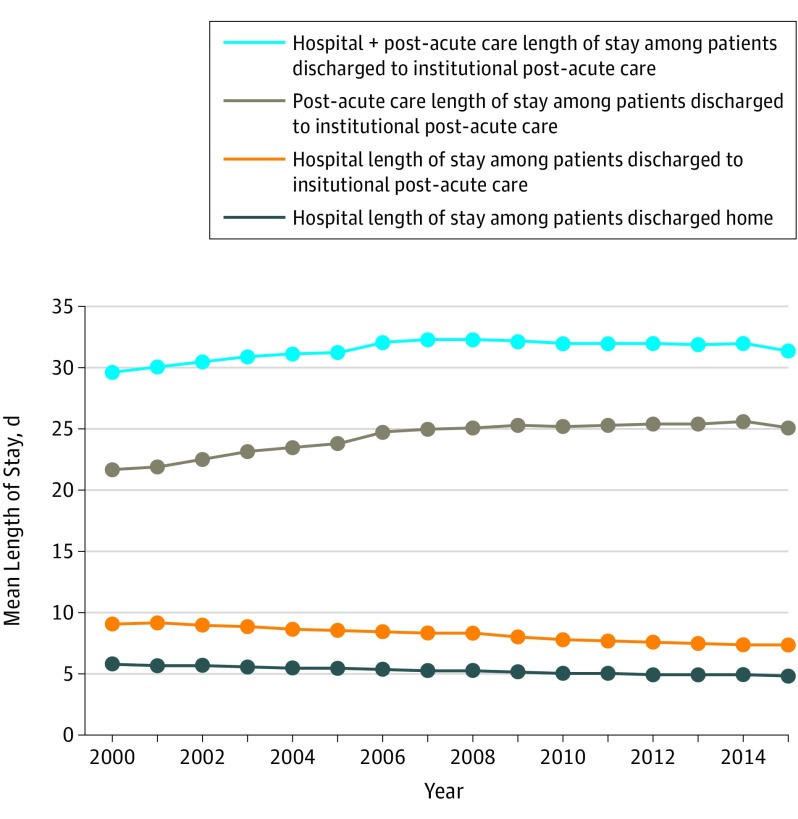
Estimates are adjusted for patient age, sex, race, and Elixhauser comorbidities. The median number of hospital discharges to home per year was 6 664 718 (interquartile range [IQR], 5 768 018-7 367 173) and the median number of discharges to post–acute care per year was 2 151 959 (IQR, 1 978 709-2 199 801).
Comment in
-
Re: Trends in Post-Acute Care Use among Medicare Beneficiaries: 2000 to 2015.J Urol. 2019 Jan;201(1):20-21. doi: 10.1097/01.ju.0000550138.19493.79. J Urol. 2019. PMID: 30577360 No abstract available.
References
-
- Burke RE, Juarez-Colunga E, Levy C, Prochazka AV, Coleman EA, Ginde AA. Rise of post–acute care facilities as a discharge destination of US hospitalizations. JAMA Intern Med. 2015;175(2):295-296. - PubMed
-
- MedPAC Data Book: Health Care Spending and the Medicare Program. Washington, DC: Medicare Payment Advisory Commission; 2017.
-
- Mechanic R. Post–acute care—the next frontier for controlling Medicare spending. N Engl J Med. 2014;370(8):692-694. - PubMed
-
- Dummit LA, Kahvecioglu D, Marrufo G, et al. Association between hospital participation in a medicare bundled payment initiative and payments and quality outcomes for lower extremity joint replacement episodes. JAMA. 2016;316(12):1267-1278. - PubMed
-
- Centers for Medicare & Medicaid Services MedPAR RIF. https://www.resdac.org/cms-data/files/medpar-rif. Accessed February 9, 2018.
MeSH terms
Grants and funding
LinkOut - more resources
Full Text Sources
Other Literature Sources
Medical
