. 2018 Apr 19;173(3):693-705.e22.
doi: 10.1016/j.cell.2018.03.003.

Nuclear Import Receptor Inhibits Phase Separation of FUS through Binding to Multiple Sites

Affiliations

Nuclear Import Receptor Inhibits Phase Separation of FUS through Binding to Multiple Sites

Takuya Yoshizawa et al. Cell. .

Abstract

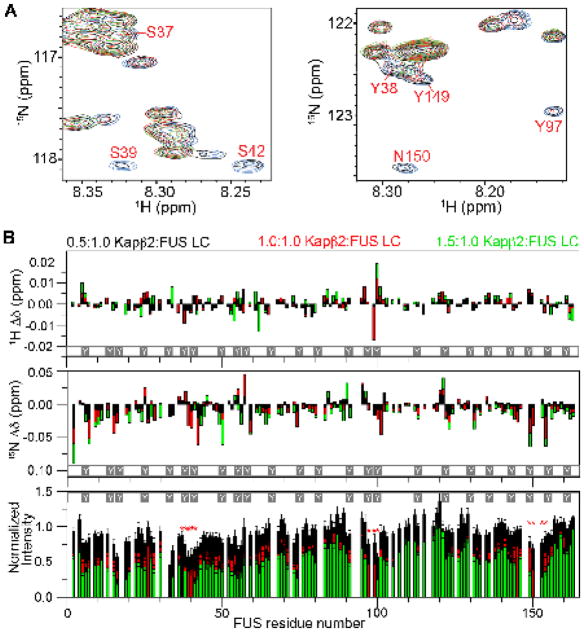
Liquid-liquid phase separation (LLPS) is believed to underlie formation of biomolecular condensates, cellular compartments that concentrate macromolecules without surrounding membranes. Physical mechanisms that control condensate formation/dissolution are poorly understood. The RNA-binding protein fused in sarcoma (FUS) undergoes LLPS in vitro and associates with condensates in cells. We show that the importin karyopherin-β2/transportin-1 inhibits LLPS of FUS. This activity depends on tight binding of karyopherin-β2 to the C-terminal proline-tyrosine nuclear localization signal (PY-NLS) of FUS. Nuclear magnetic resonance (NMR) analyses reveal weak interactions of karyopherin-β2 with sequence elements and structural domains distributed throughout the entirety of FUS. Biochemical analyses demonstrate that most of these same regions also contribute to LLPS of FUS. The data lead to a model where high-affinity binding of karyopherin-β2 to the FUS PY-NLS tethers the proteins together, allowing multiple, distributed weak intermolecular contacts to disrupt FUS self-association, blocking LLPS. Karyopherin-β2 may act analogously to control condensates in diverse cellular contexts.

Keywords: FUS; PY-NLS; RNA granule; amyotrophic lateral sclerosis; biomolecular condensate; intrinsically disordered protein; karyopherin-β2; liquid-liquid phase separation; low-complexity sequences; transportin-1.


Conflict of interest statement

Declaration of Interests

The authors declare no conflict of interest.

Figures

Figure 1
Figure 1. Kapβ2 inhibits FUS turbidity and phase separation in a PY-NLS- and RanGTP-dependent manner
A) Domain organization of FUS. B) Turbidity of 8 μM MBP-FUS ± 8 μM Kapβ2, measured for 60 min at room temperature after addition of Tev protease to remove MBP from MBP-FUS. C) Turbidity of 8 μM MBP-FUS in the presence of buffer, 8 μM Kapβ2 ± RanGTP or inhibitor M9M, or Kapβ2Δloop ± RanGTP (60 min after Tev). D) Either 8 μM Kapβ2 or buffer was added at time=60 min to turbid FUS (8 μM MBP-FUS pre-treated with Tev for 60 min) and OD395nm measured for the next 20 min. B)-D), OD395nm normalized to measurements of MBP-FU+buffer+Tev at time=60 min. C)-D), mean of 3 technical replicates, ± S.D. E) Mixtures containing 5 μM MBP-FUS, 0.5 μM MBP-FUS-SNAPSNAP-Surface 649 and either buffer or 10 μM Kapβ2 were treated with Tev and imaged 1 hr later. (Supplementary Movie 1 also shows FUS droplets at time=1 hr.) F) Mixtures of 5 μM MBP-FUS and 0.5 μM MBP-FUS-SNAPSNAP-Surface 649 were treated with Tev for 1 hr prior to addition of 10 μM of Kapβ2, which cleared FUS droplets in less than 5 min (see also Supplementary Movie 2). Kapβ2 added to phase separated FUS 48 hr after Tev treatment cleared most of the phase separated material in 120 min (Supplementary Movie 3 also shows the first 30 min after Kapβ2 addition). Images in E)-F) were obtained with spinning disk confocal microscopy (561 nm laser illumination; 60x 1.4na oil immersion objective lenses) and 20 μm length scale bars are shown. See also Figure S1.
Figure 2
Figure 2. Imp-α/β and Kap121 inhibit FUS phase separation when their NLS is introduced into FUS, but Kapβ2 does not act non-specifically to inhibit FUS phase separation
A) Turbidity of wildtype FUS in the presence of buffer, Kapβ2, Impα/β, cNLS-bound Impα/β, Kap121 or IK-NLS-bound Kap121. B) Turbidity of FUS(cNLS) chimera (FUS PY-NLS replaced with the SV40 T antigen cNLS) in the presence of buffer, Impα/β, Impα/β•RanGTP or Impα. C) Turbidity of FUS(IK-NLS) chimera (PY-NLS replaced with IK-NLS from Pho4) in the presence of buffer, Kap121 or Kap121•RanGTP. D) Turbidity of FUS(NES) chimera (PY-NLS replaced with the NES from the NS2 protein of MVM virus) in the presence of buffer or CRM1. 8 μM proteins were used in A)-D), and OD395nm were normalized to those of MBP-FUS+buffer+Tev at time=60 min. E) Diffusion coefficients of Kapβ2 were measured at different concentrations by dynamic light scattering. Error bars represent S.D. from 3 technical replicates. See also Figure S2 and Table S1.
Figure 3
Figure 3. Kapβ2 interacts weakly and non-uniformly with residues in FUS LC
A) Overlay of 2D 1H-15N spectra of 75 μM 15N-FUS LC alone (blue) or with increasing concentrations of Kapβ2: 37.5 μM (0.5:1, black), 75 μM (1:1, red), 112.5 μM (1.5:1, green), showing three of the FUS LC regions (residues 37–41, 97–100, 149–154) most affected by Kapβ2 resulting in chemical shifts and intensity attenuations. B) Titrations at 10 °C of 75 μM FUS LC with increasing concentrations of Kapβ2 compared to FUS LC alone. NMR chemical shift deviations, 1H (top) and 15N (middle), and resonance intensity attenuation (bottom) are plotted. Increasing extent of chemical shift differences of 1H and 15N resonance position, as well as resonance intensity attenuation, support Kapβ2 binding weakly to across the entire FUS LC domain. Resonance intensity attenuation and chemical shifts are non-uniformly distributed as segments 37SYSGY41, 97YPGY100 and 149YSPPSG154 (white Ys mark the 24 tyrosines in FUS LC) show the largest perturbations in amide resonance intensity (red asterisks, bottom panel) in the presence of Kapβ2. These segments also show large 15N and/or 1H chemical shift deviations. See also Figure S3.
Figure 4
Figure 4. Kapβ2 interacts weakly with the folded RRM and ZnF domains within FUS(164–500)
A) Attenuations in intensity (I/I0) of assigned RRM domain non-proline resonances in FUS(164–500) in the cross saturation transfer experiment. Deuterated 15N-FUS(164–500) was cross saturated from protonated Kapβ2-M9M (1.5-fold molar excess) and intensities of assigned RRM resonances were measured with (I) and without (I0) irradiation in aliphatic region. B) Ribbon (left) and surface (middle and right panels) representations of the RRM (PDBID 1LCW; green), showing binding sites for Kapβ2 (magenta, residues with I/I0<0.4 in cross saturation experiment) and RNA (yellow). C) Same as (A), but shown here are I/I0 of assigned ZnF domain non-proline resonances in FUS(164–500) in the cross saturation transfer experiment. D) Selected resonances of RRM (green) and ZnF (orange) domains from TROSY 1H-15N HSQC/1H-15N HSQC NMR spectra of 15N-FUS(164–500) showing change in intensity in cross saturation and line broadening experiments upon addition of 3-fold molar excess Kapβ2-M9M. E) Homology model of the FUS ZnF domain (orange; from ZnF in ZNF265, PDBID 2K1P). Ribbon (left) and surface (middle and right) representations showing binding sites for Kapβ2 (magenta, residues with I/I0<0.55 in cross saturation experiment) and RNA (yellow). Residues with unassigned/missing/proline resonances are in white. See also Figure S4.
Figure 5
Figure 5. Kapβ2 interacts with disordered RGG regions
Attenuation of glycine resonances in 1H/15N HSQC NMR spectra of 15N-FUS(164–500) (A), RGG1 (B), RGG2-ZnF (C) and ZnF-RGG3 (D) upon addition of 2-fold molar excess of Kapβ2•M9M. E–F) Selected glycine amide resonances of RGG2 (E) and RGG3 (F, left) in 1H-15N HSQC spectra ± 2-fold molar excess Kapβ2•M9M. F) Right, selected glycine amide resonances of RGG3 in 1H-15N TROSY-based cross saturation transfer experiments in the presence of a 1.5-fold molar excess of Kapβ2•M9M with off- or on-resonance saturation. Cross saturation experiment was performed on 2H/15N-FUS(164–500) complexed with unlabeled Kapβ2•M9M in 1:1.5 molar ratio. See also Figure S5, Tables S2 and S3.
Figure 6
Figure 6. Implications of Kapβ2 binding to multiple sites across FUS: SAXS analysis and RNA-binding
A) SAXS profiles of MBP, MBP-FUS, Kapβ2, Kapβ2•FUS, and Kapβ2•MBP-FUS produced radius of gyration RgSAXS, maximum particle size Dmax, and pair distribution function P(r). RgGlobular was estimated using the formula of 6.6*MW0.333 Å. Right, ab initio shapes of MBP-FUS and Kapβ2•FUS with the structures of MBP (PDBID 1Y4C), Kapβ2 (PDBID 2QMR), and the FUS PY-NLS (Figure S2F, G) coarsely fitted to the SAXS envelopes. See also Figure S6 and Table S4. B) Size exclusion chromatography (monitored by Abs280 nm, Abs260 nm and fluorescence emission at 520 nm (Em520 nm)) of 1 μM prD RNA alone and 1 μM prD + 3 μM MBP-FUS (left), and of 1 μM prD + 3 μM MBP-FUS+3.2 μM Kapβ2 (right). C) Size exclusion chromatography as in B) of 2 μM TERRA RNA alone and 2 μM TERRA + 3 μM MBP-FUS (left), and 2 μM TERRA + 3 μM MBP-FUS + 3.2 μM Kapβ2 (right). 5′ of the RNAs were labeled with 6-FAM fluorophore and proteins were visualized by Coomassie blue stained SDS/PAGE.
Figure 7
Figure 7. Regions of FUS that bind Kapβ2 contribute to phase separation
A) Temperature dependence of FUS phase separation. Turbidity (OD395nm) of 8 μM MBP-FUS proteins (wildtype (wt) and FUS mutants) after 3 h treatment with Tev protease was monitored as temperatures were decreased from 40°C or 45°C to 0°C or 5°C. Optical densities were normalized to values measured at 0°C or 5°C. T Cloud is the x-intercept of tangent at inflection point of the curve (mean of 3 technical replicates, ± S.D.). B) Left, turbidity of 8 μM MBP-FUS(1–500), in the presence of buffer or 4–64 μM Kapβ2•M9M, measured for 60 min at room temperature after treatment with Tev protease. Right, turbidity at time=60 min of experiments in the left panel, normalized to FUS turbidity in the presence of buffer (mean of 3 technical replicates, ± S.D.). See also Figure S7.

Similar articles

Cited by

References

    1. Adams PD, Afonine PV, Bunkoczi G, Chen VB, Davis IW, Echols N, Headd JJ, Hung LW, Kapral GJ, Grosse-Kunstleve RW, et al. PHENIX: a comprehensive Python-based system for macromolecular structure solution. Acta Crystallogr D Biol Crystallogr. 2010;66:213–221. - PMC - PubMed
    1. Afonine PV, Grosse-Kunstleve RW, Echols N, Headd JJ, Moriarty NW, Mustyakimov M, Terwilliger TC, Urzhumtsev A, Zwart PH, Adams PD. Towards automated crystallographic structure refinement with phenix.refine. Acta Crystallogr D Biol Crystallogr. 2012;68:352–367. - PMC - PubMed
    1. Banani SF, Lee HO, Hyman AA, Rosen MK. Biomolecular condensates: organizers of cellular biochemistry. Nat Rev Mol Cell Biol 2017 - PMC - PubMed
    1. Brangwynne CP, Tompa P, Pappu RV. Polymer physics of intracellular phase transitions. Nat Phys. 2015;11:899–904.
    1. Brautigam CA. Calculations and Publication-Quality Illustrations for Analytical Ultracentrifugation Data. Methods Enzymol. 2015;562:109–133. - PubMed

Publication types