

Review
doi: 10.1016/S0140-6736(18)30486-0.
Epub 2018 Apr 17.
The Tsinghua-Lancet Commission on Healthy Cities in China: unlocking the power of cities for a healthy China
Affiliations
- PMID: 29678340
- PMCID: PMC7159272
- DOI: 10.1016/S0140-6736(18)30486-0
Item in Clipboard
Review
The Tsinghua-Lancet Commission on Healthy Cities in China: unlocking the power of cities for a healthy China
Lancet.
.
No abstract available
Figures
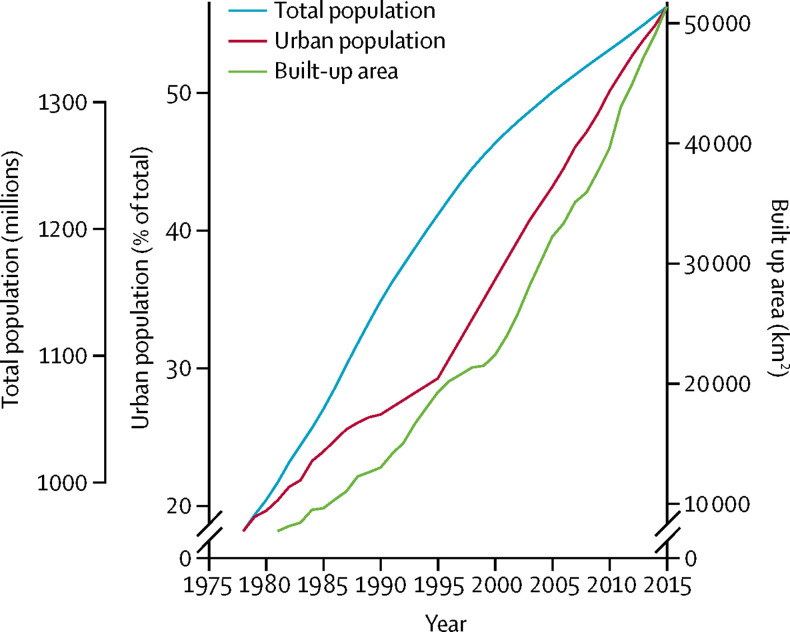
Total population, urban population, and total built-up area, 1978–2015 Source: National Bureau of Statistics of China.
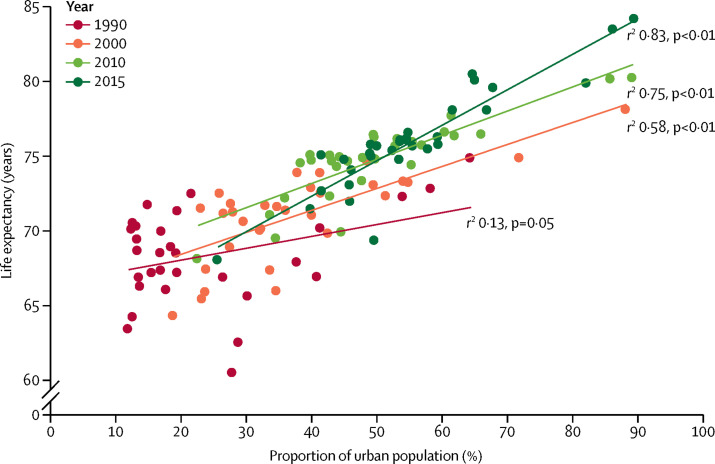
Life expectancy and proportion of urban population in each province, 1990, 2000, 2010, and 2015 Source: National Statistical Bureau of China.,
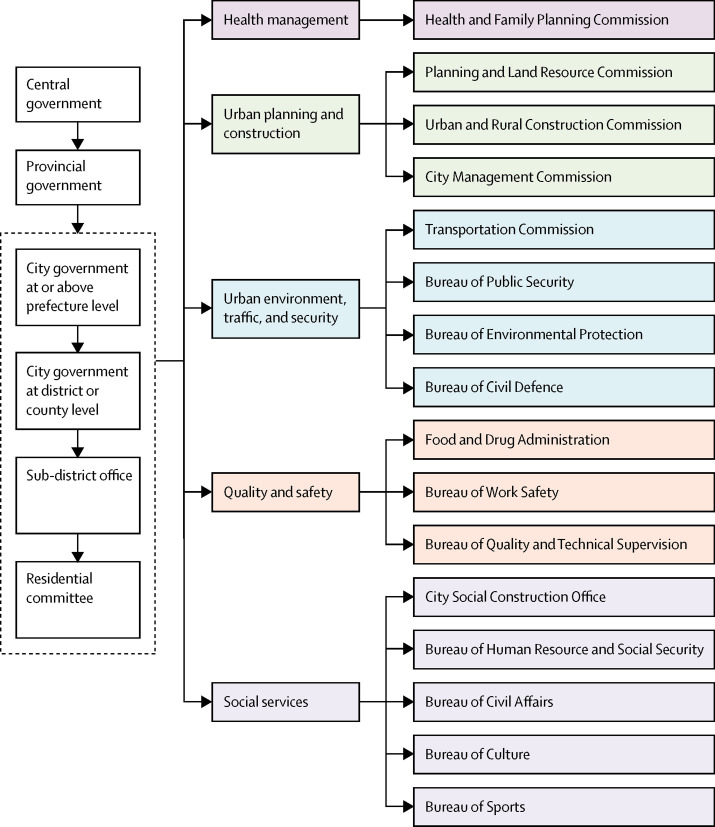
Governance structure relevant to urban health management Municipal governments at or above the prefecture and district or county levels consist of bureaus that are responsible for different aspects of city life. Sub-district offices are branches of district or county governments. Residential committees are self-governance organisations that allow for some sovereign decision making on community issues. All levels work together in a linked governance network.
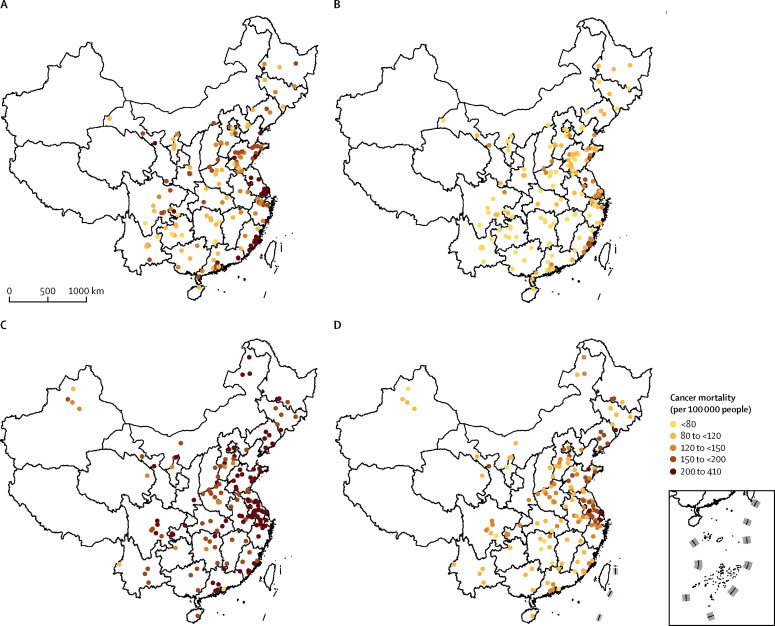
Total cancer mortality, 1990–1992 and 2013 1990–92: (A) men and (B) women. 2013: (C) men and (D) women. The inset shows the islands of the South China Sea. Source: National Cancer Center of China.
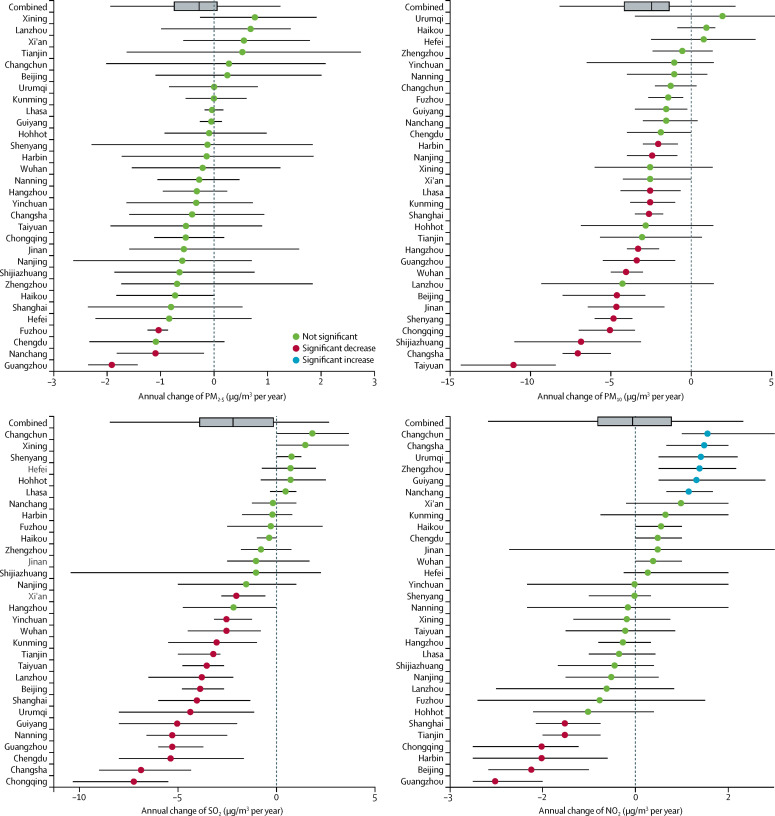
Annual concentrations of major pollutants in 31 major cities, 2003–12 Theil-Sen estimator and corresponding 95% CIs are represented by dots and lines. Source: data for PM2·5 were obtained from satellite-derived products and other data were from China Statistical Yearbook of Environment 2003–12. PM2·5=particulate matter with a diameter of less than 2·5 μm. PM10=particulate matter with a diameter of less than 10 μm.
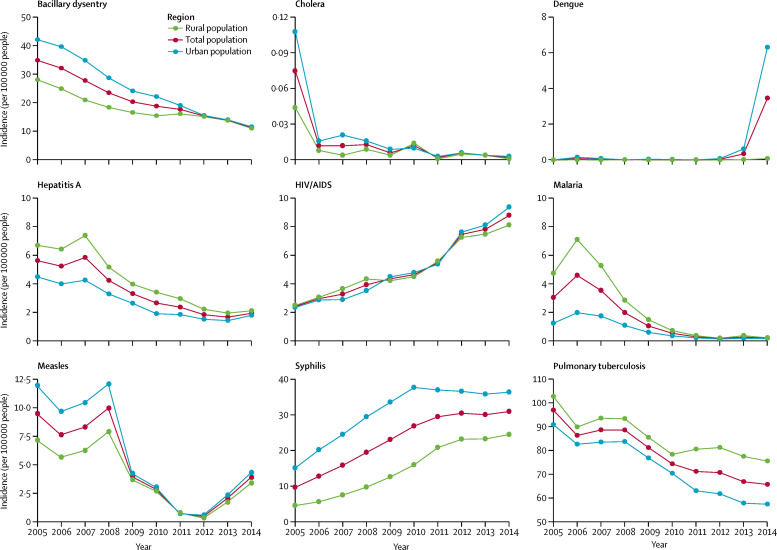
National reported incidence (per 100 000 people) of nine infectious diseases in rural and urban areas in China, 2005–14 Source: China Center for Disease Control and Prevention.
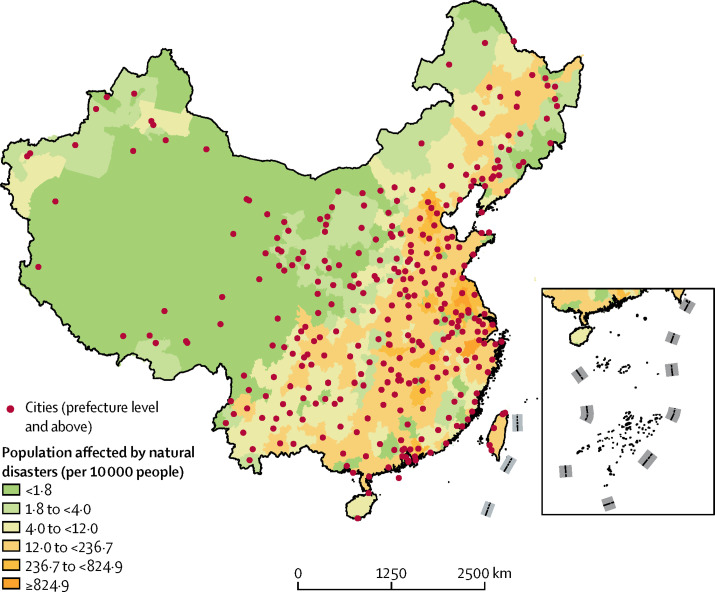
Cities considered at risk of natural disasters Natural disasters include storm surges, landslides, cold waves, heatwaves, floods, and earthquakes. The inset shows the islands of the South China Sea. Source: World Atlas of Natural Disaster Risk.
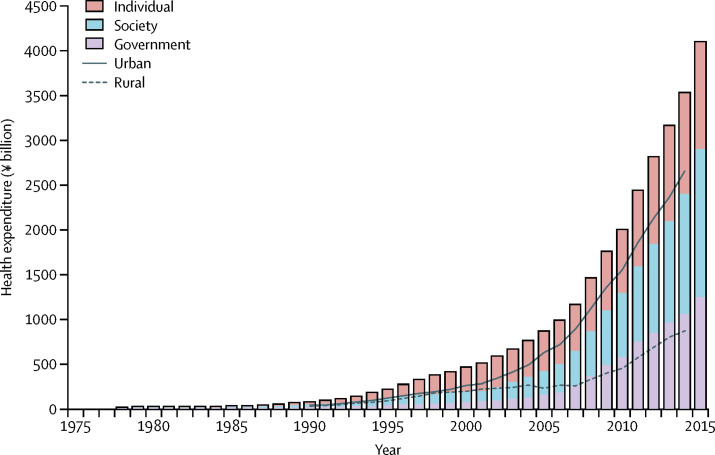
Health expenditure, 1978–2015 Source: National Health and Planning Commission. The bars show the expenditure by government, society (mainly from institutions and enterprises), and individuals. The lines show expenditure in urban and rural areas.
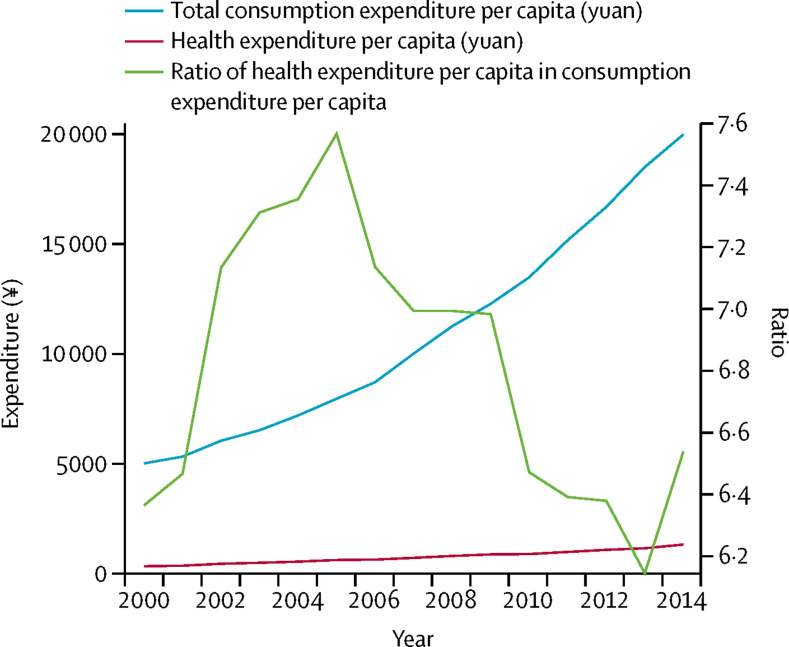
Health expenditure per capita and its share in the consumption expenditure in urban China, 2000–14 Sources: China Health Statistical Yearbook 2003–09 and China Statistical Yearbook of Health and Family Planning 2015.
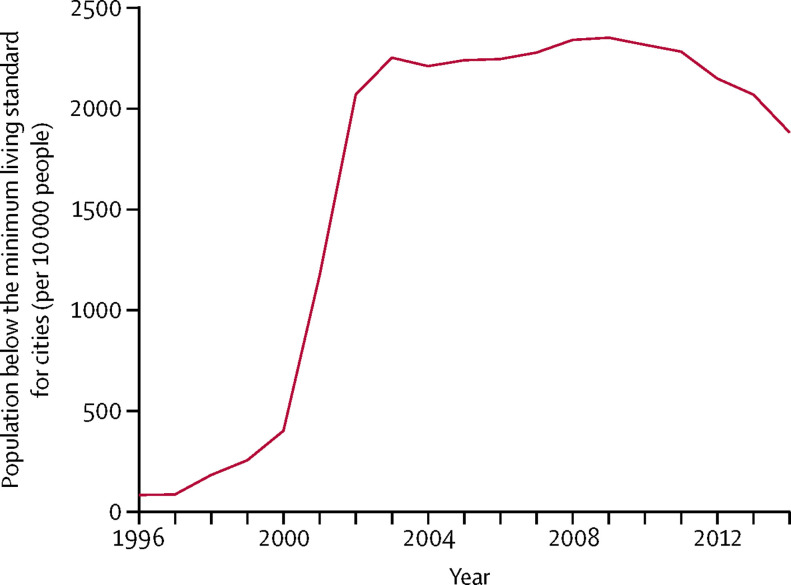
Population below the minimum living standard for cities, 1996–2014 Source: China Civil Affairs' Statistical Yearbook 2015: Statistics of China Social Services.
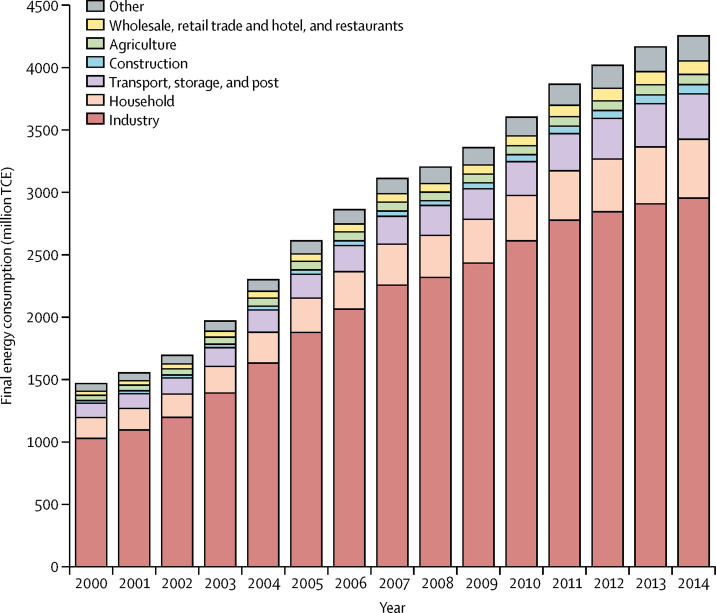
Final energy consumption, 2000–14 Source: China Energy Statistical Yearbook 2014 and China Statistical Yearbook 2015. TCE=tonne of coal equivalent.
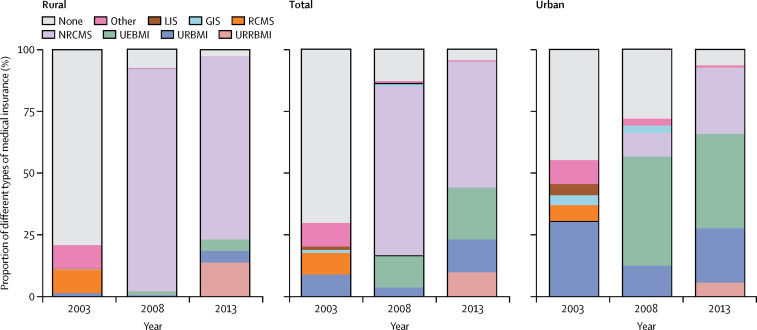
Different types of health insurances held by people living in different parts of China, 2003, 2008, and 2013 LIS=labour insurance system. GIS=government insurance system. RCMS=rural cooperative medical system. NRCMS=new rural cooperative medical system. UEBMI=urban employee-based medical insurance. URBMI=urban resident basic medical insurance. URRBMI=urban and rural resident basic medical insurance. Sources: China Health Statistics Yearbook 2003–09 and China Statistical Yearbook of Health and Family Planning 2014.
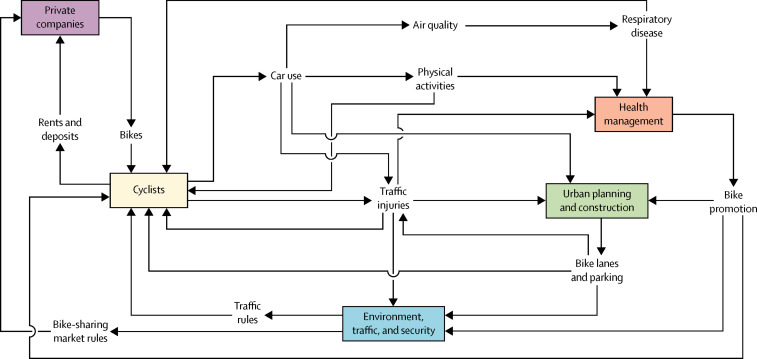
Dockless bike-sharing programme
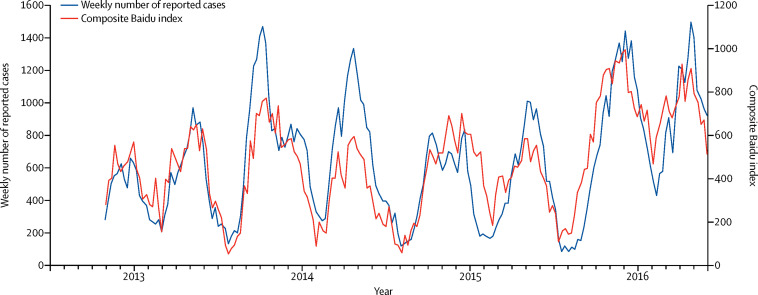
Hand, foot, and mouth disease in Chengdu, 2013–16 Weekly number of cases reported to the Sichuan Center for Disease Control and Prevention.

Comment in
-
Healthy cities: key to a healthy future in China.Lancet. 2018 May 26;391(10135):2086-2087. doi: 10.1016/S0140-6736(18)30608-1. Epub 2018 Apr 17. Lancet. 2018. PMID: 29678343 No abstract available.
References
-
- Yang G, Liu S. Analysis on the average life expectancy in population of China based on Bayesian random-effect model. Stat Res. 2015;32:95–100.
-
- Ministry of Civil Affairs Results of the fourth national survey of urban and rural elderly in China. 2015. http://www.mca.gov.cn/article/zwgk/mzyw/201610/20161000001974.shtml (accessed Feb 8, 2018).
-
- Wang H, Naghavi M, Allen C, the GBD 2015 Mortality and Causes of Death Collaborators Global, regional, and national life expectancy, all-cause mortality, and cause-specific mortality for 249 causes of death, 1980–2015: a systematic analysis for the Global Burden of Disease Study 2015. Lancet. 2016;388:1459–1544. - PMC - PubMed
-
- Wang H, Yu Y. Increasing health inequality in China: an empirical study with ordinal data. J Econ Inequal. 2016;14:41–61.
Publication types
MeSH terms
Grants and funding
LinkOut - more resources
Full Text Sources
Other Literature Sources
