

Spending on health and HIV/AIDS: domestic health spending and development assistance in 188 countries, 1995-2015
- PMID: 29678342
- PMCID: PMC5946845
- DOI: 10.1016/S0140-6736(18)30698-6
Spending on health and HIV/AIDS: domestic health spending and development assistance in 188 countries, 1995-2015
Abstract
Background: Comparable estimates of health spending are crucial for the assessment of health systems and to optimally deploy health resources. The methods used to track health spending continue to evolve, but little is known about the distribution of spending across diseases. We developed improved estimates of health spending by source, including development assistance for health, and, for the first time, estimated HIV/AIDS spending on prevention and treatment and by source of funding, for 188 countries.
Methods: We collected published data on domestic health spending, from 1995 to 2015, from a diverse set of international agencies. We tracked development assistance for health from 1990 to 2017. We also extracted 5385 datapoints about HIV/AIDS spending, between 2000 and 2015, from online databases, country reports, and proposals submitted to multilateral organisations. We used spatiotemporal Gaussian process regression to generate complete and comparable estimates for health and HIV/AIDS spending. We report most estimates in 2017 purchasing-power parity-adjusted dollars and adjust all estimates for the effect of inflation.
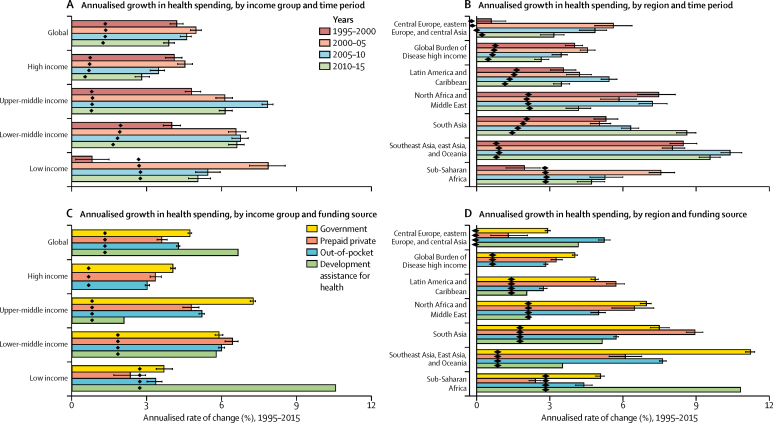
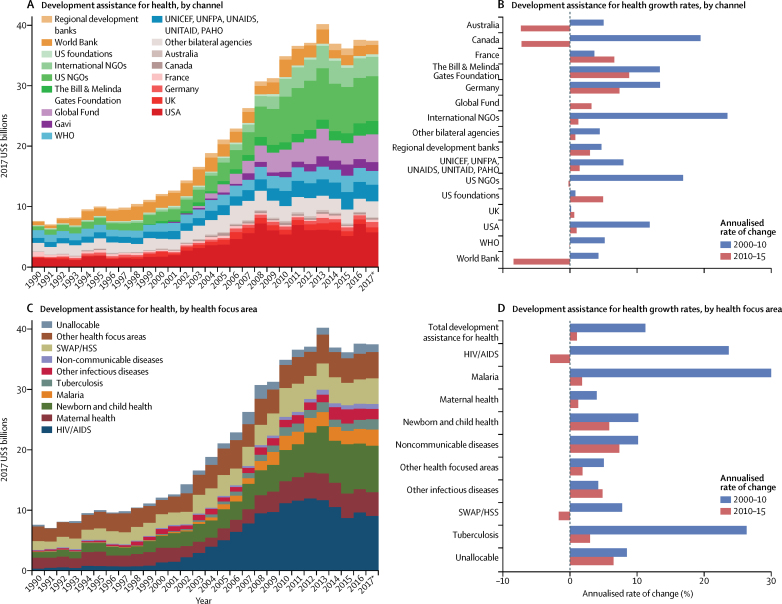
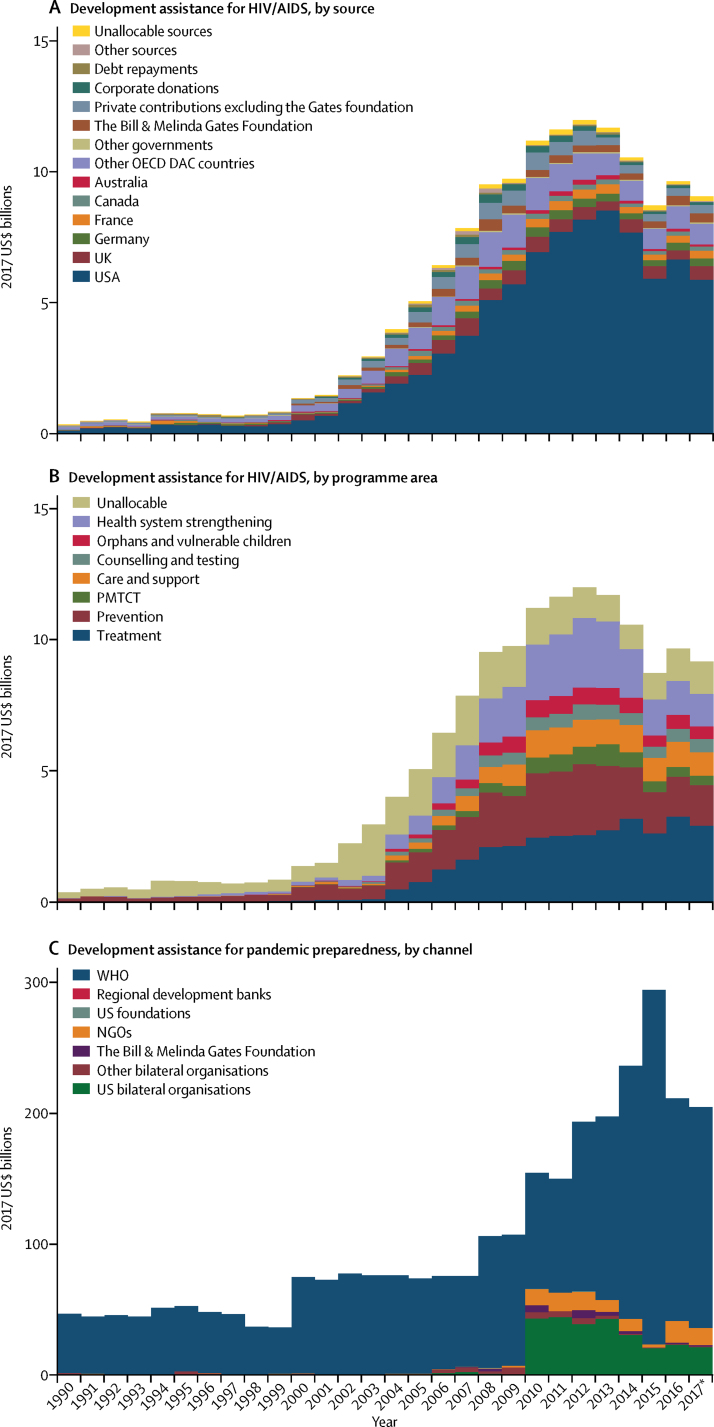
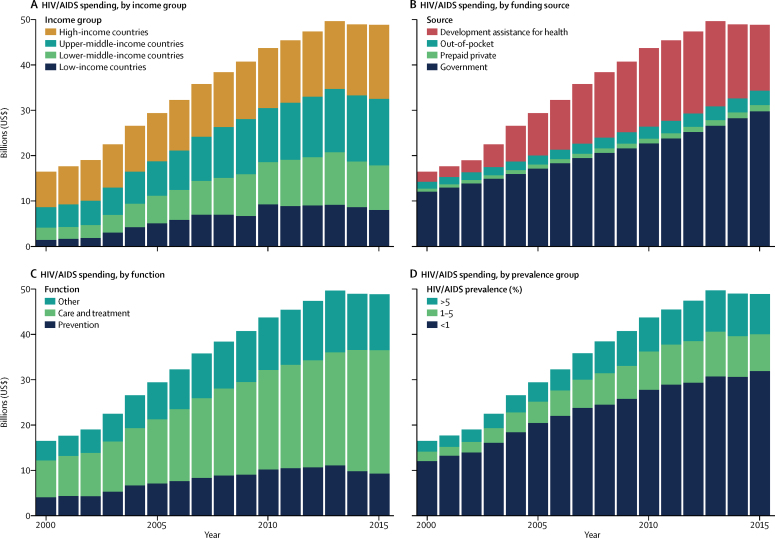
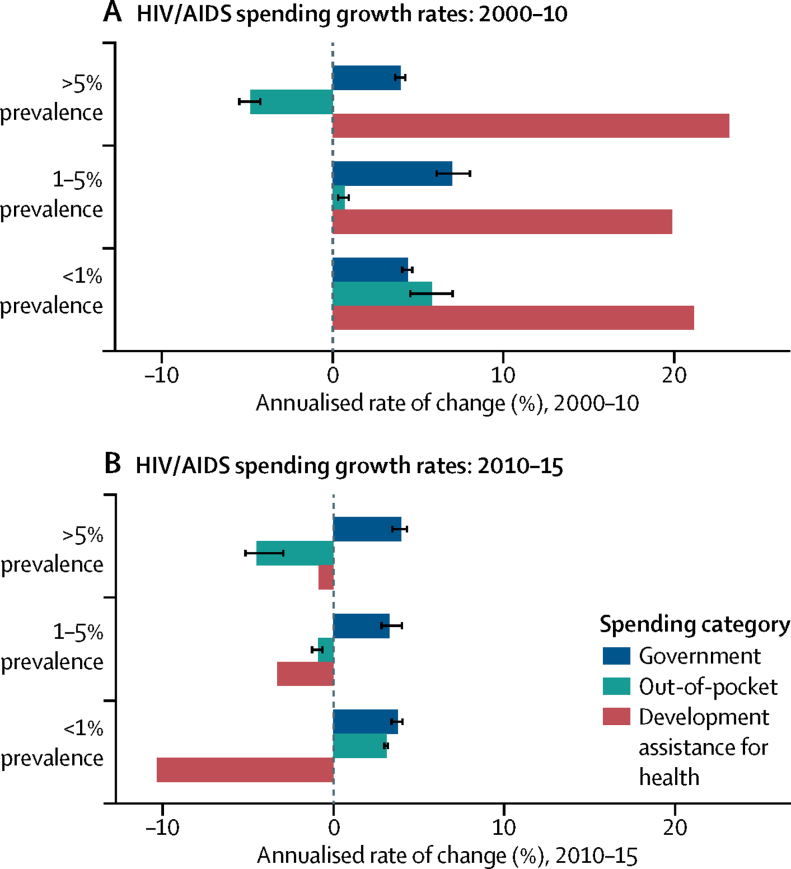
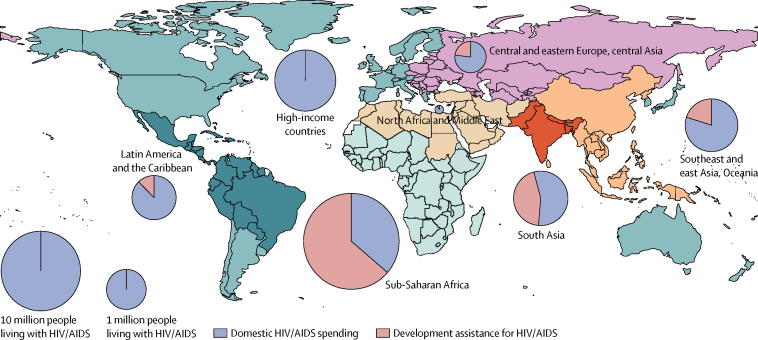
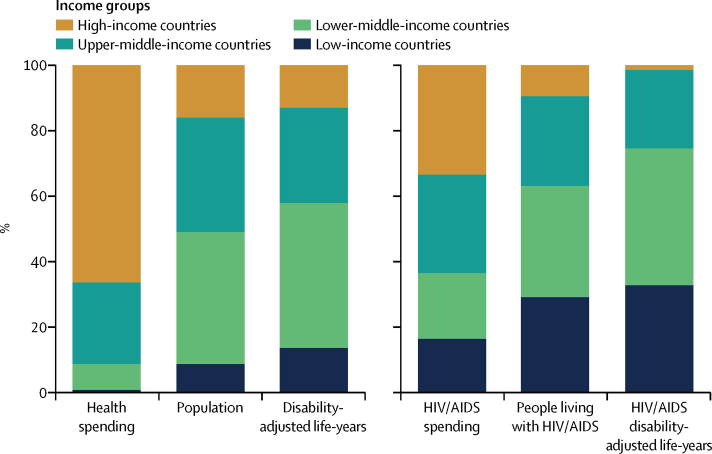
Findings: Between 1995 and 2015, global health spending per capita grew at an annualised rate of 3·1% (95% uncertainty interval [UI] 3·1 to 3·2), with growth being largest in upper-middle-income countries (5·4% per capita [UI 5·3-5·5]) and lower-middle-income countries (4·2% per capita [4·2-4·3]). In 2015, $9·7 trillion (9·7 trillion to 9·8 trillion) was spent on health worldwide. High-income countries spent $6·5 trillion (6·4 trillion to 6·5 trillion) or 66·3% (66·0 to 66·5) of the total in 2015, whereas low-income countries spent $70·3 billion (69·3 billion to 71·3 billion) or 0·7% (0·7 to 0·7). Between 1990 and 2017, development assistance for health increased by 394·7% ($29·9 billion), with an estimated $37·4 billion of development assistance being disbursed for health in 2017, of which $9·1 billion (24·2%) targeted HIV/AIDS. Between 2000 and 2015, $562·6 billion (531·1 billion to 621·9 billion) was spent on HIV/AIDS worldwide. Governments financed 57·6% (52·0 to 60·8) of that total. Global HIV/AIDS spending peaked at 49·7 billion (46·2-54·7) in 2013, decreasing to $48·9 billion (45·2 billion to 54·2 billion) in 2015. That year, low-income and lower-middle-income countries represented 74·6% of all HIV/AIDS disability-adjusted life-years, but just 36·6% (34·4 to 38·7) of total HIV/AIDS spending. In 2015, $9·3 billion (8·5 billion to 10·4 billion) or 19·0% (17·6 to 20·6) of HIV/AIDS financing was spent on prevention, and $27·3 billion (24·5 billion to 31·1 billion) or 55·8% (53·3 to 57·9) was dedicated to care and treatment.
Interpretation: From 1995 to 2015, total health spending increased worldwide, with the fastest per capita growth in middle-income countries. While these national disparities are relatively well known, low-income countries spent less per person on health and HIV/AIDS than did high-income and middle-income countries. Furthermore, declines in development assistance for health continue, including for HIV/AIDS. Additional cuts to development assistance could hasten this decline, and risk slowing progress towards global and national goals.
Funding: The Bill & Melinda Gates Foundation.
Copyright © 2018 The Author(s). Published by Elsevier Ltd. This is an Open Access article under the CC BY 4.0 license. Published by Elsevier Ltd.. All rights reserved.
Figures
Comment in
-
Comparing estimates of spending on health and HIV/AIDS.Lancet. 2018 Nov 3;392(10158):1621-1622. doi: 10.1016/S0140-6736(18)32198-6. Lancet. 2018. PMID: 30496070 No abstract available.
-
Comparing estimates of spending on health and HIV/AIDS - Authors' reply.Lancet. 2018 Nov 3;392(10158):1622. doi: 10.1016/S0140-6736(18)32164-0. Lancet. 2018. PMID: 30496073 No abstract available.
References
-
- Organisation for Economic Co-operation and Development Health: spending continues to outpace economic growth in most OECD countries. http://www.oecd.org/els/health-systems/healthspendingcontinuestooutpacee... (accessed April 10, 2018).
-
- WHO Global Health Expenditure Database. World Health Organization. http://www.who.int/health-accounts/ghed/en/ (accessed April 10, 2018).
-
- UNAIDS NASA country reports. http://www.unaids.org/en/dataanalysis/knowyourresponse/nasacountryreports (accessed April 10, 2018).
-
- Organisation for Economic Co-operation and Development. WHO Guidelines for the implementation of the SHE 2011 framework for accounting health care financing. May 2013. http://www.who.int/health-accounts/documentation/1.1aGuidelinesFinancing... (accessed April 10, 2018).
Publication types
MeSH terms
LinkOut - more resources
Full Text Sources
Other Literature Sources
Medical
