. 2018 Jun;209(2):489-506.
doi: 10.1534/genetics.118.300904. Epub 2018 Apr 20.

Regulation of Cell-to-Cell Communication and Cell Wall Integrity by a Network of MAP Kinase Pathways and Transcription Factors in Neurospora crassa

Affiliations

Regulation of Cell-to-Cell Communication and Cell Wall Integrity by a Network of MAP Kinase Pathways and Transcription Factors in Neurospora crassa

Monika S Fischer et al. Genetics. 2018 Jun.

Abstract

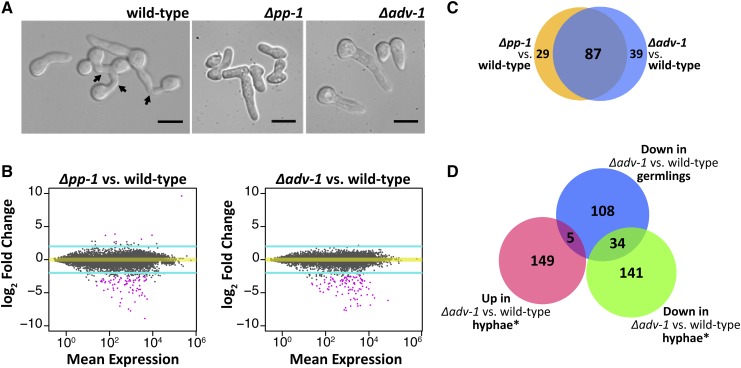
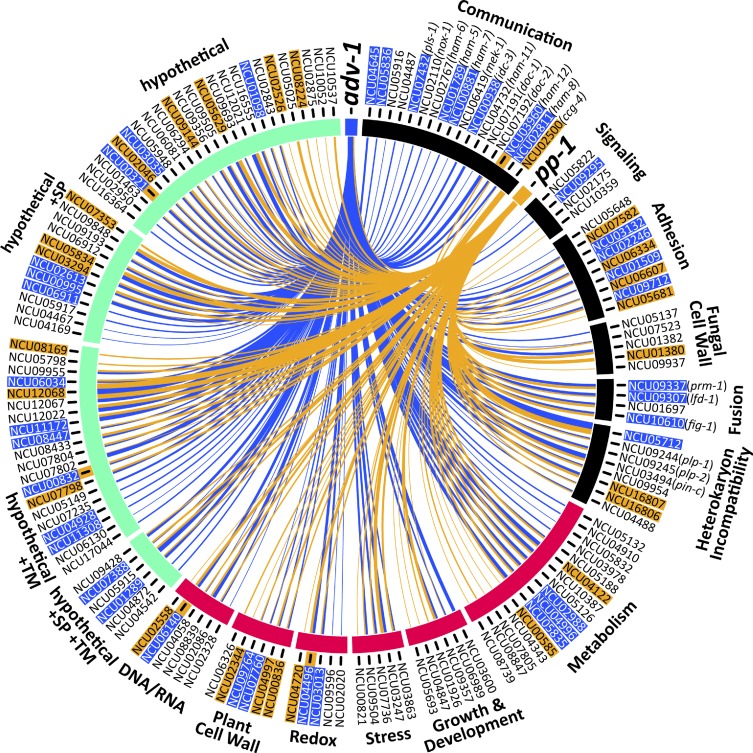
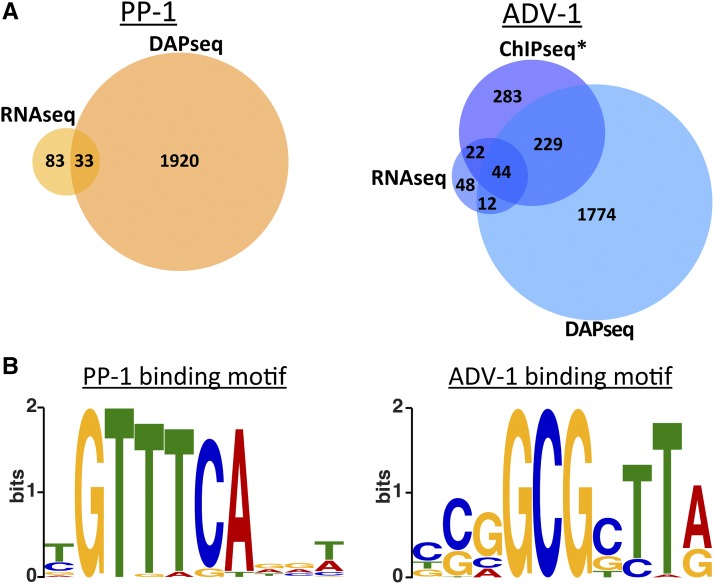
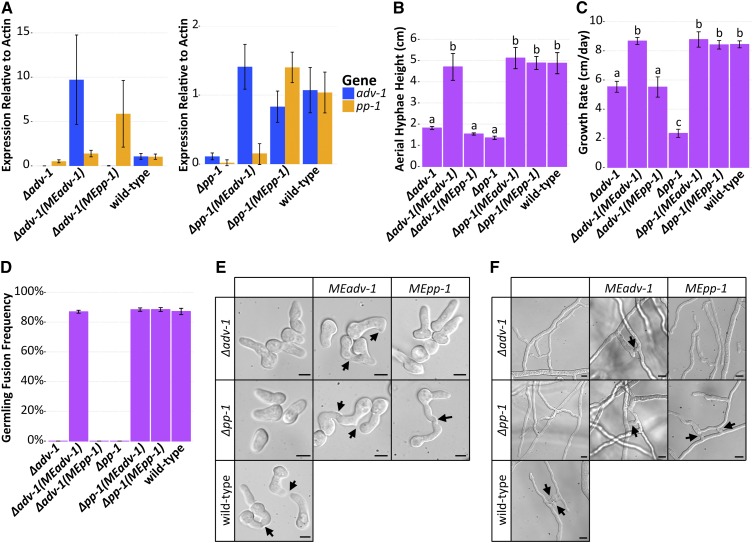
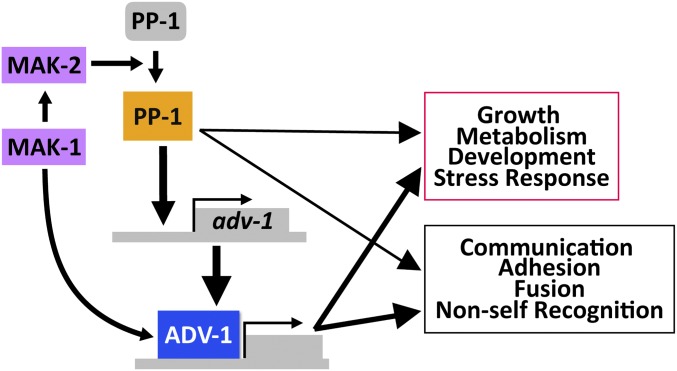
Maintenance of cell integrity and cell-to-cell communication are fundamental biological processes. Filamentous fungi, such as Neurospora crassa, depend on communication to locate compatible cells, coordinate cell fusion, and establish a robust hyphal network. Two MAP kinase (MAPK) pathways are essential for communication and cell fusion in N. crassa: the cell wall integrity/MAK-1 pathway and the MAK-2 (signal response) pathway. Previous studies have demonstrated several points of cross-talk between the MAK-1 and MAK-2 pathways, which is likely necessary for coordinating chemotropic growth toward an extracellular signal, and then mediating cell fusion. Canonical MAPK pathways begin with signal reception and end with a transcriptional response. Two transcription factors, ADV-1 and PP-1, are essential for communication and cell fusion. PP-1 is the conserved target of MAK-2, but it is unclear what targets ADV-1. We did RNA sequencing on Δadv-1, Δpp-1, and wild-type cells and found that ADV-1 and PP-1 have a shared regulon including many genes required for communication, cell fusion, growth, development, and stress response. We identified ADV-1 and PP-1 binding sites across the genome by adapting the in vitro method of DNA-affinity purification sequencing for N. crassa To elucidate the regulatory network, we misexpressed each transcription factor in each upstream MAPK deletion mutant. Misexpression of adv-1 was sufficient to fully suppress the phenotype of the Δpp-1 mutant and partially suppress the phenotype of the Δmak-1 mutant. Collectively, our data demonstrate that the MAK-1/ADV-1 and MAK-2/PP-1 pathways form a tight regulatory network that maintains cell integrity and mediates communication and cell fusion.

Keywords: DAP-seq; MAP kinase; Neurospora crassa; cell fusion; cell-to-cell communication; regulatory networks.


Figures

Figure 1
Figure 1
ADV-1 and PP-1 have a shared regulon in germlings. (A) Microscopic images showing germling morphology at the time point when we extracted RNA for RNA-seq. Arrows indicate fusion events. (B) MA plots summarizing genome-wide RNA-seq data for each transcription factor mutant compared to wild-type. The y-axis represents the log fold change difference in expression (M) between the mutant and wild-type for each gene. The x-axis represents the level of expression for each gene averaged between the mutant and wild-type (A). Turquoise lines denote threshold of 2 < log2 fold change < −2, and pink points indicate genes with significant differential expression (P < 0.01, DESeq2). (C) Number of genes significantly down regulated in each mutant as compared to the wild-type parental strain (consensus between Cuffdiff, EdgeR, and DESeq2, log2 fold change < −2 and adjusted P-value <0.01). The blue circle is Δadv-1 compared to wild-type germlings, and the orange circle is Δpp-1 compared to wild-type germlings. (D) Number of significantly differentially expressed genes in Δadv-1 as compared to the parental wild-type strain in hyphae compared to germlings (−2 > log2 fold change > 2 and P < 0.01, Cuffdiff). *Hyphal data from Table S5 in Dekhang et al. (2017), where RNA-seq data were collected from three different time points (24 hr dark, 24 hr dark + 15 min light, and 24 hr dark + 60 min light). Genes were included if they were differentially expressed during at least one time point. Scale bars=10 μm.
Figure 2
Figure 2
Genes that are positively regulated by ADV-1 and PP-1 in germlings. Circos plot depicting the 155 genes that are significantly downregulated in either Δadv-1 or Δpp-1 germlings as compared to parental wild-type germlings (log2 fold change < −2 and P < 0.01, consensus among Cuffdiff, DESeq2, and EdgeR). Genes are organized based on function that is either known from previous work, or inferred via homology and protein prediction. Gene function is clustered into three major groups: communication and fusion (black), basic cellular processes (magenta), and hypothetical proteins (green). Blue lines indicate genes that are regulated by ADV-1, orange lines indicate genes that are regulated by PP-1, and line thickness is proportional to the fold-change difference in expression between the transcription factor mutant and wild-type germlings. Gene IDs are highlighted to indicate the presence of at least one ADV-1 (blue) or PP-1 (orange) binding site in the promoter region within 2 kb upstream of ATG. Five genes were bound by both ADV-1 and PP-1; these gene IDs are highlighted in blue and have an additional orange highlight immediately adjacent to the gene ID. PP-1 binding sites were determined by consensus between DAP-seq and RNA-seq, and ADV-1 binding sites are the consensus between DAP-seq, RNA-seq, and ChIP-seq data sets. ChIP-seq data are available from Table S3 in Dekhang et al. (2017), in which ChIP-seq was performed at four different time points (24 hr dark, 24 hr dark + 15 min light, 25 hr dark + 30 min light, and 24 hr dark + 60 min light). Genes were included here if they were bound by ADV-1 during at least one time point. This list of 155 genes is significantly enriched for ADV-1 binding sites (P = 0.0004, Fisher’s exact test), but not PP-1 binding sites (P = 0.02, Fisher’s exact test).
Figure 3
Figure 3
DAP-seq identifies promoters bound by ADV-1 or PP-1. (A) Number of genes that are downregulated in Δpp-1 germlings (RNA-seq) or bound by PP-1 (DAP-seq) (left panel). The number of genes that are down regulated in Δadv-1 germlings (RNA-seq) or bound by ADV-1 (DAP-seq and ChIP-seq) (right panel). Downregulated genes were identified by consensus between Cuffdiff, EdgeR, and DESeq2, log2 fold change < −2 and adjusted P-value <0.01 (compare with Figure 1C). Genes bound by each transcription factor were counted if the transcription factor was bound within 2 kb upstream of the ATG (P < 0.001). *ADV-1 ChIP-seq data are available from Table S3 in Dekhang et al. (2017), in which ChIP-seq was performed at four different circadian time points (24 hr dark, 24 hr dark + 15 min light, 24 hr dark + 30 min light, and 24 hr dark + 60 min light). Genes were included here if they were bound by ADV-1 during at least one time point. (B) Consensus DNA binding motif for PP-1 or ADV-1 based on DAP-seq data.
Figure 4
Figure 4
Misexpression of adv-1 suppresses the phenotype of the Δpp-1 mutant. (A) qRT-PCR data showing mRNA expression levels of adv-1 and pp-1 in Δadv-1 (Ptef1-adv-1-v5; his-3 (MEadv-1)) and Δadv-1 (Ptef1-pp-1-v5; his-3 (MEpp-1)) germlings (left panel) and in Δpp-1 (Ptef1-adv-1-v5; his-3 (MEadv-1)) and Δpp-1 (Ptef1-pp1-v5;his-3 (MEpp-1)) germlings (right panel) compared to the wild-type parental strain. (B) Mean height of aerial hyphae of strains in (A) 3 days after inoculation (ANOVA + Tukey HSD, P < 0.0001, n = 6). (C) Mean growth rate per 24 hr of strains in (A) measured over 4 days (ANOVA + Tukey HSD, P < 0.01, n = 3). (D) Mean frequency of communication and fusion between pairs of germlings for each strain in A (n = 3, 400–700 germling pairs counted per sample). For all bar plots, error bars indicate SD. Photos of the (E) germlings (Bar, 5 μm) and (F) hyphae (Bar, 10 μm) are shown for each strain in A. Arrows indicate chemotropic interactions and successful cell fusion. Lowercase letters in panels B and C denote the result of the ANOVA + Tukey HSD statistical tests.
Figure 5
Figure 5
Four ADV-1-regulated genes are required for normal germling fusion and growth. A screen of 110 deletion mutants of the 155 genes regulated by ADV-1 and/or PP-1 revealed that strains carrying mutations in four genes have cell fusion defects. The remaining 151 mutants either have a previously described germling fusion defect, wild-type-like germling fusion phenotype, or homokaryotic deletion mutants are not available in the deletion collection. (A) ΔNCU04487, ΔNCU04645, ΔNCU05836, and ΔNCU05916 mutants showed reduced germling fusion. Mean germling fusion frequency of each mutant and wild type (n = 3, ∼200–400 germling pairs counted per sample). Stars indicate a significant difference compared to the parental wild-type strain (* P = 0.007, *** P < 1E−7, ANOVA + Tukey HSD). (B) Mean height of aerial hyphae of ΔNCU04487, ΔNCU04645, ΔNCU05836, and ΔNCU05916 mutants 3 days after inoculation (ANOVA + Tukey HSD, P < 0.0001, n = 6). (C) Mean growth rate of ΔNCU04487, ΔNCU04645, ΔNCU05836, and ΔNCU05916 mutants per day measured over 4 days (ANOVA + Tukey HSD, P < 0.01, n = 2). For all bar plots, error bars indicate SD. Lowercase letters in panels B and C denote the result of the ANOVA + Tukey HSD statistical tests.
Figure 6
Figure 6
ChIP-PCR identifies a PP-1 binding site ∼500 bp upstream of the adv-1 ORF. (A) Diagram of predicted PP-1 binding sites within 1.5 kb upstream of adv-1 ORF, based on the motif depicted in Figure 2B. Arrows indicate 10 different PCR primer sets used to interrogate immunoprecipitated chromatin. (B) Agarose DNA gel showing results of ChIP-PCR with primer set #4. The remaining PCR results are included in Figure S5. Immunoprecipitation with Δpp-1(Ptef1-pp-1-v5; his-3) and Δpp-1(Pccg1-pp-1-gfp; his-3) strains was performed using α-V5 or α-GFP antibodies. α-mouse antibodies were used as a negative control. Whole-cell lysate and independent N. crassa genomic DNA were included as positive PCR controls, with a PCR reaction lacking DNA as an additional negative control. (C) The sequence of the PCR product in B. Primers highlighted in yellow correspond to primer set #4 in A, and predicted PP-1 binding sites are in red.
Figure 7
Figure 7
Misexpression of adv-1 suppresses the growth phenotype of the Δmak-1 mutant. (A) qRT-PCR data showing mRNA expression levels of adv-1 and pp-1 in Δmak-1 (Ptef1-adv-1-v5; his-3 (MEadv-1)), Δmak-1 (Ptef1-pp-1-v5; his-3 (MEpp-1)), Δmak-2 (Ptef1-adv-1-v5; his-3 (MEadv-1)), and Δmak-2 (Pccg1-pp-1-gfp; his-3 (MEpp-1)) strains compared to Δmak-1, Δmak-2, and wild-type cells. (B) Mean height of aerial hyphae of strains in A 3 days after inoculation (ANOVA + Tukey HSD, *** P = 3.6E−8, n = 6). (C) Mean growth rate per day of strains in A measured over 4 days (ANOVA + Tukey HSD, P < 0.01, n = 3). For all bar plots, error bars indicate SD. (D) Colony morphology of the Δmak-1 mutant relative to the wild-type strain and the Δmak-1 (Ptef1-adv-1-v5; his-3 (MEadv-1)) and Δmak-1 (Ptef1-pp-1-v5; his-3 (MEpp-1)) strains. Photos showing a lack of (E) germling fusion (Bar, 5 μm) or (F) hyphal fusion (Bar, 10 μm) for each of the strains shown in A. Arrows indicate chemotropic interactions in the wild-type strain. Plates shown in D are 8 cm in diameter.
Figure 8
Figure 8
Misexpression of adv-1 restores resistance to cell wall stress agents in Δpp-1 and Δmak-1 cells. A 1:5 serial dilution from ∼5000 spores per spot to ∼8 spores per spot was performed on Δpp-1 (Ptef1-adv-1-v5; his-3 (MEadv-1)), Δpp-1 (Ptef1-pp-1-v5; his-3 (MEpp-1)), Δmak-2 (Ptef1-adv-1-v5; his-3 (MEadv-1)), Δmak-2 (Pccg1-pp-1-gfp; his-3 (MEpp-1)), Δadv-1 (Ptef1-adv-1-v5; his-3 (MEadv-1)), Δadv-1 (Ptef1-pp-1-v5; his-3 (MEpp-1)), Δmak-1 (Ptef1-adv-1-v5; his-3 (MEadv-1)), and Δmak-1 (Ptef1-pp-1-v5; his-3 (MEpp-1)) cells compared to Δpp-1, Δadv-1, Δmak-1, Δmak-2, and wild-type cells. All agar media contains VMM and FGS to force colonial growth. Plates were incubated at 30° for 5 days. Drug concentrations: 1.3 μg/ml Caspofungin, 1.5 mg/ml Calcofluor White, and 1 mg/ml Congo Red.
Figure 9
Figure 9
Model for transcriptional regulation by MAK-1, MAK-2, PP-1, and ADV-1. MAK-1 activates both MAK-2- and ADV-1-dependent transcription. MAK-2 activates or derepresses PP-1, which is necessary for transcription of adv-1 and other downstream genes (inactivated PP-1 is gray, activated PP-1 is orange). PP-1 directly binds and regulates transcription of adv-1; ADV-1 is the direct transcriptional activator of many of the genes required for cell-to-cell communication, cell fusion, growth, development, and metabolism. Additionally, PP-1 and ADV-1 are important for mediating the cell wall stress response downstream of both MAK-1 and MAK-2. While our data indicates that ADV-1 is the primary regulatory for many downstream genes, PP-1 also contributes to the transcription of some of these genes independently of adv-1. Downstream gene groups are boxed with colors (magenta or black) that match the colors detailing the same groups in Figure 2.

Similar articles

Cited by

References

    1. Barabási A. L., Oltvai Z. N., 2004. Network biology: understanding the cell’s functional organization. Nat. Rev. Genet. 5: 101–113. 10.1038/nrg1272 - DOI - PubMed
    1. Bastiaans E., Debets A. J., Aanen D. K., 2015. Experimental demonstration of the benefits of somatic fusion and the consequences for allorecognition. Evolution 69: 1091–1099. 10.1111/evo.12626 - DOI - PubMed
    1. Beier A., Teichert I., Krisp C., Wolters D. A., Kück U., 2016. Catalytic subunit 1 of protein phosphatase 2A is a subunit of the STRIPAK complex and governs fungal sexual development. MBio 7: e00870–16 10.1128/mBio.00870-16 - DOI - PMC - PubMed
    1. Bennett L. D., Beremand P., Thomas T. L., Bell-Pedersen D., 2013. Circadian activation of the mitogen-activated protein kinase MAK-1 facilitates rhythms in clock-controlled genes in Neurospora crassa. Eukaryot. Cell 12: 59–69. 10.1128/EC.00207-12 - DOI - PMC - PubMed
    1. Bernhards Y., Pöggeler S., 2011. The phocein homologue SmMOB3 is essential for vegetative cell fusion and sexual development in the filamentous ascomycete Sordaria macrospora. Curr. Genet. 57: 133–149. 10.1007/s00294-010-0333-z - DOI - PMC - PubMed

Publication types

MeSH terms