

The Receptor-Like Kinase AtVRLK1 Regulates Secondary Cell Wall Thickening
- PMID: 29678858
- PMCID: PMC6001334
- DOI: 10.1104/pp.17.01279
The Receptor-Like Kinase AtVRLK1 Regulates Secondary Cell Wall Thickening
Abstract
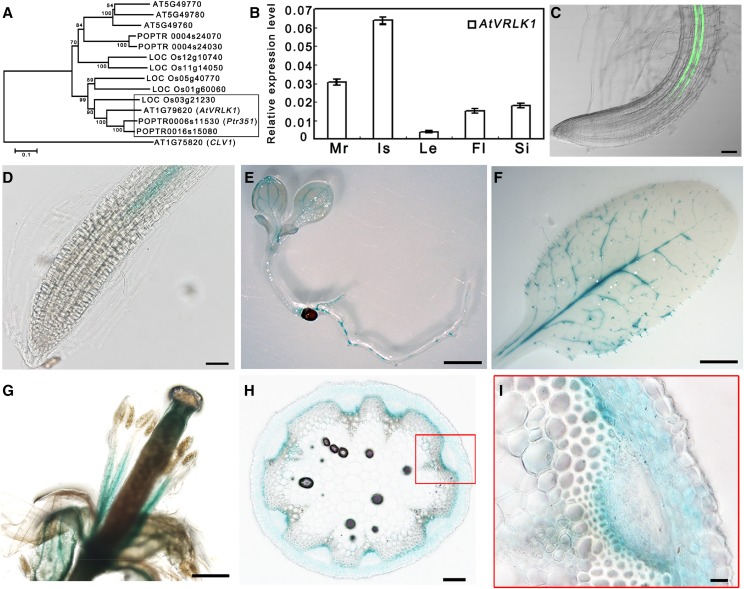
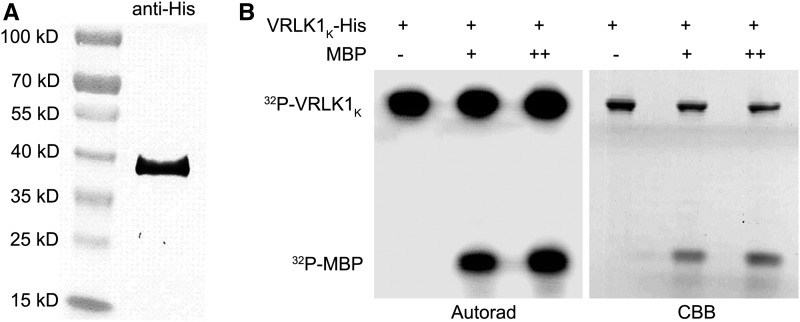
During the growth and development of land plants, some specialized cells, such as tracheary elements, undergo secondary cell wall thickening. Secondary cell walls contain additional lignin, compared with primary cell walls, thus providing mechanical strength and potentially improving defenses against pathogens. However, the molecular mechanisms that initiate wall thickening are unknown. In this study, we identified an Arabidopsis (Arabidopsis thaliana) leucine-rich repeat receptor-like kinase, encoded by AtVRLK1 (Vascular-Related Receptor-Like Kinase1), that is expressed specifically in cells undergoing secondary cell wall thickening. Suppression of AtVRLK1 expression resulted in a range of phenotypes that included retarded early elongation of the inflorescence stem, shorter fibers, slower root growth, and shorter flower filaments. In contrast, up-regulation of AtVRLK1 led to longer fiber cells, reduced secondary cell wall thickening in fiber and vessel cells, and defects in anther dehiscence. Molecular and cellular analyses showed that down-regulation of AtVRLK1 promoted secondary cell wall thickening and up-regulation of AtVRLK1 enhanced cell elongation and inhibited secondary cell wall thickening. We propose that AtVRLK1 functions as a signaling component in coordinating cell elongation and cell wall thickening during growth and development.
© 2018 American Society of Plant Biologists. All rights reserved.
Figures


Similar articles
-
The NAC transcription factors NST1 and NST2 of Arabidopsis regulate secondary wall thickenings and are required for anther dehiscence.Plant Cell. 2005 Nov;17(11):2993-3006. doi: 10.1105/tpc.105.036004. Epub 2005 Oct 7. Plant Cell. 2005. PMID: 16214898 Free PMC article.
-
A novel F-box protein represses endothecial secondary wall thickening for anther dehiscence in Arabidopsis thaliana.J Plant Physiol. 2012 Jan 15;169(2):212-6. doi: 10.1016/j.jplph.2011.09.006. Epub 2011 Oct 21. J Plant Physiol. 2012. PMID: 22018967
-
A cystathionine-β-synthase domain-containing protein, CBSX2, regulates endothecial secondary cell wall thickening in anther development.Plant Cell Physiol. 2013 Feb;54(2):195-208. doi: 10.1093/pcp/pcs166. Epub 2012 Dec 6. Plant Cell Physiol. 2013. PMID: 23220733
-
The Arabidopsis wood model-the case for the inflorescence stem.Plant Sci. 2013 Sep;210:193-205. doi: 10.1016/j.plantsci.2013.05.007. Epub 2013 May 21. Plant Sci. 2013. PMID: 23849126 Review.
-
IDA: a peptide ligand regulating cell separation processes in Arabidopsis.J Exp Bot. 2013 Dec;64(17):5253-61. doi: 10.1093/jxb/ert338. Epub 2013 Oct 22. J Exp Bot. 2013. PMID: 24151306 Review.
Cited by
-
Genome-wide association study of drought tolerance and biomass allocation in wheat.PLoS One. 2019 Dec 4;14(12):e0225383. doi: 10.1371/journal.pone.0225383. eCollection 2019. PLoS One. 2019. PMID: 31800595 Free PMC article.
-
The Cytoskeleton and Its Role in Determining Cellulose Microfibril Angle in Secondary Cell Walls of Woody Tree Species.Plants (Basel). 2020 Jan 10;9(1):90. doi: 10.3390/plants9010090. Plants (Basel). 2020. PMID: 31936868 Free PMC article. Review.
-
Genome-Wide Investigation and Co-Expression Network Analysis of SBT Family Gene in Gossypium.Int J Mol Sci. 2023 Mar 17;24(6):5760. doi: 10.3390/ijms24065760. Int J Mol Sci. 2023. PMID: 36982835 Free PMC article.
-
SUMO modification of LBD30 by SIZ1 regulates secondary cell wall formation in Arabidopsis thaliana.PLoS Genet. 2019 Jan 18;15(1):e1007928. doi: 10.1371/journal.pgen.1007928. eCollection 2019 Jan. PLoS Genet. 2019. PMID: 30657769 Free PMC article.
-
Resequencing of global Tartary buckwheat accessions reveals multiple domestication events and key loci associated with agronomic traits.Genome Biol. 2021 Jan 12;22(1):23. doi: 10.1186/s13059-020-02217-7. Genome Biol. 2021. PMID: 33430931 Free PMC article.
References
-
- Barber MS, Bertram RE, Ride JP (1989) Chitin oligosaccharides elicit lignification in wounded wheat leaves. Physiol Mol Plant Pathol 34: 3–12
-
- Cabrera JC, Messiaen J, Cambier P, Van Cutsem P (2006) Size, acetylation and concentration of chitooligosaccharide elicitors determine the switch from defence involving PAL activation to cell death and water peroxide production in Arabidopsis cell suspensions. Physiol Plant 127: 44–56
-
- Clough SJ, Bent AF (1998) Floral dip: a simplified method for Agrobacterium-mediated transformation of Arabidopsis thaliana. Plant J 16: 735–743 - PubMed
-
- Decreux A, Messiaen J (2005) Wall-associated kinase WAK1 interacts with cell wall pectins in a calcium-induced conformation. Plant Cell Physiol 46: 268–278 - PubMed
Publication types
MeSH terms
Substances
LinkOut - more resources
Full Text Sources
Other Literature Sources
Molecular Biology Databases
