. 2018 May 16;38(20):4749-4761.
doi: 10.1523/JNEUROSCI.3628-17.2018. Epub 2018 Apr 20.

Rapid Disinhibition by Adjustment of PV Intrinsic Excitability during Whisker Map Plasticity in Mouse S1

Affiliations

Rapid Disinhibition by Adjustment of PV Intrinsic Excitability during Whisker Map Plasticity in Mouse S1

Melanie A Gainey et al. J Neurosci. .

Abstract

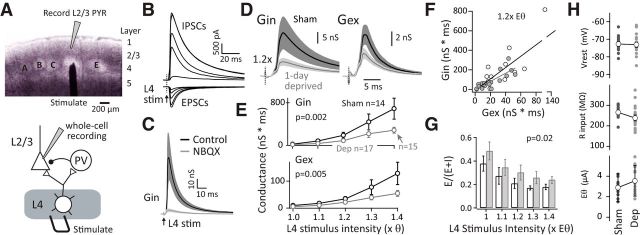
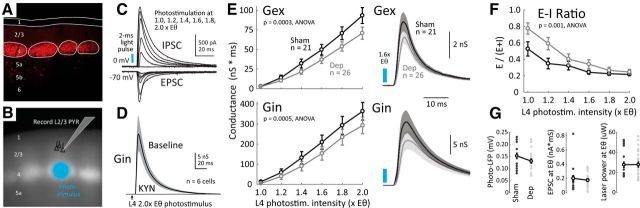
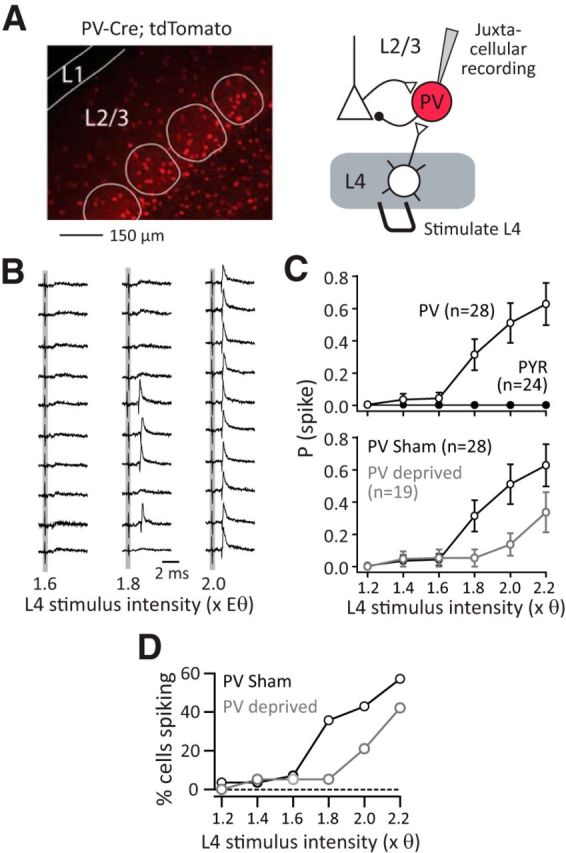
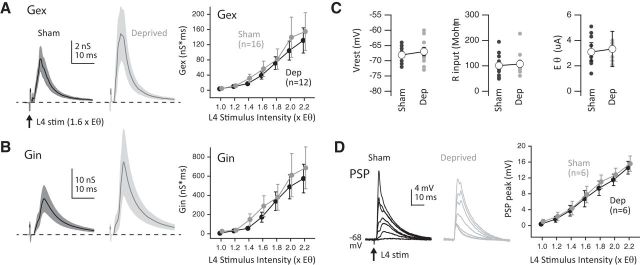
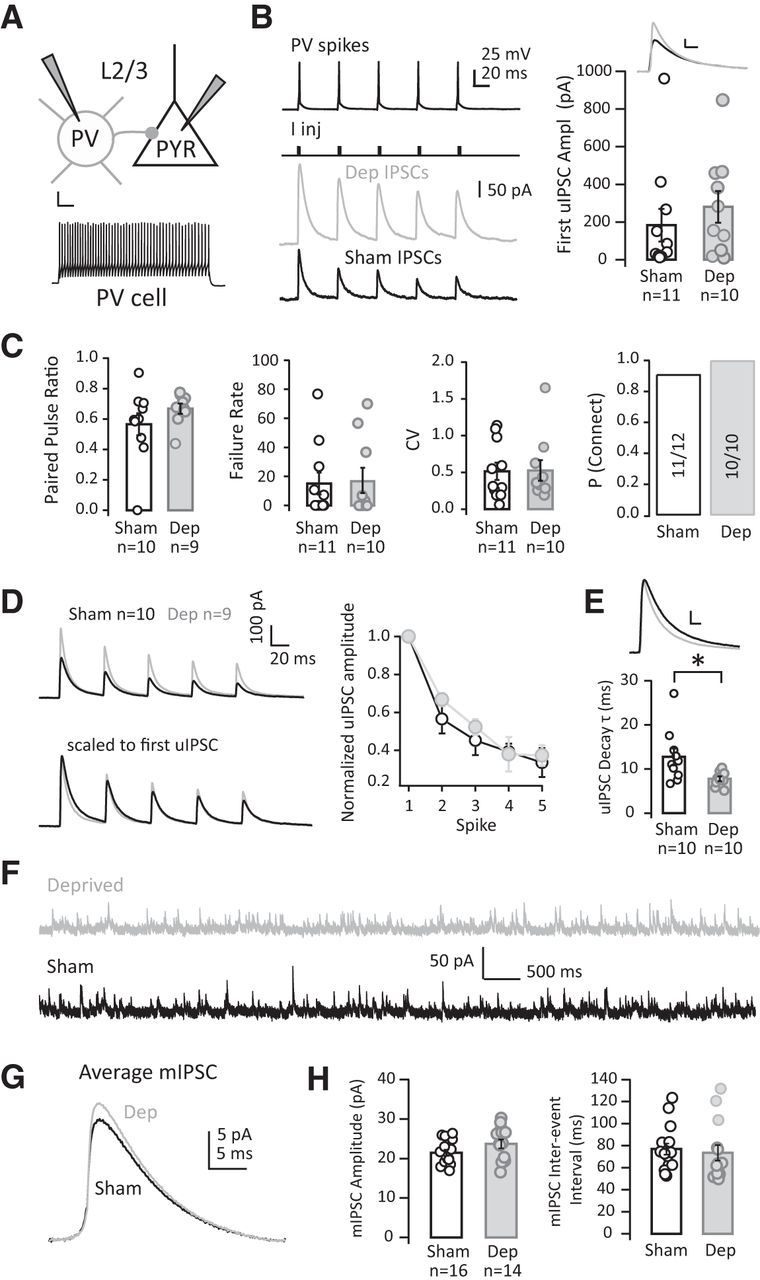
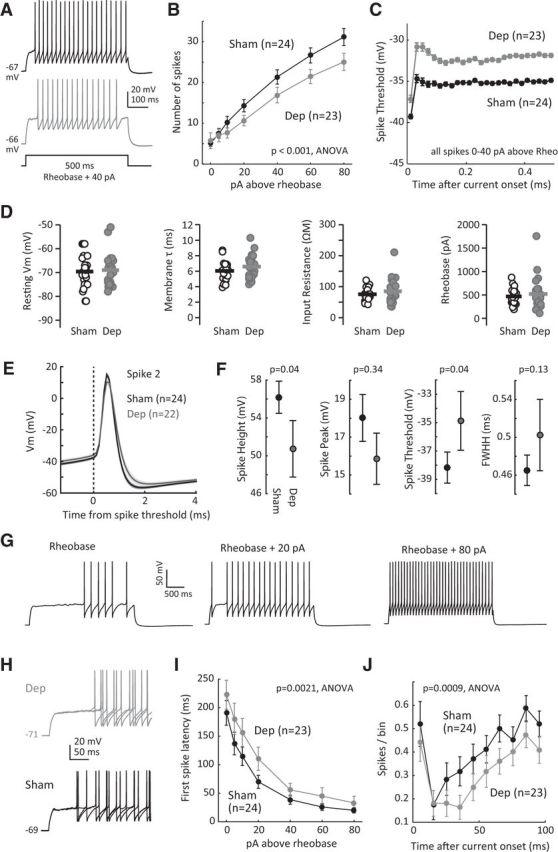
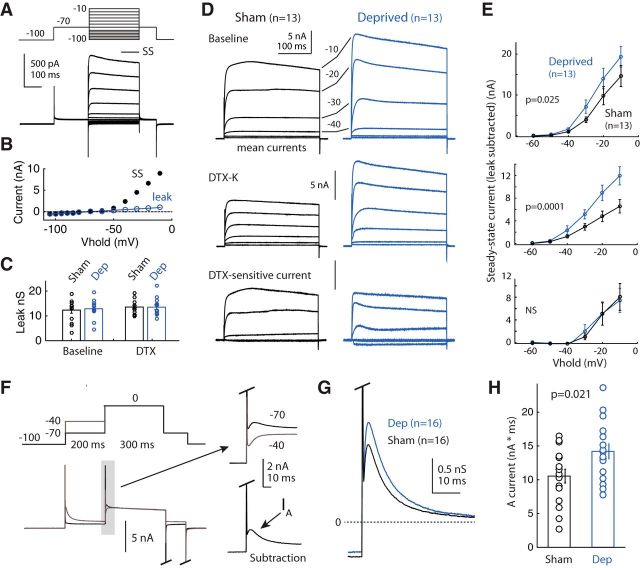
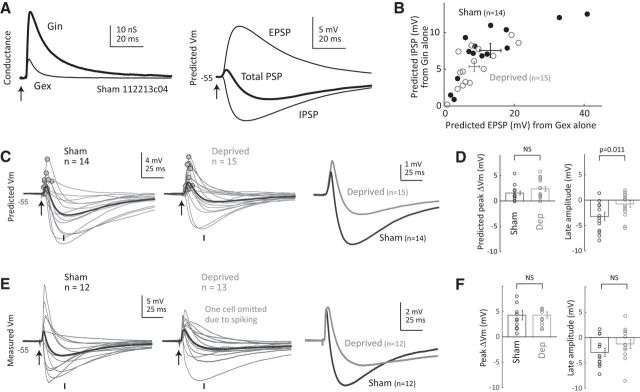
Rapid plasticity of layer (L) 2/3 inhibitory circuits is an early step in sensory cortical map plasticity, but its cellular basis is unclear. We show that, in mice of either sex, 1 d whisker deprivation drives the rapid loss of L4-evoked feedforward inhibition and more modest loss of feedforward excitation in L2/3 pyramidal (PYR) cells, increasing the excitation-inhibition conductance ratio. Rapid disinhibition was due to reduced L4-evoked spiking by L2/3 parvalbumin (PV) interneurons, caused by reduced PV intrinsic excitability. This included elevated PV spike threshold, which is associated with an increase in low-threshold, voltage-activated delayed rectifier (presumed Kv1) and A-type potassium currents. Excitatory synaptic input and unitary inhibitory output of PV cells were unaffected. Functionally, the loss of feedforward inhibition and excitation was precisely coordinated in L2/3 PYR cells, so that peak feedforward synaptic depolarization remained stable. Thus, the rapid plasticity of PV intrinsic excitability offsets early weakening of excitatory circuits to homeostatically stabilize synaptic potentials in PYR cells of sensory cortex.SIGNIFICANCE STATEMENT Inhibitory circuits in cerebral cortex are highly plastic, but the cellular mechanisms and functional importance of this plasticity are incompletely understood. We show that brief (1 d) sensory deprivation rapidly weakens parvalbumin (PV) inhibitory circuits by reducing the intrinsic excitability of PV neurons. This involved a rapid increase in voltage-gated potassium conductances that control near-threshold spiking excitability. Functionally, the loss of PV-mediated feedforward inhibition in L2/3 pyramidal cells was precisely balanced with the separate loss of feedforward excitation, resulting in a net homeostatic stabilization of synaptic potentials. Thus, rapid plasticity of PV intrinsic excitability implements network-level homeostasis to stabilize synaptic potentials in sensory cortex.

Keywords: PV neuron; feedforward inhibition; homeostasis; intrinsic excitability; plasticity; sensory cortex.


Figures

Figure 1.
Figure 1.
One day of deprivation weakens L4-evoked inhibition and increases the E–I conductance ratio in L2/3 PYR cells. A, Top, S1 slice with stimulating electrode in L4 of D barrel and a schematic recording electrode. Bottom, Circuit for L4–L2/3 feedforward excitation and inhibition. B, L4-evoked IPSCs and EPSCs in an example L2/3 PYR cell. Increasing currents are responses to L4 stimulation at 1.0–1.4× Eθ. C, Mean L4-evoked Gin at 1.4× Eθ before and after NBQX application (n = 6 cells). Shading is the SEM. D, Mean L4-evoked Gin and Gex waveforms at 1.2× Eθ across all sham (n = 14) and deprived (n = 17) cells. Shading is the SEM. E, Input–output curves for integrated Gin and Gex with increasing L4 stimulation intensity. Points are the mean ± SEM. Two deprived cells showed unclamped action currents at 1.4× Eθ at Vhold = 0 mV, and were therefore omitted from Gin analysis at 1.4× Eθ. The p values are for sham vs deprived factor in two-way ANOVA. F, Left, Within-cell comparison of Gex vs Gin at 1.2× Eθ. Each point is a cell. Lines are linear regression for sham (black) and deprived (gray). G, E–I conductance ratio, quantified as Gex/(Gex + Gin), across stimulus intensities. Bars shown are the mean ± SEM, as in all subsequent figures. The p value is sham vs deprived factor in two-way ANOVA. H, Vrest, Rinput, and Eθ for each cell (dots) and population mean (open circle).
Figure 2.
Figure 2.
Optogenetically evoked L4–L2/3 excitatory and inhibitory conductances in L2/3 PYR cells are reduced by deprivation. A, Histological section of S1 from Scnn1a-Tg3-cre mouse injected with AAV2.9-CAGGS-flex-tdTom. tdTomato signal (red) is restricted to L4, except for a few L5 neurons. White outlines are L4 barrels. B, Live fluorescence image during a physiology experiment of slice from a mouse injected with flex-ChR2-tdTom virus. Bright signal is ChR2-tdTomato in L4 soma and axons. Schematic shows photostimulation spot in L4 and whole-cell recording in L2/3 of the D column. C, Photo-evoked IPSCs and EPSCs in an example L2/3 PYR cell. Increasing currents are responses to L4 optogenetic stimulation at 1.0–2.0× Eθ. D, Mean IPSC (n = 6 cells) is completely blocked by bath application of kynurenic acid. E, Left, Mean input–output curves for L4-evoked Gex and Gin with increasing photostimulus intensity. Points are the mean ± SEM. The p values are for sham vs deprived factor in two-factor ANOVA on log-transformed data. Right, Mean conductance waveforms at 1.6× Eθ. F, E–I conductance ratio across stimulation intensities, quantified as Gex/(Gex + Gin). G, Sham and deprived groups did not differ in photo-LFP amplitude (measured in L4 at 1.6× Eθ), EPSC at Eθ, or laser power at Eθ. Each dot is a cell, open circles are the population mean ± SEM.
Figure 3.
Figure 3.
Deprivation reduces L4-evoked spiking of L2/3 PV cells. A, Left, Fluorescent PV cells in an S1 slice from PV-Cre/TdTomato mouse. White, L4 barrels. Right, Schematic of cell-attached recording of L4-evoked spikes in L2/3 PV neurons. B, Example spiking data from one PV neuron. Ten sweeps at three stimulation intensities are shown. Gray, Stimulus artifact. C, Mean spike probability for PV and PYR neurons from sham mice (top), and for PV neurons in sham vs deprived mice (bottom). D, Fraction of PV cells spiking in sham vs deprived mice.
Figure 4.
Figure 4.
L4-evoked synaptic input to L2/3 PV cells remains normal during deprivation. A, Mean L4-evoked excitatory synaptic conductance in sham and deprived mice. Left, Mean Gex waveform at 1.6× stimulation intensity. Right, Mean integrated Gex across stimulus intensities. Shaded regions and bars are the SEM. B, Mean L4-evoked inhibitory synaptic conductance. Conventions are as in A. Curves are displaced slightly along the x-axis for readability. C, Vrest, Rinput, and Eθ for L2/3 PV cells in the experiments in A and B. D, Left, L4-evoked PSPs in two example PV cells at 1.0, 1.2,…, 2.2× Eθ. Right, Mean PSP peak above −68 mV baseline Vm, for all PV cells in sham vs deprived mice. One cell in each group spiked beginning at 1.8× Eθ.
Figure 5.
Figure 5.
Unitary PV → PYR IPSCs and mIPSCs on L2/3 PYR cells. A, Schematic for PV → PYR paired recordings. Bottom, Example presynaptic PV spike train. Calibration: 20 mV, 50 ms. B, Left, Presynaptic PV spike train and example uIPSCs evoked in one deprived and one sham PYR cell. Iinj, Current injection to evoke presynaptic spikes. Right, Mean uIPSC1 waveform and amplitude for all sham and deprived pairs. Each dot is one pair. C, Paired-pulse ratio (uIPSC2/uIPSC1), uIPSC1 failure rate, uIPSC1 CV, and the probability of connected pairs. Each dot is one pair. D, Left, Population mean uIPSC train for sham and deprived pairs (top), normalized to the first uIPSC peak (bottom). Deprived pairs showed no evidence of uIPSC weakening, and a nonsignificant trend toward uIPSC strengthening, with no change in short-term plasticity during the train (right). E, Mean uIPSC1 across all cells and analysis of decay τ. Each dot is one pair. F, Example mIPCSs recorded at 0 mV in one sham and one deprived L2/3 PYR cell. G, Mean mIPSC waveform (n = 16 sham, n = 14 deprived cells). H, mIPSC amplitude and IEI for sham and deprived cells. Each circle is one cell.
Figure 6.
Figure 6.
Deprivation causes a reduction in the intrinsic excitability of L2/3 PVs. A, Spike trains for example sham (top) and deprived (bottom) L2/3 PV cells to current injection at 40 pA above rheobase. B, Mean F–I curve for spiking in sham and deprived PV cells. Symbols show the mean ± SEM. C, Mean spike threshold, for all spikes recorded at 0–40 pA above rheobase, in 20 ms time bins. Many PV cells exhibit a rapid-onset first spike with systematically lower threshold (first point, see example in G). D, Resting properties and rheobase for each PV cell. Bars are means. E, Mean shape of second spike at 80 pA above rheobase, across all cells. Shaded regions are ±SEM. F, Quantification of spike shape for spikes at 80 pA above rheobase. The p values are from two-tailed t tests. G, Spike trains for an example PV cell showing delayed spike onset at rheobase. H, Spiking of an example sham (bottom) and deprived (top) PV cell at 5 pA above rheobase, showing longer spike latency in the deprived cell. I, Mean first-spike latency in sham and deprived cells. J, Mean spike probability in 10 ms bins after current injection onset (20–80 pA above rheobase). The p values in I and J are for sham vs deprived factor in two-way ANOVA.
Figure 7.
Figure 7.
Deprivation upregulates voltage-activated K currents in L2/3 PV cells. A, Voltage-clamp protocol to measure delayed rectifier K currents, and example currents from one PV neuron in a sham mouse. SS, Steady-state current analysis window. B, I–V curve for SS and leak current for cells in A. C, Leak conductance in sham and deprived cells, during baseline and DTX conditions. D, Mean current waveforms across sham and deprived PV cells at −60 to −10 mV Vhold, measured at baseline and under DTX conditions (top and middle), and the calculated DTX-sensitive current (bottom). E, I–V plots for leak-subtracted steady-state current across cells, for each condition in D. Pronounced currents activate at −40 to −50 mV. The p values are for sham vs deprived factor in two-way ANOVA. F, Voltage protocol for isolating IA. IA was measured at 0 mV by subtracting currents with a −40 mV 200 ms prestep (which inactivates IA) from currents with a −70 mV preset (which does not inactivate IA). Traces show an example cell. G, Mean IA waveform from sham and deprived cells. H, IA magnitude (integrated over first 25 ms) for sham and deprived cells. Each circle is one cell. Bars show the mean ± SEM.
Figure 8.
Figure 8.
Changes in Gex and Gin are coordinated to maintain stable peak PSP amplitude in L2/3 PYR cells. A, Example neuron showing measured L4-evoked Gex and Gin conductance waveforms (left) and predicted PSPs from a baseline Vm of −55 mV (right). PSPs were predicted from Gex alone (EPSP), Gin alone (IPSP), or from both Gex and Gin together (total PSP). B, Peak predicted EPSP (from Gex alone) and IPSP (from Gin alone) at 1.4× Eθ in each sham and deprived cell from Figure 1. Error bars are the mean ± SEM for sham and deprived populations. C, Predicted total PSP for each sham and deprived neuron, and population means (thick). Arrow, L4 stimulus. Dots, PSP peaks. Vertical tick, Analysis time for late inhibition. Right, Population mean PSPs calculated from peak-aligned PSPs in individual cells. D, Quantification of changes in predicted peak PSP and late inhibition following deprivation. E, Real L4-evoked PSPs measured in sham and deprived L2/3 PYR neurons from an estimated baseline synaptic Vm of −55 mV. Thick lines, Population means. One deprived cell was omitted because it spiked. Right, Population mean PSPs calculated from peak-aligned PSPs in individual cells. F, Quantification of deprivation effects on peak PSP and late amplitude during the IPSP.

Similar articles

Cited by

References

    1. Adesnik H, Scanziani M (2010) Lateral competition for cortical space by layer-specific horizontal circuits. Nature 464:1155–1160. 10.1038/nature08935 - DOI - PMC - PubMed
    1. Allen CB, Celikel T, Feldman DE (2003) Long-term depression induced by sensory deprivation during cortical map plasticity in vivo. Nat Neurosci 6:291–299. 10.1038/nn1012 - DOI - PubMed
    1. Barnes SJ, Sammons RP, Jacobsen RI, Mackie J, Keller GB, Keck T (2015) Subnetwork-specific homeostatic plasticity in mouse visual cortex in vivo. Neuron 86:1290–1303. 10.1016/j.neuron.2015.05.010 - DOI - PMC - PubMed
    1. Barth AL, Poulet JF (2012) Experimental evidence for sparse firing in the neocortex. Trends Neurosci 35:345–355. 10.1016/j.tins.2012.03.008 - DOI - PubMed
    1. Breton JD, Stuart GJ (2009) Loss of sensory input increases the intrinsic excitability of layer 5 pyramidal neurons in rat barrel cortex. J Physiol 587:5107–5119. 10.1113/jphysiol.2009.180943 - DOI - PMC - PubMed

Publication types

MeSH terms

Substances