. 2018 Apr 20;9(1):1576.
doi: 10.1038/s41467-018-03889-3.

Nucleus accumbens controls wakefulness by a subpopulation of neurons expressing dopamine D1 receptors

Affiliations

Nucleus accumbens controls wakefulness by a subpopulation of neurons expressing dopamine D1 receptors

Yan-Jia Luo et al. Nat Commun. .

Abstract

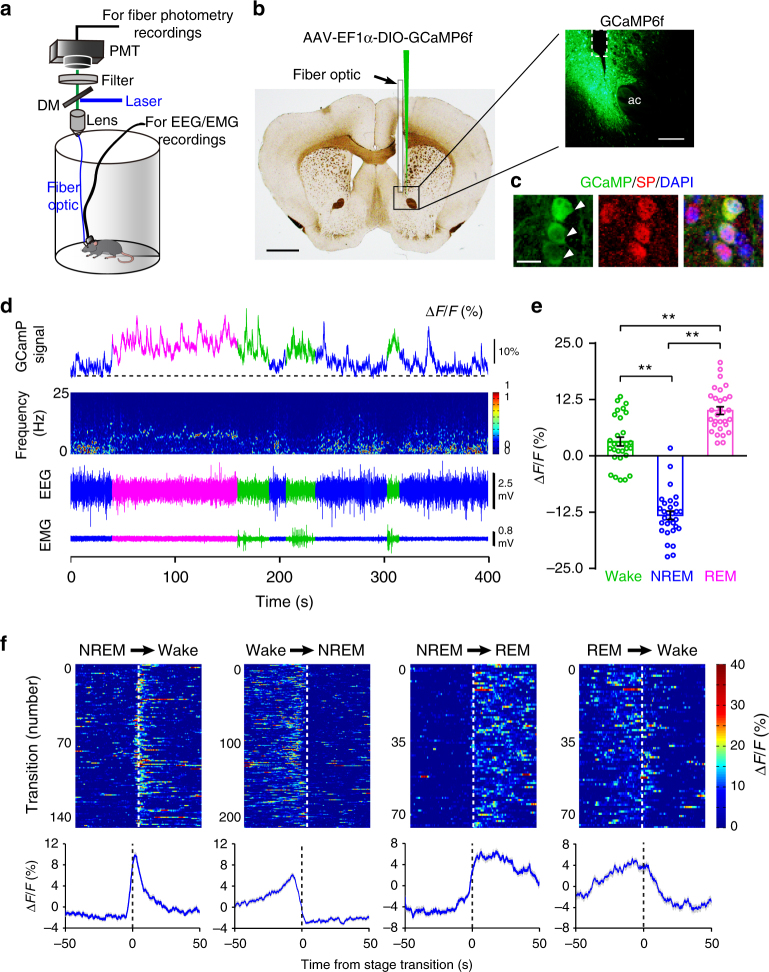
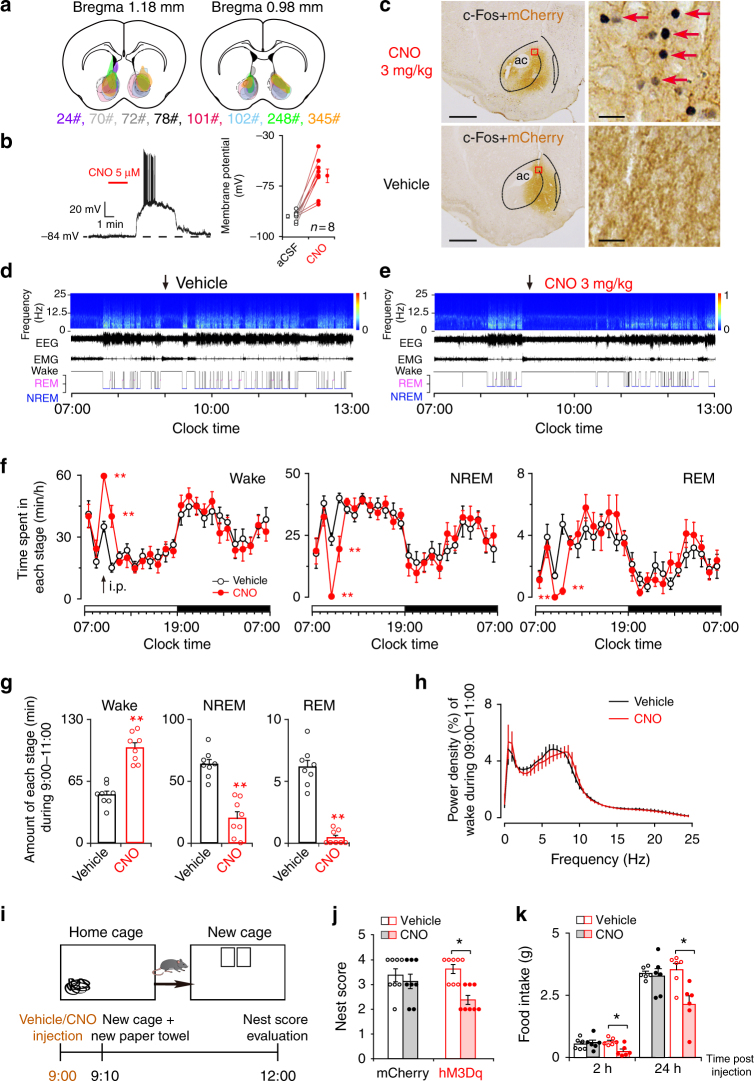
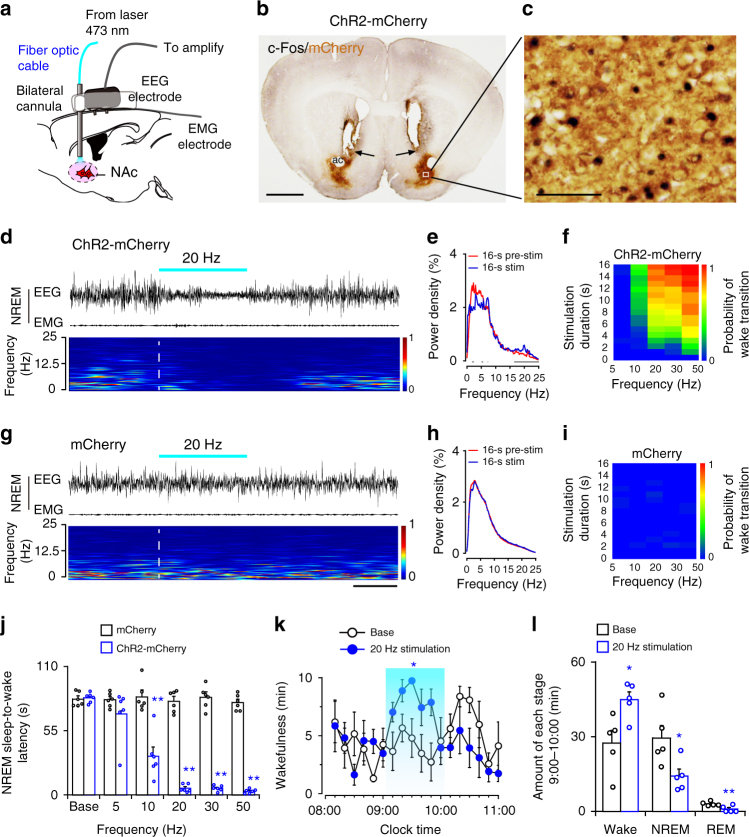
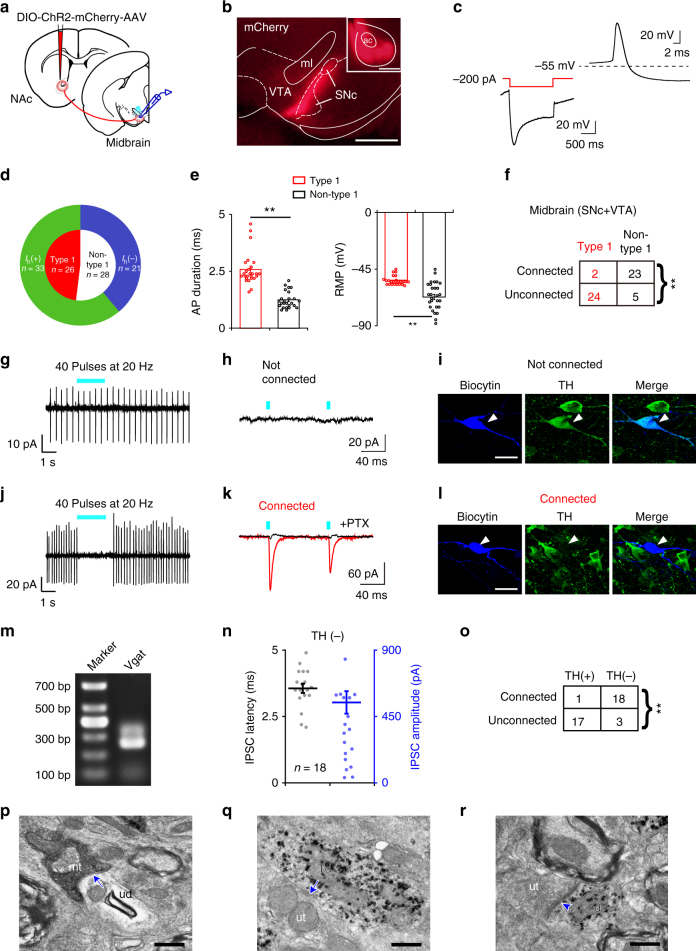
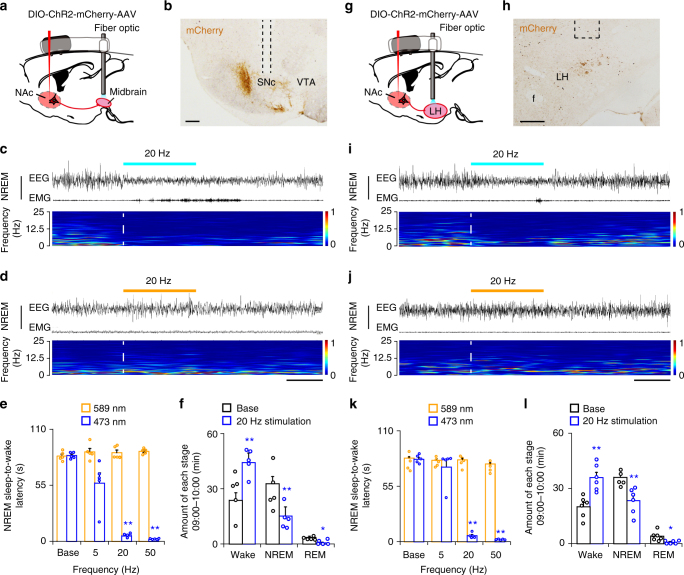
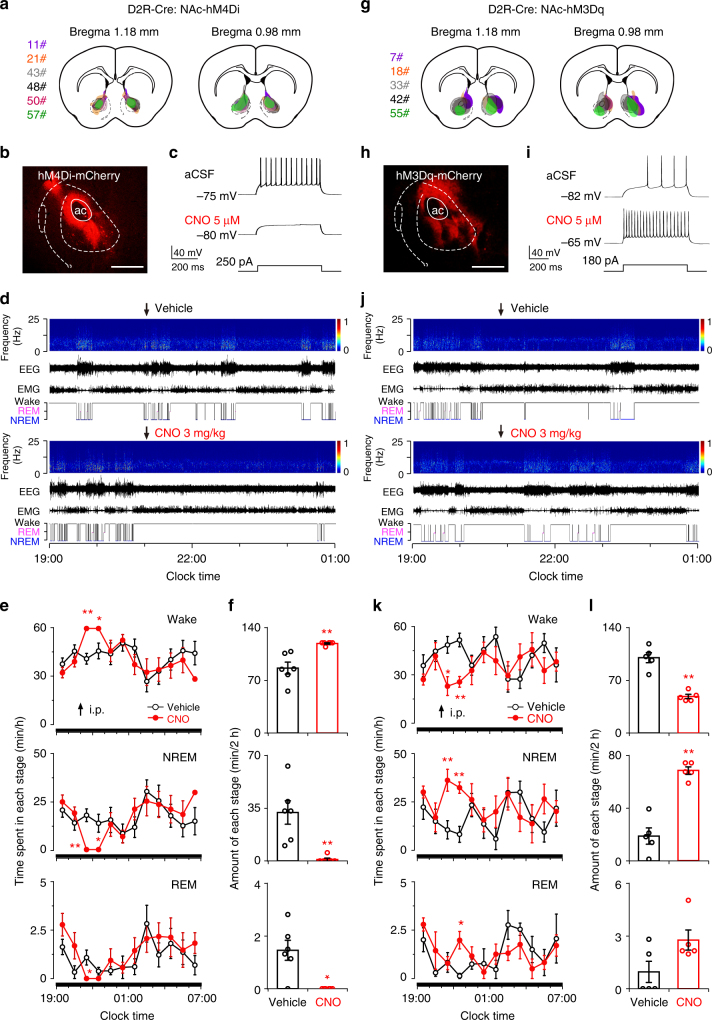
Nucleus accumbens (NAc) is involved in behaviors that depend on heightened wakefulness, but its impact on arousal remains unclear. Here, we demonstrate that NAc dopamine D1 receptor (D1R)-expressing neurons are essential for behavioral arousal. Using in vivo fiber photometry in mice, we find arousal-dependent increases in population activity of NAc D1R neurons. Optogenetic activation of NAc D1R neurons induces immediate transitions from non-rapid eye movement sleep to wakefulness, and chemogenetic stimulation prolongs arousal, with decreased food intake. Patch-clamp, tracing, immunohistochemistry, and electron microscopy reveal that NAc D1R neurons project to the midbrain and lateral hypothalamus, and might disinhibit midbrain dopamine neurons and lateral hypothalamus orexin neurons. Photoactivation of terminals in the midbrain and lateral hypothalamus is sufficient to induce wakefulness. Silencing of NAc D1R neurons suppresses arousal, with increased nest-building behaviors. Collectively, our data indicate that NAc D1R neuron circuits are essential for the induction and maintenance of wakefulness.


Conflict of interest statement

The authors declare no competing interests.

Figures

Fig. 1
Fig. 1
Population activities of NAc D1R neurons across sleep–wake states. a Schematic of the fiber photometry setup and in vivo recording configuration. DM dichroic mirror, PMT photomultiplier tube. b Unilateral viral targeting of AAV-EF1α-DIO-GCaMP6f into the NAc and the tip of fiber optic above the NAc. Scale bar: 1 mm. Right: Viral expression of GCaMP6f and the placement of fiber-optic probe above the NAc. Scale bar: 200 μm. c The 40× confocal images from a NAc D1R neurons::GCaMP6f brain section immunostained for substance P (SP) and DAPI displaying the colocalization between GCaMP6f-positive neurons (green) and SP (red) cells. White arrowheads highlight NAc D1R neurons expressing GCaMP6f. Scale bar: 10 μm. d Representative fluorescence traces, relative EEG power, and EEG/EMG traces across spontaneous sleep–wake states. ∆F/F represents change in fluorescence from median of the entire time series. e Fluorescence (mean ± s.e.m.) during wake, NREM sleep, and REM sleep for 3 mice, the fluorescence signal is the  highest during REM sleep, intermediate during wake, and the lowest during NREM sleep (n = 3 mice, 10 sessions per mouse, one-way ANOVA followed by Turkey’s post hoc test; F2,87 = 164.9, P = 2 × 10−30P (wake–NREM) = 5 × 10⁻⁹, (wake–REM) = 3 × 10⁻⁶, (NREM–REM) = 5 × 10⁻⁹). f Fluorescence signals aligned to wake state transitions. Upper panel, individual transitions with color coded fluorescence intensity (NREM–wake, n = 141; wake to NREM, n = 204; NREM to REM, n = 78; REM to wake, n = 73). Lower panel, mean (blue trace) ± s.e.m. (gray shading) showing the average calcium transients from all the transitions. **P<0.01
Fig. 2
Fig. 2
Chemogenetic activation of NAc D1R neurons increases wake and suppresses nest-building behavior and food intake. a Drawings of superimposed AAV injection sites in the NAc of D1R-Cre mice (n = 8, indicated with different colors). b Representative voltage traces recorded from an mCherry-expressing neuron during the application of CNO. CNO produced depolarization and firing in an hM3Dq-expressing neuron (left), and induced significant depolarization in hM3Dq-positive D1R neurons (right, n = 8 cells from 3 mice, paired t test; t7 = 5.8, P = 7 × 10−4). aCSF artificial cerebrospinal fluid. c Representative images of CNO-induced c-Fos (black)/mCherry (brown) colocalization in the NAc. Scale bars: 500 μm. Boxed regions in (c) are enlarged in the right panel. Scale bars: 10 μm. d, e Examples of relative EEG power, EEG/EMG traces, and hypnograms over 6 h following vehicle (d) or CNO (e) injection at 09:00. f Time course changes in wakefulness, NREM sleep, and REM sleep after administration of vehicle or CNO to mice expressing hM3Dq in NAc D1R neurons (n = 8, repeated-measures ANOVA; F1,14 = 11.9 (wake), 11.6 (NREM), 12.4 (REM); P = 0.004 (wake), 0.004 (NREM), 0.003 (REM)). g Total time spent in each stage for 2 h after vehicle or CNO injection (n = 8, paired t test). h EEG power density of wake during the 2 h after vehicle or CNO injection (n = 8, paired t test; not statistically significant). i Diagram of experiment. j Nesting score was assessed in 4 groups (n = 8 per group, Wilcoxon matched-pairs signed rank test: mCherry: Z = 0.6, P = 0.5; hM3Dq: Z = 2.3, P = 0.02). k Systemic application of CNO significantly reduced food consumption (n = 6 per group, paired t test). Data represent mean ± s.e.m. *P < 0.05, **P < 0.01
Fig. 3
Fig. 3
Optogenetic activation of NAc D1R neurons induces a rapid transition from NREM sleep to wakefulness. a Diagram of experiment for in vivo optical stimulation. b Brain section was stained against mCherry and c-Fos to confirm that the ChR2 protein was expressed in the NAc, and arrows indicate the tip of the optical fiber above the NAc. Scale bar: 1 mm. c Higher magnification image of white box in (b) indicates abundant c-Fos immunoreactivity in ChR2-mCherry neurons following photostimulation. Scale bar: 50 μm. d, g Representative EEG/EMG traces, heat map of EEG power spectra show that acute photostimulation (20 Hz/5 ms) applied during NREM sleep induced a transition to wake in a ChR2-mCherry mouse. Scale bar: 8 s. e, h EEG power (mean) before (red trace) and after (blue trace) onset of photostimulation in ChR2-mCherry (e) or mCherry  (h)  mice. Gray lines indicate statistical differences (n = 5 per group; P < 0.05, paired t test). f, i Heat maps showing the mean probability of NREM sleep-to-wake transitions induced by photostimulation in ChR2-mCherry (f) or mCherry (i) mice, n = 5 per group. Quantification based on an average of 6–12 stimulations per condition per mouse. Stim stimulation. j Latencies of transitions from NREM sleep to wakefulness after photostimulation at different frequencies (n = 6 per group, unpaired t test; Base, t10 = 0.4, P = 0.7; 5 Hz, t10 = 1.3, P = 0.2; 10 Hz, t10 = 5.5, P = 3 × 10−4; 20 Hz, t10 = 18.8, P = 4 × 10−9; 30 Hz, t10 = 19.5, P = 3 × 10−9; 50 Hz, t10 = 26.4, P = 1 × 10−10). k Time course of wakefulness during semi-chronic optogenetic experiment (20 Hz/5 ms, 10 s on/20 s off). The blue column indicates the photostimulation period of the stimulation group (n = 5, repeated-measures ANOVA; F1,8 = 10.5, P = 0.01). l Total amounts of each stage in control and photostimulation groups (n = 5, paired t test; t4 = 3.7 (wake), 3.5 (NREM), 5.0 (REM); P = 0.02 (wake), 0.03 (NREM), 0.007 (REM)). Data represent mean ± s.e.m. *P < 0.05, **P < 0.01
Fig. 4
Fig. 4
NAc D1R neurons preferentially send inhibitory inputs to TH-negative neurons in the midbrain. a Schematic of experiment. AAV-ChR2 was injected into the NAc of D1R-Cre mice, and the response was recorded in the midbrain (VTA/SNc). b Representative image of terminals in the midbrain from NAc D1R neurons. Scale bars: 500 μm. ac anterior commissure, ml medial lemniscus. c Electrophysiological properties of Type 1 neurons in the midbrain. d Non-type 1 neurons consist of both Ih-positive and Ih-negative neurons. e Comparison of action potential duration (left) and resting membrane potential (RMP, right) from type 1 and non-type 1 neurons (n = 26 type 1 neurons, n = 28 non-type 1 neurons, from 17 mice, unpaired t test; action potential duration: t52 = 8.7, P = 1 × 10−11; RMP: t52 = 5.6, P = 9 × 10−7). f Proportion of connected and unconnected neurons that were identified as type 1 (n = 26 type 1 neurons, n = 28 non-type 1 neurons, from 17 mice, Chi-square test; χ2 = 30.1, P = 2 × 10−8). gi Representative images of a non-connected biocytin-filled neuron that was TH-positive. Scale bar: 20 μm. TH tyrosine hydroxylase. jl Typical example of a connected biocytin-labeled neuron that was TH negative and responsive to light stimulation. Scale bar: 20 μm. m Representative results from a single-cell RT-PCR reaction confirming the Vgat phenotype of a connected cell. n Latency (left axis) and amplitude (right axis) of light-evoked IPSCs in midbrain non-TH neurons. o Summary of TH immunocytochemistry for connected and unconnected neurons (n = 18 TH (+) neurons, n = 21 TH (–) neurons, from 17 mice, Chi-square test; χ2 = 24.9, P = 4 × 10−7). p Electron microscopy image of an mCherry-immunoreactive terminal (mt) that formed a symmetric synapse (arrow) with an unlabeled dendrite (ud). Scale bar: 0.5 μm. q A representative image of a TH-positive dendrite (Td) that established a symmetric synapse (arrow) with unlabeled terminals (ut). Scale bar: 0.5 μm. r A TH-positive dendrite (Td) that established an asymmetric synapse (arrowhead) with unlabeled terminals (ut). Scale bar: 0.5 μm. **P < 0.01
Fig. 5
Fig. 5
NAc D1R neurons sparsely target NAc-projecting VTA DA neurons. a Schematic of the experimental protocol. Cre-dependent ChR2 was injected into the NAc of D1R-Cre mice, while retrograde tracer CTB-488 was injected into the DMS. Infected terminals (red) were optogenetically activated, and recordings were obtained from retrogradely labeled SNc projection neurons (green). DMS dorsomedial striatum. b Representative images of ChR2-mCherry and CTB-488 at the injection sites and their anterogradely and retrogradely labelings in the midbrain slice. Left, scale bars: 500 μm. Right, scale bar: 200 μm. c Whole-cell recordings from a DMS projecting SNc neuron did not respond to blue light (5 ms pulses at 20 Hz). d No DMS projecting SNc neurons showed connections with NAc D1R neurons (n = 12 cells from 3 mice). e Representative confocal images showing a retrogradely labeled SNc neuron that was TH-positive (magenta). Scale bar: 20 μm. f Schematic of the experiment. Cre-dependent ChR2 and retrograde tracer CTB-488 were injected into the NAc of D1R-Cre mice, and recordings were obtained from retrogradely labeled VTA projection neurons (green). g Images showing ChR2-mCherry and CTB-488 injection in the NAc and anterogradely and retrogradely labeling in the midbrain. Left, scale bars: 200 μm. Right, scale bar: 200 μm. h Representative traces of optogenetically generated picrotoxin (PTX, 100 μM)-sensitive postsynaptic currents recorded from a retrogradely labeled VTA neuron. i Ten percent of NAc-projecting VTA neurons showed connections with NAc D1R neurons (n = 19 cells from 3 mice). j Representative confocal images of VTA slices showing a retrogradely labeled neuron (arrowhead) was TH positive and another patched cell not retrogradely labeled (arrow) was TH negative. Scale bar: 20 μm
Fig. 6
Fig. 6
NAc D1R neurons control arousal through midbrain and LH pathways. a, g Schematic diagram showing the location of the optic fiber in the midbrain (a) or LH (g), and the implanted somnographic electrodes of a D1R-Cre mouse injected with AAV-ChR2-mCherry in the NAc. b, h Sections stained for mCherry showing ChR2-mCherry-positive terminals in the midbrain (b) or LH (h), and the cannula trace showing the optic fibers targeting the nuclei. Scale bars: 200 μm; f fornix. c, i Representative EEG and EMG traces and the corresponding heat map of EEG power spectrum showing that photostimulation in the midbrain (c) or LH (i) applied during NREM sleep induced a rapid transition to wakefulness. Dashed lines indicate onset of light stimulation. d, j Representative EEG and EMG recordings and the corresponding heat map of EEG power spectrum showing that yellow light stimulation in the midbrain (d) or LH (j) failed to affect the sleep–wake pattern. Scale bars: 8 s. e Mean latencies of wake transitions during NREM sleep after acute photostimulation at different frequencies (n = 5, paired t test; Base, t4 = 0.4, P = 0.7; 5 Hz, t4 = 2.4, P = 0.08; 20 Hz, t4 = 28.5, P = 9 × 10−6; 50 Hz, t4 = 81.8, P = 1.3 × 10−7). Data analysis was based on an average of 8–12 stimulations per frequency and per mouse. f Total amounts of each stage in the control and 20 Hz photostimulation in the midbrain during 09:00–10:00 (n = 5, paired t test; t4 = 9.5, P = 7 × 10−4 (wake); t4 = 9.4, P = 7 × 10−4 (NREM); t4 = 3.8, P = 0.02 (REM)). k Mean latencies of wake transitions during NREM sleep after photostimulation at different frequencies (n = 5, paired t test). Data analysis was based on an average of 8–12 stimulations per frequency and per mouse. l Total amounts of each stage in the control and 20 Hz photostimulation in the LH during 09:00–10:00 (n = 6, paired t test). Data represent mean ± s.e.m. *P < 0.05, **P < 0.01
Fig. 7
Fig. 7
Chemogenetic inhibition of NAc D1R neurons increases NREM sleep and promotes nest-building. a Drawings of superimposed AAV injection sites in the NAc of D1R-Cre mice (n = 9, indicated with different colors). b Representative traces showing that CNO decreased the number of evoked action potentials in an hM4Di-expressing neuron. c Time course of wakefulness, NREM sleep, and REM sleep after administration of vehicle or CNO at 09:00 (n = 9, repeated-measures ANOVA; F1,16 = 26.7 (wake), 24.9 (NREM), 0.3 (REM); P = 8 × 10−5 (wake), 1 × 10−4 (NREM), 0.6 (REM)). d Total amounts of each stage for 3 h following treatments during the light period (n = 9, paired t test; t8 = 7.2, P = 9 × 10−5 (wake); t8 = 6.2, P = 3 × 10−4 (NREM); t8 = 0.5, P = 0.6 (REM)). e EEG power density of NREM and REM sleep after CNO and vehicle injections. Red lines represent P < 0.05 (n = 9, paired t test). f Total amounts of each stage for 3 h following treatments during the dark period (n = 9, paired t test; t8 = 2.9, P = 0.02 (wake); t8 = 2.9, P = 0.02 (NREM); t8 = 1.9, P = 0.09 (REM)). g EEG power density of NREM and REM sleep after CNO and vehicle injections (n = 9, P > 0.05, paired t test). h Representative pictures of hM4Di mouse cages following vehicle and CNO administrations at the end of the 3 h test. i Nesting score during the 3 h test (1, poor; 5, good). Wilcoxon matched-pairs signed rank test, mCherry: n = 8, Z = 0.4, P = 0.7; hM4Di: n = 8, Z = 2.0, P = 0.047. j Inhibition of NAc D1R neurons did not affect food intake (n = 8 for hM4Di group and n = 6 for control group, paired t test; 2 h, mCherry: P = 0.8, hM4Di: P = 0.2; 24 h, mCherry: P = 0.5, hM4Di: P = 0.7). Data represent mean ± s.e.m. *P < 0.05, **P < 0.01, NS not significant
Fig. 8
Fig. 8
Chemogenetic inhibition of NAc D2R neurons increases wakefulness, while activation induces NREM sleep in D2R-Cre mice. a Drawings of superimposed AAV-DIO-hM4Di injection sites in the NAc of D2R-Cre mice (n = 6, indicated with different colors). b Representative image of hM4Di-mCherry expression in the NAc. Scale bar: 500 μm. c CNO applied to the bath reduced firing rate in response to 250 pA current injection in an hM4Di-expressing D2R neuron of brain slice. d Typical examples of compressed spectral array EEG, EMG, and hypnograms over 6 h following administration of vehicle or CNO in a D2R-Cre mouse with bilateral hM4Di receptor expression in the NAc. e Time course of wakefulness, NREM sleep, and REM sleep following injection of vehicle or CNO in mice expressing hM4Di receptor in NAc D2R neurons (n = 6, repeated-measures ANOVA; F1, 10 = 16.8 (wake), 15.9 (NREM), 14.6 (REM); P = 0.002 (wake), 0.003 (NREM), 0.003 (REM)). f Total time spent in each stage for 2 h after vehicle or CNO injection (n = 6, paired t test; P = 0.009 (wake), P = 0.01 (NREM), P = 0.012 (REM)). g Drawings of superimposed AAV-DIO-hM3Dq injection sites in the NAc of D2R-Cre mice (n = 5). h Representative image of hM3Dq-mCherry expression in the NAc. Scale bar: 500 μm. i CNO applied to the bath increased firing rate in response to 180 pA current injection in an hM3Dq-expressing D2R neuron of brain slice. j Typical examples of compressed spectral array EEG, EMG, and hypnograms over 6 h following administration of vehicle or CNO in a D2R-Cre mouse with bilateral hM3Dq receptor expression in the NAc. k Time course of wakefulness, NREM sleep, and REM sleep after administration of vehicle or CNO to mice expressing hM3Dq in NAc D2R neurons (n = 5, repeated-measures ANOVA; F1,8 = 17.8 (wake), 16.9 (NREM), 7.6 (REM); P = 0.003 (wake), 0.003 (NREM), 0.025 (REM)). l Total time spent in each stage for 2 h after vehicle or CNO injection (n = 5, paired t test; P = 0.003 (wake), P = 0.002 (NREM), P = 0.1 (REM)). *P < 0.05, **P < 0.01

Similar articles

Cited by

References

    1. Salgado S, Kaplitt MG. The nucleus accumbens: a comprehensive review. Stereotact. Funct. Neurosurg. 2015;93:75–93. doi: 10.1159/000368279. - DOI - PubMed
    1. Lazarus M, Chen J, Urade Y, Huang Z. Role of the basal ganglia in the control of sleep and wakefulness. Curr. Opin. Neurobiol. 2013;23:780–785. doi: 10.1016/j.conb.2013.02.001. - DOI - PMC - PubMed
    1. Lazarus M, Huang ZL, Lu J, Urade Y, Chen JF. How do the basal ganglia regulate sleep-wake behavior? Trends Neurosci. 2012;35:723–732. doi: 10.1016/j.tins.2012.07.001. - DOI - PubMed
    1. Russo SJ, Nestler EJ. The brain reward circuitry in mood disorders. Nat. Rev. Neurosci. 2013;14:609–625. doi: 10.1038/nrn3381. - DOI - PMC - PubMed
    1. Morgan PT, Malison RT. Cocaine and sleep: early abstinence. Sci. World J. 2007;7:223–230. doi: 10.1100/tsw.2007.209. - DOI - PMC - PubMed

Publication types

LinkOut - more resources