. 2018 Apr 20;8(1):6324.
doi: 10.1038/s41598-018-24583-w.

Micro-thermocouple on nano-membrane: thermometer for nanoscale measurements

Affiliations

Micro-thermocouple on nano-membrane: thermometer for nanoscale measurements

Armandas Balčytis et al. Sci Rep. .

Abstract

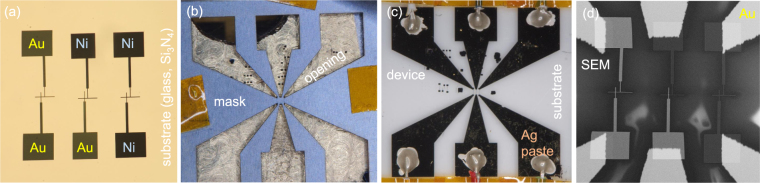
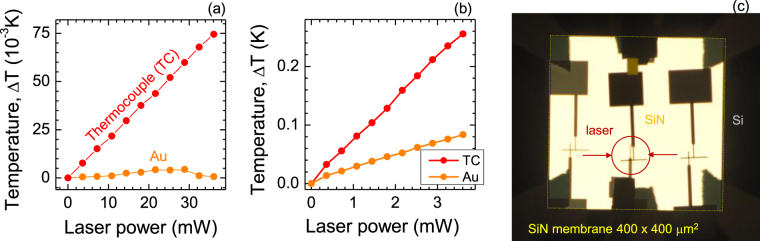
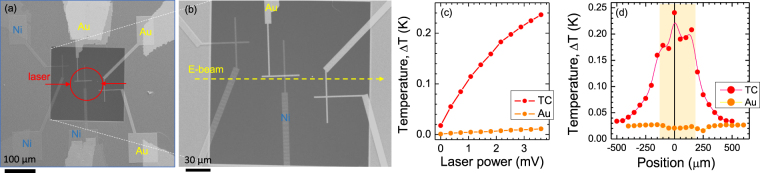
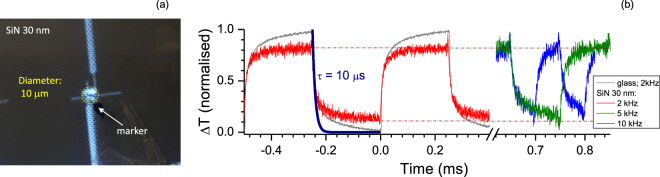
A thermocouple of Au-Ni with only 2.5-μm-wide electrodes on a 30-nm-thick Si3N4 membrane was fabricated by a simple low-resolution electron beam lithography and lift off procedure. The thermocouple is shown to be sensitive to heat generated by laser as well as an electron beam. Nano-thin membrane was used to reach a high spatial resolution of energy deposition and to realise a heat source of sub-1 μm diameter. This was achieved due to a limited generation of secondary electrons, which increase a lateral energy deposition. A low thermal capacitance of the fabricated devices is useful for the real time monitoring of small and fast temperature changes, e.g., due to convection, and can be detected through an optical and mechanical barrier of the nano-thin membrane. Temperature changes up to ~2 × 10⁵ K/s can be measured at 10 kHz rate. A simultaneous down-sizing of both, the heat detector and heat source strongly required for creation of thermal microscopy is demonstrated. Peculiarities of Seebeck constant (thermopower) dependence on electron injection into thermocouple are discussed. Modeling of thermal flows on a nano-membrane with presence of a micro-thermocouple was carried out to compare with experimentally measured temporal response.


Conflict of interest statement

The authors declare no competing interests.

Figures

Figure 1
Figure 1
Thermocouple fabrication stages and patterns of electrodes at different magnifications. Thermocouples were fabricated on glass and Si3N4 membranes of different thicknesses: 1 μm and 30 nm. (a) Metal junctions of 2.5-μm-wide metal stripes with 100 × 100 μm2 primary contact pads. (b) Photo image of a laser ablated photolithography mask used for resist exposure. It defines the secondary contact pads to interface with electrical measurements. (c) Photo of the final device on glass. (d) A SEM image of the micro-thermocouple and reference electrodes. The central pair is the Au-Ni thermocouple.
Figure 2
Figure 2
Characterisation of thermocouples. (a) Temperature increase induced by laser heating at different laser power s measured by the optical modulation method (wavelength λ = 830 nm; p-polarisation at slanted front-side incidence). Thermocouple Au-Ni was made on a slide glass. Sensitivity of 10.1 μV/K determined for similar thermocouple was used for estimation of temperature changes; Au-Au junction was used as a reference. Illumination of the substrate was carried out from the side to contacts. (b) Temperature vs. laser power for 1 μm-thick Si3N4 membrane. The Au-Au reference electrodes had a Cr adhesion layer and formed a thermocouple which was experiencing a thermal gradient due to asymmetry of the primary contact pads during laser heating (see panel (c)). (c) An optical see-through image of the 400 × 400 μm2 SiN-membrane region with thermocouple whose response is plotted in (b); laser spot was 100 μm in diameter. Note a thermal asymmetry of this layout where the upper 100 × 100 μm2 primary contact square pad was on the SiN membrane while the lower one on the Si substrate.
Figure 3
Figure 3
Thermocouple on a 30-nm-thick SiN-membrane. (a,b) SEM images of thermocouple made on a 250 × 250 μm2 SiN window. Note, secondary (large) contact pads are made from the same metal (Au or Ni) as the smaller ones to avoid formation of a secondary thermocouple. The large contacts are placed on Si substrate to remove a thermal gradient on the thermocouple (such gradient was responsible for the observed temperature change in Fig. 2(b) measured with the Au-Au contact). (c) Temperature vs. laser power. (d) Temperature vs. position of the electron beam across the central cross section (along the line in (b)). Diameter of the e-beam was 0.5 μm at the acceleration voltage of 25 keV; modulation frequency was 30 Hz, current 1.7 nA as measured by Faraday cup without the sample. Central shaded region depicts the location of membrane. E-beam was scanned across the SiN window and Si substrate without direct exposure of metal leads/contacts.
Figure 4
Figure 4
Temporal response of thermocouple on a 30-nm-thick SiN-membrane to a square-wave optical excitation. (a) Video image of a tightly-focused laser beam onto thermocouple with 10μm spot diameter; λ = 830 nm. (b) Temporal response of thermocouples: (i) to a 3.6 mW laser power at repetition rate f = 2 kHz with a thermocouple on a slide glass and (ii) to 1.8 mW power with thermocouple on a 30-nm-thick SiN-membrane at f = 2, 5, 10 kHz; note different x-axis scales in (b). The fastest switching time was τ = RC = 10 μs with ohmic resistance of thermocouple R = 500 Ω and C = 20 nF. Electronic pre-amplifier of 100× was used for a direct observation by oscilloscope. The estimated max-min ΔT span was 16 K (30.7-to-14.7 K above RT of 22 °C) for the thermocouple on glass and ΔT = 4.1 K for 30 nm SiN-membrane (31.3-to-27.2 K) at 2 kHz; at higher 5 and 10 kHz frequencies the max temperature increase was similar ΔTmax = 30.5 K and min-max span of ∼4 K.
Figure 5
Figure 5
Response of micro-thermocouple to back-side electron irradiation. (a) SEM image of thermocouple on 30 nm SiN-membrane by back-scattered (in lens) and secondary (large angle scattered) electrons. (b,c) Measured amplitude and phase response of the Au-Ni thermocouple to a diagonal scan (dashed line in the inset in (b)) with 7 μm steps measured with a lock-in amplifier. Thermocouple voltage was normalised to the transmitted electron current measured by the Faraday cup using an additional lock-in amplifier; e-beam blanking frequency was 27 Hz. The slope of line (1) in (c) corresponds to the best fit by a linear PhaseConst×d dependence, where d is the distance between heat source and measurement point (only valid at large separations); the temperature diffusivity was a = 0.62 × 10−4 m2/s or 47.7 times larger than that of SiN.

References

    1. Chu D, Bilir DT, Pease RFW, Goodson KE. Submicron thermocouple measurements of electron-beam resist heating. J. Vac. Sci. Technol. B. 2002;20:3044–3046. doi: 10.1116/1.1523023. - DOI
    1. Chae J, et al. Nanophotonic atomic force microscope transducers enable chemical composition and thermal conductivity measurements at the nanoscale. Nano Lett. 2017;17:5587–5594. doi: 10.1021/acs.nanolett.7b02404. - DOI - PMC - PubMed
    1. Morikawa J, Orie A, Hashimoto T, Juodkazis S. Thermal and optical properties of the femtosecond-laser-structured and stress-induced birefringent regions of sapphire. Opt. Express. 2010;18:8300–8310. doi: 10.1364/OE.18.008300. - DOI - PubMed
    1. Cahill DG, et al. Nanoscale thermal transport. J. Appl. Phys. 2003;93:793–818. doi: 10.1063/1.1524305. - DOI
    1. Cahill, D. G. et al. Nanoscale thermal transport. II. 2003-2012. Appl. Phys. Rev. 1 (2014).

LinkOut - more resources