. 2018 Apr 20;9(1):1581.
doi: 10.1038/s41467-018-04003-3.

Proteome-wide analysis of cysteine oxidation reveals metabolic sensitivity to redox stress

Affiliations

Proteome-wide analysis of cysteine oxidation reveals metabolic sensitivity to redox stress

Jiska van der Reest et al. Nat Commun. .

Abstract

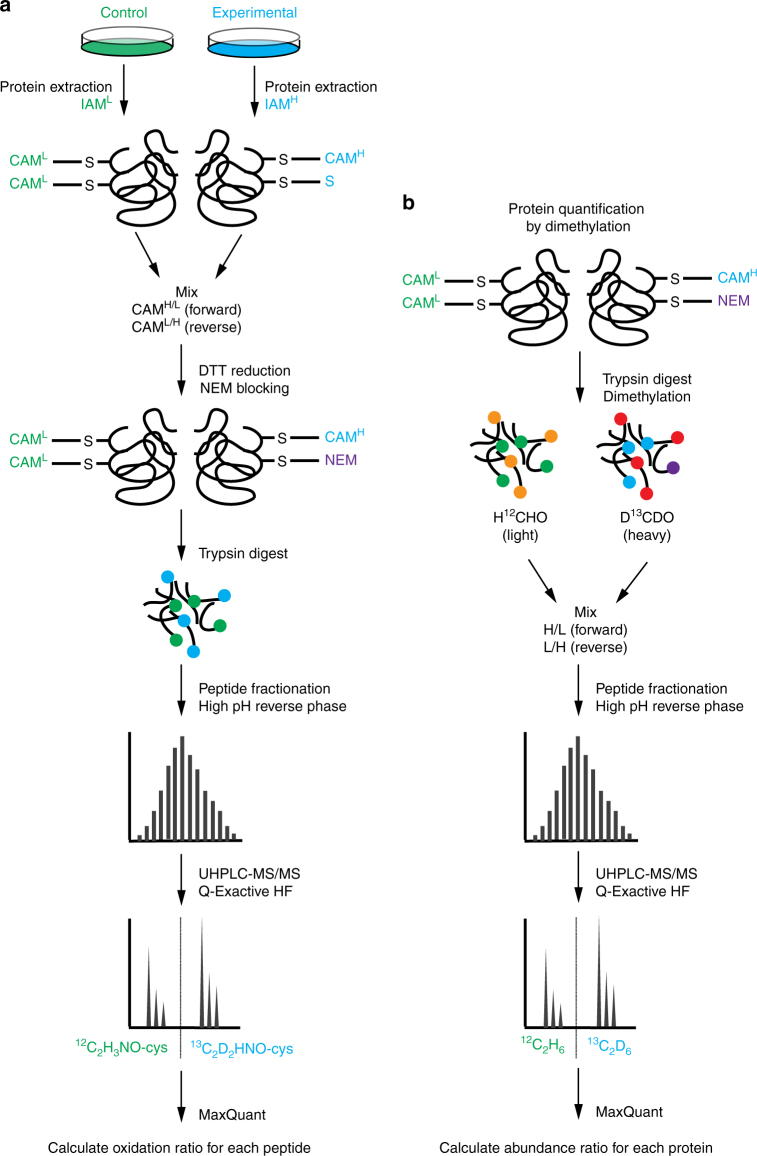
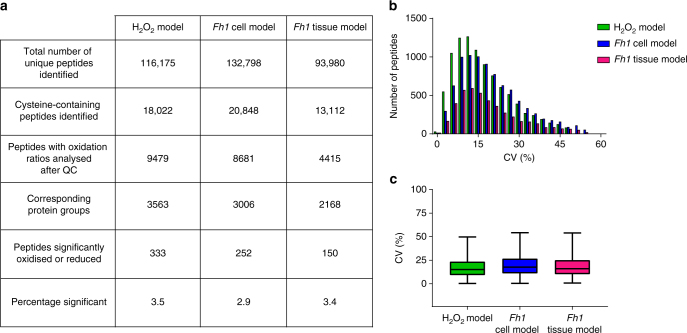
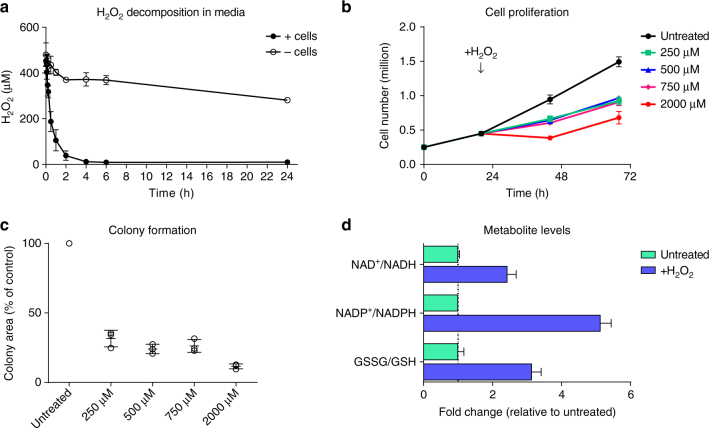
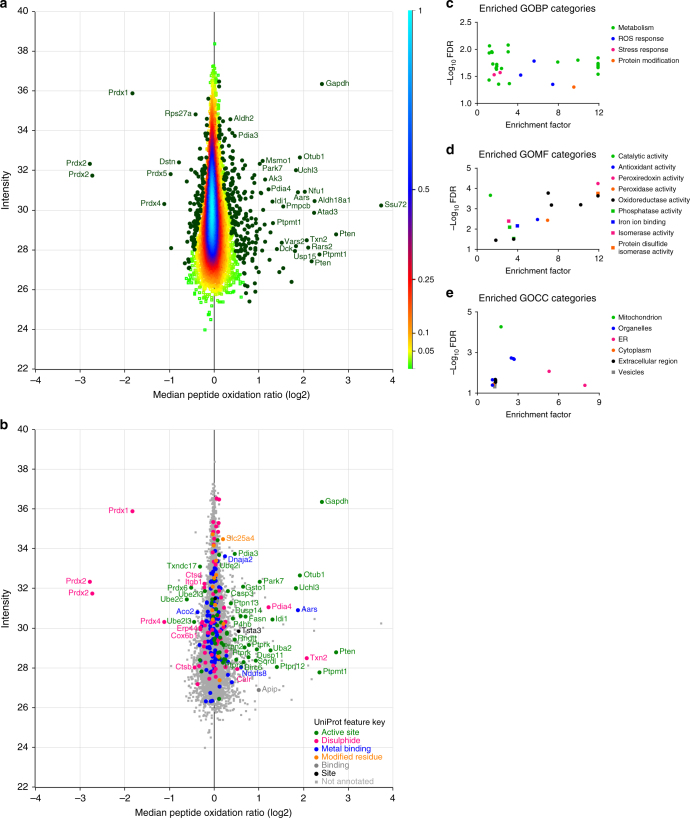
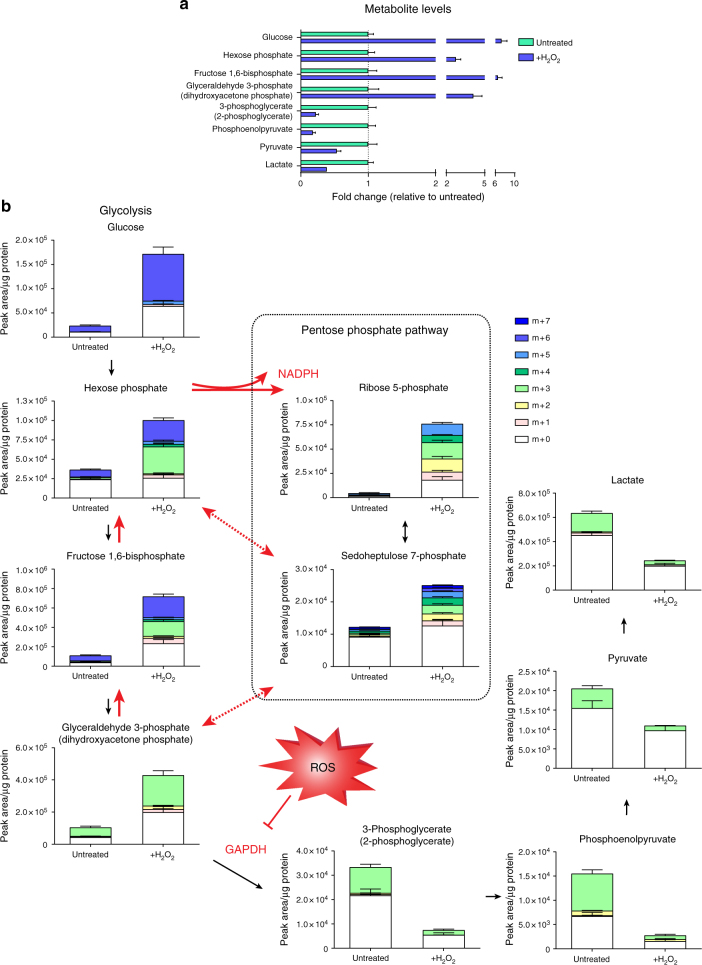
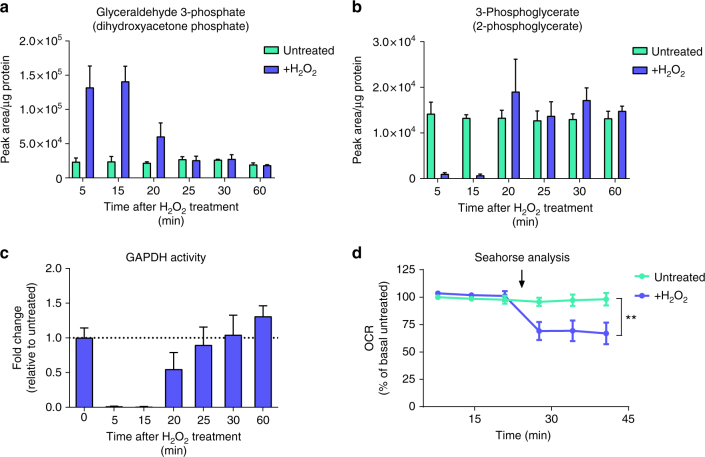
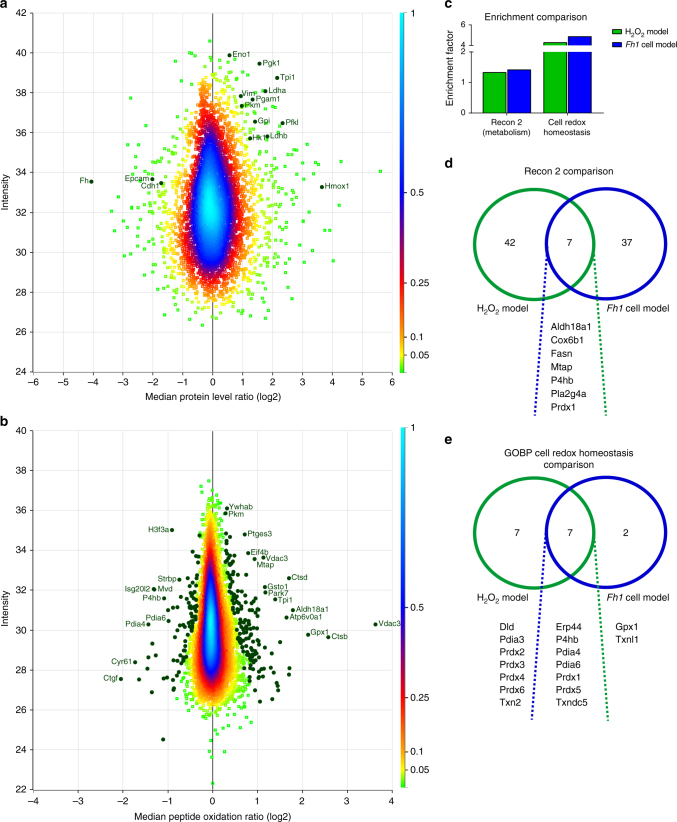
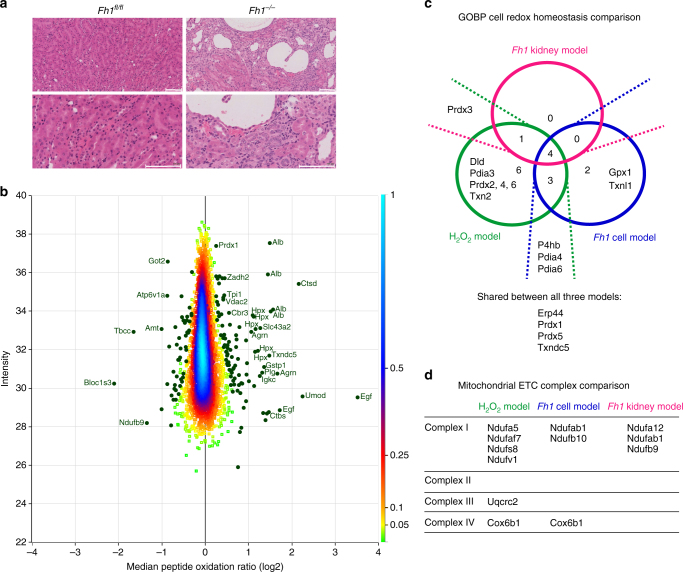
Reactive oxygen species (ROS) are increasingly recognised as important signalling molecules through oxidation of protein cysteine residues. Comprehensive identification of redox-regulated proteins and pathways is crucial to understand ROS-mediated events. Here, we present stable isotope cysteine labelling with iodoacetamide (SICyLIA), a mass spectrometry-based workflow to assess proteome-scale cysteine oxidation. SICyLIA does not require enrichment steps and achieves unbiased proteome-wide sensitivity. Applying SICyLIA to diverse cellular models and primary tissues provides detailed insights into thiol oxidation proteomes. Our results demonstrate that acute and chronic oxidative stress causes oxidation of distinct metabolic proteins, indicating that cysteine oxidation plays a key role in the metabolic adaptation to redox stress. Analysis of mouse kidneys identifies oxidation of proteins circulating in biofluids, through which cellular redox stress can affect whole-body physiology. Obtaining accurate peptide oxidation profiles from complex organs using SICyLIA holds promise for future analysis of patient-derived samples to study human pathologies.


Conflict of interest statement

E.G. is a Shareholder and Director at MetaboMed Ltd, Israel. The remaining authors declare no competing interests.

Figures

Fig. 1
Fig. 1
Schematic overview of the Stable Isotope Cysteine Labelling with IodoAcetamide (SICyLIA) methodology. a Samples are extracted in presence of either light (12C2H4INO) or heavy (13C2D2H2INO) iodoacetamide (IAM) to alkylate free cysteine thiols, introducing a carbamidomethyl (CAM) group. Equal amounts of modified protein extracts are mixed, reversibly oxidised thiols are reduced with DTT and subsequently alkylated with NEM. Protein extracts are digested and peptides are fractionated prior to UHPLC-MS/MS analysis. b In parallel, labelled proteome extracts are trypsin digested and dimethylated using light (H12CHO/NaBH3CN) or heavy (D13CDO/NaBD3CN) formaldehyde/sodium cyanoborohydride, peptides are fractioned, and analysed using UHPLC-MS/MS similarly to IAM-modified peptides
Fig. 2
Fig. 2
Performance indicators and reproducibility of the SICyLIA workflow. a Number of peptides and proteins identified using SICyLIA in the three experimental models, broken down into indicated classes. b Histogram distribution and c boxplots of the coefficient of variation (CV%) of peptide oxidation ratios between four replicates as identified using SICyLIA for the three experimental models. Boxplots display 25th and 75th percentile (bounds of box), median (centre line), and largest and smallest value (whiskers) of the distribution. ac Based on four independent experiments, single measurement (H2O2 model, Fh1 cell model) or the comparison of one mouse per genotype, using four replicate tissue slices per mouse (Fh1 tissue model)
Fig. 3
Fig. 3
Treatment with hydrogen peroxide causes recoverable oxidative stress in Fh1fl/fl cells. a Stability of hydrogen peroxide in culture media with or without cells after treatment with 500 µM hydrogen peroxide. b Cell proliferation after hydrogen peroxide treatment. Media was replaced after 15 min of treatment. c Colony formation capacity after hydrogen peroxide treatment. Assays were started after 15 min of treatment. d Relative ratios of intracellular NAD+/NADH, NADP+/NADPH and GSSG/GSH after treatment with 500 µM hydrogen peroxide for 15 min. ad All graphs show mean (S.D.) of three independent experiments with triplicate measurements
Fig. 4
Fig. 4
Acute oxidative stress causes oxidation of predominantly metabolic and mitochondrial proteins. a Density scatterplot displaying log 2 median peptide oxidation ratios vs. peptide intensity in Fh1fl/fl cells treated with 500 µM hydrogen peroxide for 15 min compared to untreated cells. Every square represents a unique peptide; colour scale of the density of the data points in the corresponding region is indicated on the right. Highlighted green circles are significantly oxidised (positive values) or reduced (negative values) peptides. Gene names of corresponding peptides are displayed for the most significantly oxidised or reduced peptides. b Scatterplot displaying log 2 median peptide oxidation ratios vs. peptide intensity in Fh1fl/fl cells treated with 500 µM hydrogen peroxide for 15 min compared to untreated cells. Every symbol represents a unique peptide, with legend indicated. Coloured circles represent peptides of which the cysteine residue has a Feature Key annotation in the UniProt database; squares represent those without this annotation. Significantly oxidised (positive values) or reduced (negative values) cysteine peptides within the annotated group are highlighted with their corresponding gene name. Enriched c GO biological process (GOBP), d molecular function (GOMF), e and cellular compartment (GOCC) categories within significantly oxidised or reduced proteins compared to all proteins detected. ae Based on four independent experiments, single measurement
Fig. 5
Fig. 5
Acute oxidative stress inhibits GAPDH activity to amplify NADPH production in the PPP. a Relative ratios of indicated intracellular glycolytic metabolites after treatment with 500 µM hydrogen peroxide for 15 min. b Isotopologue distribution of intracellular metabolites in glycolysis and the pentose phosphate pathway after incubation with 13C6-glucose and 500 µM hydrogen peroxide for 15 min. a, b All graphs show mean (S.D.) of three independent experiments with triplicate measurements
Fig. 6
Fig. 6
Oxidative inhibition of GAPDH is transient and acute oxidative stress reduces mitochondrial respiration. Metabolite abundance of GAPDH substrate (a), downstream metabolite (b), and resultant relative GAPDH enzymatic activity (c) after treatment with 500 µM hydrogen peroxide for 15 min and subsequent cellular recovery. d Relative oxygen consumption rate (OCR) in response to treatment with 350 µM hydrogen peroxide. Arrow indicates addition of hydrogen peroxide. ac Mean (S.D.) of three independent experiments with triplicate measurements; d mean (S.D.) of three independent experiments with 12 replicate measurements per treatment. **p value = 0.0052 (two-way ANOVA with Dunnet’s test for multiple comparisons correction)
Fig. 7
Fig. 7
Chronic oxidative stress due to Fh1 loss causes widespread protein oxidation. a Density scatterplot displaying log 2 median protein level ratios vs. protein intensity in Fh1−/− cells compared to Fh1fl/fl cells. Every square represents a unique protein; colour scale of the density of the data points in the corresponding region is indicated on the right. Positive values indicate more abundant and negative values less abundant proteins in Fh1−/− cells. Highlighted green circles are selected proteins involved in adaptation to Fh1 loss with their corresponding gene names. b Density scatterplot displaying log 2 median peptide oxidation ratios vs. peptide intensity in Fh1−/− cells compared to Fh1fl/fl cells. Every square represents a unique peptide; colour scale of the density of the data points in the corresponding region is indicated on the right. Highlighted green circles are significantly oxidised (positive values) and reduced (negative values) peptides. Gene names of corresponding proteins are displayed for the most significantly oxidised or reduced peptides. c Comparison of enrichment analyses for the indicated categories between the acute and chronic oxidative stress model. d Venn diagram showing overlap and exclusivity of metabolic proteins, as defined by Recon 2, that were found significantly modified in the acute and chronic oxidative stress model. e Venn diagram showing overlap and exclusivity of proteins involved in cell redox homoeostasis as defined by GOBP that were found significantly modified in the acute and chronic oxidative stress model. ae Based on four independent experiments, single measurement
Fig. 8
Fig. 8
Analysis of mouse kidneys shows oxidation of proteins from various tissue compartments. a Representative image of Fh1fl/fl and Fh1−/− mouse kidney tissue slices stained for H&E, taken at 20× magnification. Scale bar indicates 100 µm. b Density scatterplot displaying log 2 median peptide oxidation ratios vs. peptide intensity in Fh1−/− mouse kidney tissue compared to Fh1fl/fl kidney tissue. Every square represents a unique peptide; colour scale of the density of the data points in the corresponding region is indicated on the right. Highlighted green circles are significantly oxidised (positive values) and reduced (negative values) peptides. Gene names of corresponding peptides are displayed for the most significantly oxidised or reduced peptides. c Venn diagram showing overlap and exclusivity of proteins involved in cell redox homoeostasis as defined by GOBP that were significantly modified in the acute and chronic oxidative stress cell and kidney models. d Comparison of components of the mitochondrial electron transport chain complexes that were significantly modified in the acute and chronic oxidative stress cell and kidney models. a Representative images of single histology slides; b based on the comparison of 1 mouse per genotype, using four replicate tissue slices per mouse. c, d Based on four independent experiments, single measurement (H2O2 model, Fh1 cell model) or the comparison of one mouse per genotype, using four replicate tissue slices per mouse (Fh1 tissue model)

References

    1. Szatrowski TP, Nathan CF. Production of large amounts of hydrogen peroxide by human tumor cells. Cancer Res. 1991;51:794–798. - PubMed
    1. Schieber M, Chandel NS. ROS function in redox signaling and oxidative stress. Curr. Biol. 2014;24:R453–R462. doi: 10.1016/j.cub.2014.03.034. - DOI - PMC - PubMed
    1. Cross CE, et al. Oxygen radicals and human disease. Ann. Intern. Med. 1987;107:526–545. doi: 10.7326/0003-4819-107-4-526. - DOI - PubMed
    1. Dizdaroglu M, Jaruga P. Mechanisms of free radical-induced damage to DNA. Free Radic. Res. 2012;46:382–419. doi: 10.3109/10715762.2011.653969. - DOI - PubMed
    1. Finkel T. Signal transduction by reactive oxygen species. J. Cell Biol. 2011;194:7–15. doi: 10.1083/jcb.201102095. - DOI - PMC - PubMed

Publication types