

Comparative analysis of the root transcriptomes of cultivated and wild rice varieties in response to Magnaporthe oryzae infection revealed both common and species-specific pathogen responses
- PMID: 29679239
- PMCID: PMC5910329
- DOI: 10.1186/s12284-018-0211-8
Comparative analysis of the root transcriptomes of cultivated and wild rice varieties in response to Magnaporthe oryzae infection revealed both common and species-specific pathogen responses
Abstract
Background: Magnaporthe oryzae, the causal fungus of rice blast disease, negatively impacts global rice production. Wild rice (Oryza rufipogon), a relative of cultivated rice (O. sativa), possesses unique attributes that enable it to resist pathogen invasion. Although wild rice represents a major resource for disease resistance, relative to current cultivated rice varieties, no prior studies have compared the immune and transcriptional responses in the roots of wild and cultivated rice to M. oryzae.
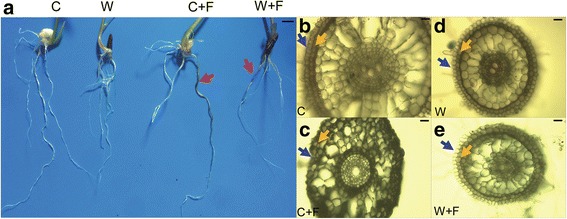
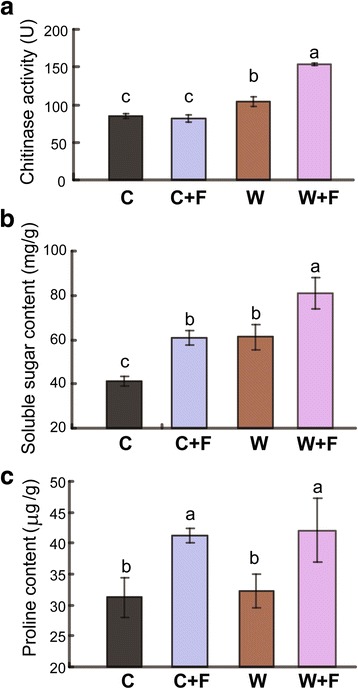
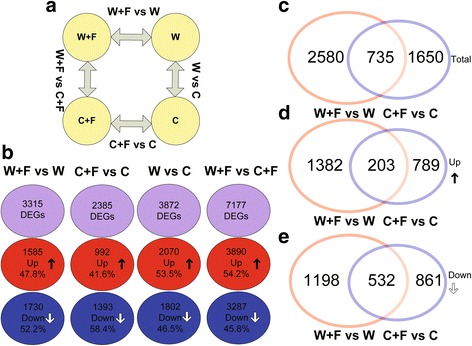
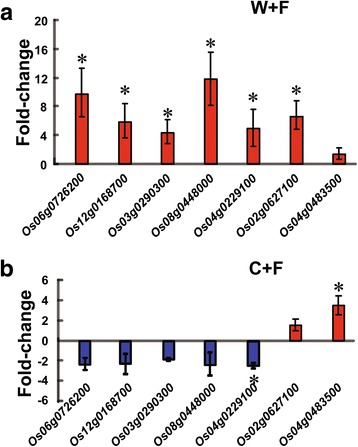
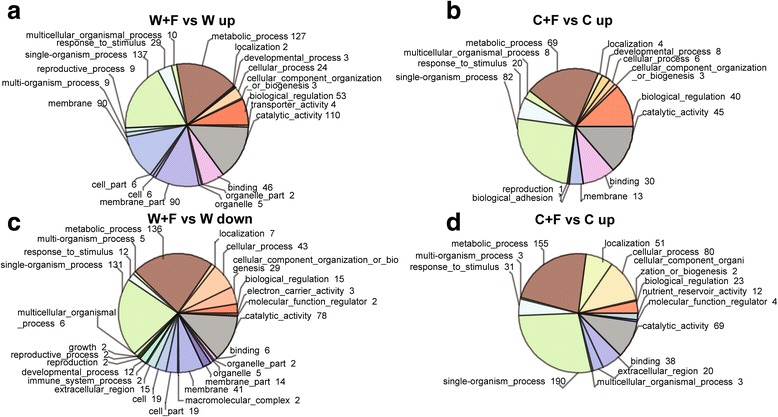
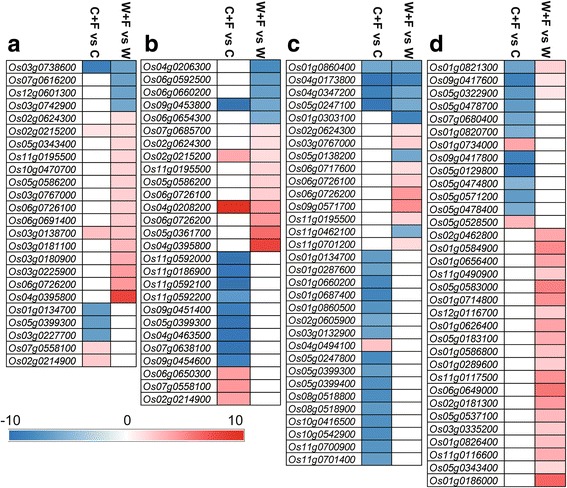
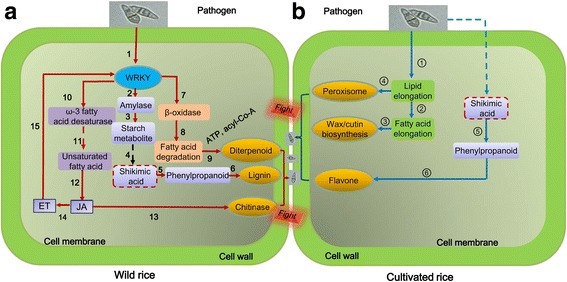
Results: In this study, we showed that M. oryzae could act as a typical root-infecting pathogen in rice, in addition to its common infection of leaves, and wild rice roots were more resistant to M. oryzae than cultivated rice roots. Next, we compared the differential responses of wild and cultivated rice roots to M. oryzae using RNA-sequencing (RNA-seq) to unravel the molecular mechanisms underlying the enhanced resistance of the wild rice roots. Results indicated that both common and genotype-specific mechanisms exist in both wild and cultivated rice that are associated with resistance to M. oryzae. In wild rice, resistance mechanisms were associated with lipid metabolism, WRKY transcription factors, chitinase activities, jasmonic acid, ethylene, lignin, and phenylpropanoid and diterpenoid metabolism; while the pathogen responses in cultivated rice were mainly associated with phenylpropanoid, flavone and wax metabolism. Although modulations in primary metabolism and phenylpropanoid synthesis were common to both cultivated and wild rice, the modulation of secondary metabolism related to phenylpropanoid synthesis was associated with lignin synthesis in wild rice and flavone synthesis in cultivated rice. Interestingly, while the expression of fatty acid and starch metabolism-related genes was altered in both wild and cultivated rice in response to the pathogen, changes in lipid acid synthesis and lipid acid degradation were dominant in cultivated and wild rice, respectively.
Conclusions: The response mechanisms to M. oryzae were more complex in wild rice than what was observed in cultivated rice. Therefore, this study may have practical implications for controlling M. oryzae in rice plantings and will provide useful information for incorporating and assessing disease resistance to M. oryzae in rice breeding programs.
Keywords: Cultivated rice; Magnaporthe oryzae; RNA-sequencing; Transcriptome analysis; Wild rice.
Conflict of interest statement
Ethics approval and consent to participate
Not applicable.
Consent for publication
Not applicable.
Competing interests
The authors declare that they have no competing interests.
Publisher’s Note
Springer Nature remains neutral with regard to jurisdictional claims in published maps and institutional affiliations.
Figures
Similar articles
-
Comparative study of the mycorrhizal root transcriptomes of wild and cultivated rice in response to the pathogen Magnaporthe oryzae.Rice (N Y). 2019 May 10;12(1):35. doi: 10.1186/s12284-019-0287-9. Rice (N Y). 2019. PMID: 31076886 Free PMC article.
-
Impact of domestication on the evolution of rhizomicrobiome of rice in response to the presence of Magnaporthe oryzae.Plant Physiol Biochem. 2018 Nov;132:156-165. doi: 10.1016/j.plaphy.2018.08.023. Epub 2018 Aug 21. Plant Physiol Biochem. 2018. PMID: 30195107
-
Co-evolutionary associations between root-associated microbiomes and root transcriptomes in wild and cultivated rice varieties.Plant Physiol Biochem. 2018 Jul;128:134-141. doi: 10.1016/j.plaphy.2018.04.009. Epub 2018 Apr 13. Plant Physiol Biochem. 2018. PMID: 29777991
-
Current understanding of pattern-triggered immunity and hormone-mediated defense in rice (Oryza sativa) in response to Magnaporthe oryzae infection.Semin Cell Dev Biol. 2018 Nov;83:95-105. doi: 10.1016/j.semcdb.2017.10.020. Epub 2017 Nov 2. Semin Cell Dev Biol. 2018. PMID: 29061483 Review.
-
[Recent advances in understanding the innate immune mechanisms and developing new disease resistance breeding strategies against the rice blast fungus Magnaporthe oryzae in rice].Yi Chuan. 2014 Aug;36(8):756-65. doi: 10.3724/SP.J.1005.2014.0756. Yi Chuan. 2014. PMID: 25143273 Review. Chinese.
Cited by
-
Regulating the Regulators: The Control of Transcription Factors in Plant Defense Signaling.Int J Mol Sci. 2018 Nov 24;19(12):3737. doi: 10.3390/ijms19123737. Int J Mol Sci. 2018. PMID: 30477211 Free PMC article. Review.
-
Wild rice harbors more root endophytic fungi than cultivated rice in the F1 offspring after crossbreeding.BMC Genomics. 2021 Apr 17;22(1):278. doi: 10.1186/s12864-021-07587-1. BMC Genomics. 2021. PMID: 33865333 Free PMC article.
-
Novel insights into host specificity of Pyricularia oryzae and Pyricularia grisea in the infection of gramineous plant roots.Mol Plant Pathol. 2022 Nov;23(11):1658-1670. doi: 10.1111/mpp.13259. Epub 2022 Aug 11. Mol Plant Pathol. 2022. PMID: 35957505 Free PMC article.
-
Adaptation Mechanism of Roots to Low and High Nitrogen Revealed by Proteomic Analysis.Rice (N Y). 2021 Jan 7;14(1):5. doi: 10.1186/s12284-020-00443-y. Rice (N Y). 2021. PMID: 33411084 Free PMC article.
-
Transcriptomic analysis of Phytophthora infestans races and evaluation of their pathogenicity on potato.BMC Plant Biol. 2025 May 28;25(1):716. doi: 10.1186/s12870-025-06736-y. BMC Plant Biol. 2025. PMID: 40437352 Free PMC article.
References
Grants and funding
LinkOut - more resources
Full Text Sources
Other Literature Sources
Research Materials
