. 2018 Jul;27(14):2913-2925.
doi: 10.1111/mec.14696. Epub 2018 Jun 4.

Light availability impacts structure and function of phototrophic stream biofilms across domains and trophic levels

Affiliations

Light availability impacts structure and function of phototrophic stream biofilms across domains and trophic levels

Mia M Bengtsson et al. Mol Ecol. 2018 Jul.

Abstract

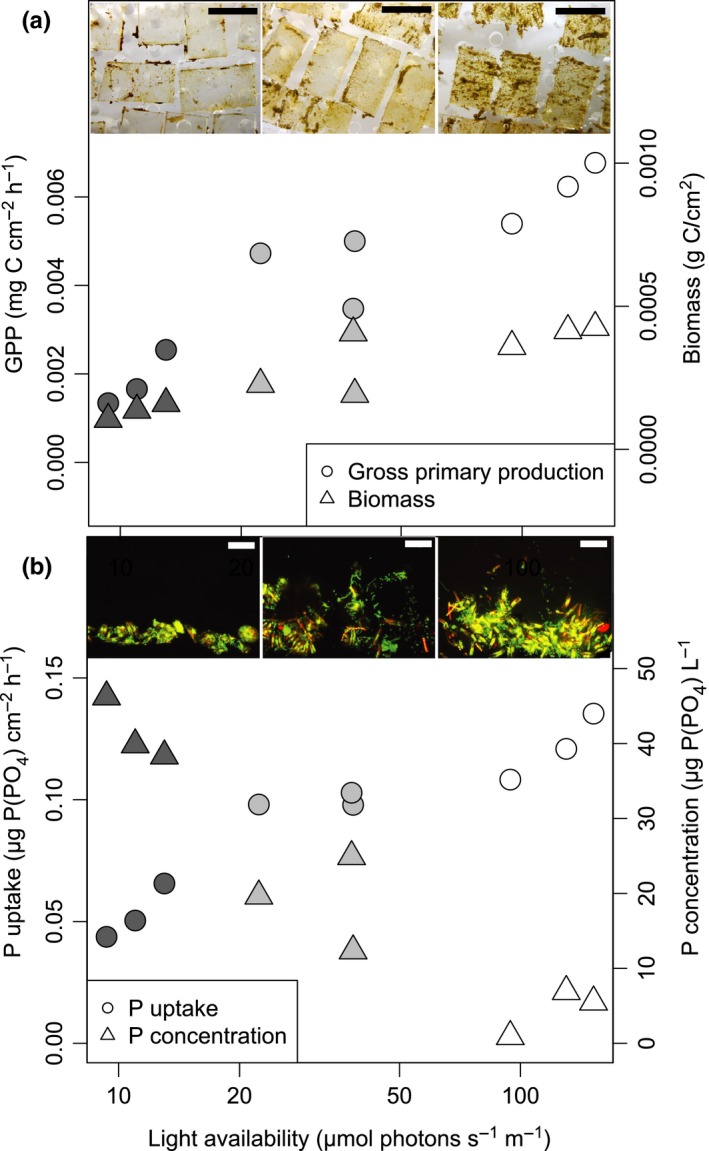
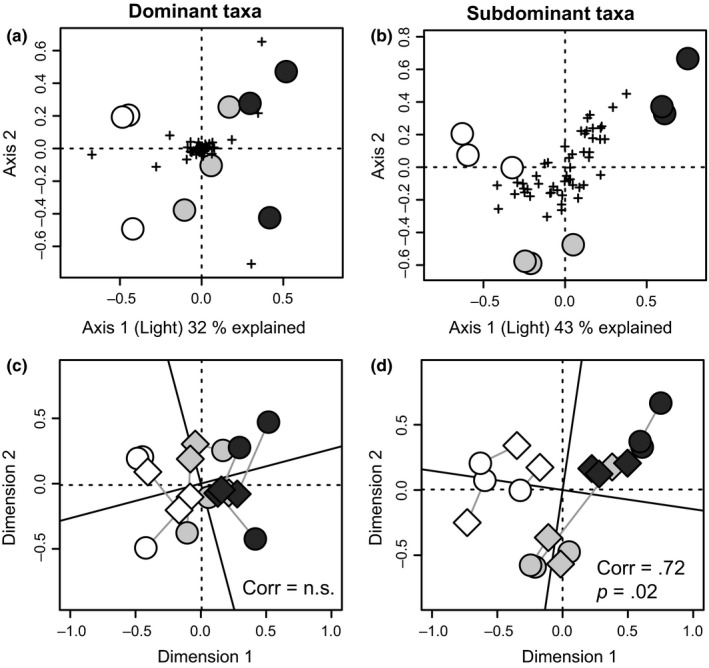
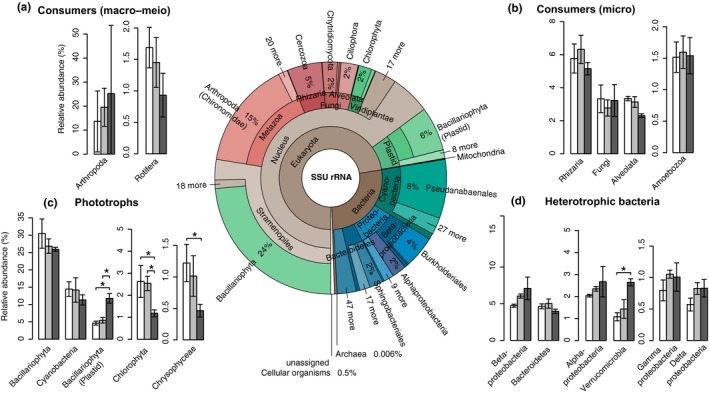
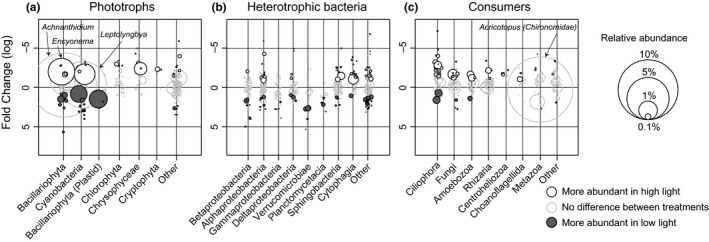
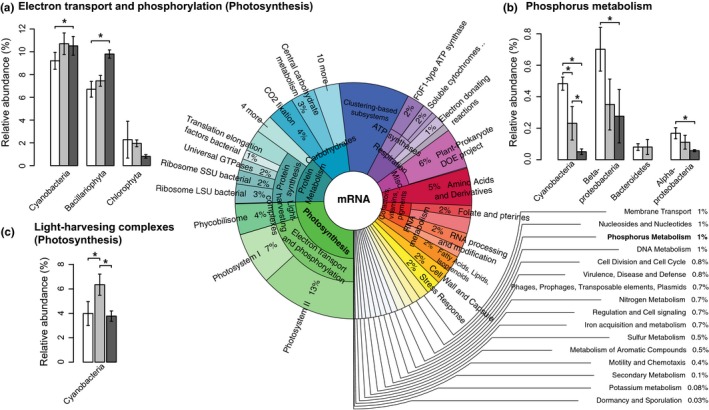
Phototrophic biofilms are ubiquitous in freshwater and marine environments where they are critical for biogeochemical cycling, food webs and in industrial applications. In streams, phototrophic biofilms dominate benthic microbial life and harbour an immense prokaryotic and eukaryotic microbial biodiversity with biotic interactions across domains and trophic levels. Here, we examine how community structure and function of these biofilms respond to varying light availability, as the crucial energy source for phototrophic biofilms. Using metatranscriptomics, we found that under light limitation-dominant phototrophs, including diatoms and cyanobacteria, displayed a remarkable plasticity in their photosynthetic machinery manifested as higher abundance of messenger RNAs (mRNAs) involved in photosynthesis and chloroplast ribosomal RNA. Under higher light availability, bacterial mRNAs involved in phosphorus metabolism, mainly from Betaproteobacteria and Cyanobacteria, increased, likely compensating for nutrient depletion in thick biofilms with high biomass. Consumers, including diverse ciliates, displayed community shifts indicating preferential grazing on algae instead of bacteria under higher light. For the first time, we show that the functional integrity of stream biofilms under variable light availability is maintained by structure-function adaptations on several trophic levels. Our findings shed new light on complex biofilms, or "microbial jungles", where in analogy to forests, diverse and multitrophic level communities lend stability to ecosystem functioning. This multitrophic level perspective, coupling metatranscriptomics to process measurements, could advance understanding of microbial-driven ecosystems beyond biofilms, including planktonic and soil environments.

Keywords: rRNA; diatoms; freshwater; mRNA; metatranscriptomics; microbial eukaryotes.


Figures

Figure 1
Figure 1
The effect of light availability on biofilm‐mediated fluxes and physical appearance. (a) Increased light availability led to a threefold increase in gross primary production (GPP) and biofilm biomass, also visible macroscopically as thicker biofilms (inset, scale bar 1 cm). (b) Daytime uptake of phosphate (P‐PO 4) was elevated in biofilms grown under higher light availability, and these biofilms also depleted the phosphate concentration inside the microcosms during the 6‐hr incubations. For GPP, P‐PO4 uptake and concentration, every point represents a mean of several individual measurements during the week‐long experiment from one individual microcosm. Biomass was measured at the end of the experiment. Shading of the plotting points indicates light treatment (darker shade = lower light intensity). The inset shows vertical cross sections of biofilms with algal and bacterial cells captured by confocal laser scanning microscopy. Green colour represents nucleic acid stain SYTOX green (bacterial cells and eukaryotic nuclei), while red colour represents chlorophyll a autofluorescence. Scale bar: 20 μm [Colour figure can be viewed at http://wileyonlinelibrary.com]
Figure 2
Figure 2
The response of dominant and subdominant taxa to varying light availability. The RDA ordinations display variability in sample composition of dominant (a,c) and subdominant (b,d) genus‐level taxa (based on rRNA abundance). Ordinations were constrained to light (measured light intensity), which varies along the x‐axis. Circles represent samples, and crosses represent taxa (a–b). In c–d, the taxa‐based ordinations (circles) have been correlated to an ordination of functional mRNA categories (SEED Subsystems level 2) of the same samples (diamonds) using Procrustes rotation. Grey lines connect taxa (rRNA)‐based and mRNA‐based points from the same sample. Correlation statistics are indicated in the plots. Shading of the plotting points indicates light treatment (darker shade = lower light intensity). Dominant taxa are the top 50 most abundant genus‐level taxa in the data set, while subdominant taxa were defined as the 51st to 100th most abundant taxa
Figure 3
Figure 3
The relative abundances of the main biofilm taxa on a broad taxonomic level. The Krona chart (centre) displays overall relative abundance of SSU rRNA‐derived sequencing reads of all samples (n = 9). Taxa are coloured according to functional group: Phototrophs = greens, consumers = reds and heterotrophic bacteria = blues (brown shades indicate higher‐level taxa encompassing several functional groups). The bar plots (a–d) display relative abundances of specific taxa in response to the different light conditions (normalized to assigned SSU reads per sample and expressed as a percentage). Taxa are displayed according to major functional groups: Consumers (a: macro–meio consumers, b: microconsumers), phototrophic taxa (c) and heterotrophic bacteria (d). Bars are shaded to indicate the light condition (darker shade = lower light intensity). Error bars refer to standard deviation of the mean (n = 3), and significant differences between the light treatments are indicated with asterisks (*p < .05) according to taxa‐wise negative binomial GLMs with Benjamini–Hochberg correction for multiple testing (as implemented in edger)
Figure 4
Figure 4
The response of genus‐level taxa of the biofilm functional groups phototrophs (a), heterotrophic bacteria (b) and consumers (c) to light availability. Every circle represents a genus‐level taxon, with the area of the circle scaled to the average relative abundance of the taxon across all light treatments. The position along the y‐axis shows the average fold change of taxa in the highest light vs. lowest light availability treatments. The taxa are grouped by major taxonomical groups (phylum–class level), except for low‐abundance taxa which are collected in the artificial group “other” for each functional group. White and shaded circles with black outline represent taxa that are significantly more abundant in the highest light and lowest light availability treatment, respectively. Circles with a grey outline represent taxa that do not differ significantly in abundance between the highest and lowest light availability treatments. Selected taxa that are mentioned in the text are pointed out with arrows
Figure 5
Figure 5
The relative abundances of biofilm functional gene transcripts. The Krona chart (centre) displays overall relative abundance of mRNA reads assigned to functional categories (SEED subsystems) of all samples (n = 9) while a–c displays mRNA reads involved in the key functions photosynthesis (a,c) and phosphorous metabolism (b) in response to the different light conditions. Read counts were normalized to assigned mRNA reads per sample and expressed as a percentage. Bars are shaded to indicate the light condition (darker shade = lower light intensity). Error bars refer to standard deviation of the mean (n = 3), and significant differences between the light treatments are indicated with asterisks (*p < .05) according to subsystem‐wise negative binomial GLMs with Benjamini–Hochberg correction for multiple testing (as implemented in edger)

Comment in

Similar articles

Cited by

References

    1. Adlboller, M. (2013). Hydrologic stochasticity and biodiversity of biofilm algae. MSc Thesis, University of Vienna.
    1. Alexander, H. , Jenkins, B. D. , Rynearson, T. A. , & Dyhrman, S. T. (2015). Metatranscriptome analyses indicate resource partitioning between diatoms in the field. Proceedings of the National Academy of Sciences of the United States of America, 112, 2182–2190. 10.1073/pnas.1421993112 - DOI - PMC - PubMed
    1. Altschul, S. F. , Gish, W. , Miller, W. , Myers, E. W. , & Lipman, D. J. (1990). Basic local alignment search tool. Journal of Molecular Biology, 215, 403–410. 10.1016/S0022-2836(05)80360-2 - DOI - PubMed
    1. Amin, S. A. , Hmelo, L. R. , van Tol, H. M. , Durham, B. P. , Carlson, L. T. , Heal, K. R. , … Armbrust, E. V. (2015). Interaction and signalling between a cosmopolitan phytoplankton and associated bacteria. Nature, 522, 98–101. 10.1038/nature14488 - DOI - PubMed
    1. Amin, S. A. , Parker, M. S. , & Armbrust, E. V. (2012). Interactions between diatoms and bacteria. Microbiology and Molecular Biology Reviews, 76, 667–684. 10.1128/MMBR.00007-12 - DOI - PMC - PubMed

Publication types